SlideShare una empresa de Scribd logo
1 de 32
Descargar para leer sin conexión
Elsevier Editorial System(tm) for Environmental and Experimental Botany
                      Manuscript Draft


Manuscript Number:


Title: Biomonitoring of urban habitat quality by anatomical and chemical leaf characteristics


Article Type: Research Article


Keywords: passive biomonitoring, herb, air pollution, geostatistical analysis, leaf area per mass


Corresponding Author: Ms. Wajira Kumuduni Balasooriya,


Corresponding Author's Institution: Gent University


First Author: Wajira K Balasooriya


Order of Authors: Wajira K Balasooriya; Roeland Samson; Frankline Mbikwa; Udayakantha W
Vitharana; Pascal Boeckx; Marc Van Meirvenne


Abstract: This study focused on the potential of specific leaf area, stomatal density and stomatal
pore surface as easy-to-measure plant parameters in low cost biomonitoring of urban habitat
quality with a high spatial resolution. The study area (81.5 km2) was the city of Gent, Belgium. In
the study area 148 sampling locations were identified within four land use classes. Specific leaf
area, stomatal density, stomatal pore surface, minimal stomatal resistance, chlorophyll a and b, C
and N content, δ13C and δ15N in the leaf samples of a common herbaceous plant Taraxacum
officinalis were measured. The stomatal pore surface and minimal stomatal resistance of T.
officinalis varied significantly between land use classes. In the harbor and industry land use class
and the urban land use class a 27% and 21% lower mean stomatal pore surface at the abaxial leaf
surface, and a 29% and 27% lower mean stomatal pore surface at the adaxial leaf surface was
observed compared to that in the pasture land use class. The minimal stomatal resistance at the
abaxial leaf surface was significantly higher in the urban land use class and harbor and industry
land use class by 28% and 29%, respectively compared to that in the pasture land use class. In
addition, urbanized and industrial land use classes as the harbour and industry and the urban land
use classes showed significantly lower δ13C values compared to pasture land use class. The
specific leaf area, stomatal parameters and δ13C data were geostatistically analysed to understand
their spatial variation. The spatial distributions of stomatal pore surface and minimal stomatal
resistance varied considerably across the study area, indicating a different habitat quality from the
harbour area in the north, over the city centre in the middle and the industrial areas in the south,
compared to off city areas. Spatial patterns of δ13C showed depleted δ13C levels in city areas
indicating the diluted δ13C in the urban atmosphere by fuel combustion. We concluded that
stomatal characteristics seem to be the most promising parameter for estimating urban habitat
quality.
Manuscript
Click here to view linked References


          Biomonitoring of urban habitat quality by anatomical and chemical leaf characteristics


          Authors: B.L.W.K. Balasooriya1,2, R. Samson*1, F. Mbikwa 1, U. W.A.Vitharana3, P. Boeckx2, M.

          Van Meirvenne3
          1
              Department of Bioscience Engineering, University of Antwerp, Groenenborgerlaan 171, 2020

          Antwerpen, Belgium
          2
              Laboratory of Applied Physical Chemistry- ISOFYS, Faculty of Bioscience Engineering, Ghent

          University, Coupure Links 653, 9000 Gent, Belgium
          3
              Department of Soil Management and Soil Care, Faculty of Bioscience Engineering, Ghent

          University, Coupure Links 653, 9000 Gent, Belgium


          Abstract

          This study focused on the potential of specific leaf area, stomatal density and stomatal pore surface

          as easy-to-measure plant parameters in low cost biomonitoring of urban habitat quality with a high

          spatial resolution. The study area (81.5 km2) was the city of Gent, Belgium. In the study area 148

          sampling locations were identified within four land use classes. Specific leaf area, stomatal density,

          stomatal pore surface, minimal stomatal resistance, chlorophyll a and b, C and N content, δ13C and

          δ15N in the leaf samples of a common herbaceous plant Taraxacum officinalis were measured. The

          stomatal pore surface and minimal stomatal resistance of T. officinalis varied significantly between

          land use classes. In the harbor and industry land use class and the urban land use class a 27% and

          21% lower mean stomatal pore surface at the abaxial leaf surface, and a 29% and 27% lower mean

          stomatal pore surface at the adaxial leaf surface was observed compared to that in the pasture land

          use class. The minimal stomatal resistance at the abaxial leaf surface was significantly higher in the

          urban land use class and harbor and industry land use class by 28% and 29%, respectively

          compared to that in the pasture land use class. In addition, urbanized and industrial land use classes

          as the harbour and industry and the urban land use classes showed significantly lower δ13C values
compared to pasture land use class. The specific leaf area, stomatal parameters and δ13C data were

geostatistically analysed to understand their spatial variation. The spatial distributions of stomatal

pore surface and minimal stomatal resistance varied considerably across the study area, indicating a

different habitat quality from the harbour area in the north, over the city centre in the middle and the

industrial areas in the south, compared to off city areas. Spatial patterns of δ13C showed depleted

δ13C levels in city areas indicating the diluted δ13C in the urban atmosphere by fuel combustion. We

concluded that stomatal characteristics seem to be the most promising parameter for estimating

urban habitat quality.


*corresponding author. Tel.: +32-3-2653437; Fax: +32-3-2653225

E-mail address: roeland.samson@ua.ac.be

Keywords: passive biomonitoring, herb, air pollution, geostatistical analysis, leaf area per mass


Introduction

Urban ecosystems are comprised of diverse land uses including commercial, industrial, residential,

transport, recreational, agricultural and nature areas, resulting in different habitats for plants,

animals and humans within the urban landscape. Urban habitat quality comprises the integration of

different abiotic and biotic components making up the habitat, such as air, soil and water quality,

microclimate and the presence of vegetation. Due to variations in both the abiotic and biotic

components urban habitat quality will vary between different land uses.

Data on atmospheric, soil or water quality are erroneous or inadequate to show variations of urban

habitat quality since these data do not provide information on synergistic, antagonistic or additive

effects of chemicals in complex pollutant mixtures and integrated responses in biological tissues

which vary with prevailing microclimatic conditions. Biological monitoring procedures are thus

required to evaluate urban habitat quality. Advantages of biomonitoring have been discussed

frequently (Martin and Coughtrey, 1982; Wittig, 1993).


                                                                                                      2
Lichens are the most studied species as biomonitors of urban air quality. In numerous studies their

bioaccumulation potential of trace elements and alteration of physiology and population changes

due to poor air quality have been proven (Bennett and Wetmore, 1999; Ra et al., 2005). Tree

species such as oak (Quercus ilex) (Alfani et al., 2000), and pine needles (Jensen et al., 1992) also

showed significant potential for accumulating trace elements and persistent organic compounds.

Taraxacum officinalis is a common herbaceous weed that has been frequently studied as a

biomonitor of environmental pollution (Kuleff and Djingova, 1984; Djingova and Kuleff, 1999) and

has been used in a number of regional scale studies in Poland (Kabata–Pendias and Dudka, 1991),

Hungary (Kovac et al., 1993), USA (Keane et al., 2001), Germany (Winter et al., 1999), and

Canada (Marr et al., 1999). Most of these studies focused, however, on the use of T. officinalis for

biomonitoring of trace metals.

Plant physiological parameters have also been used frequently as bio–indicators of urban habitat

quality. For example, chlorophyll fluorescence (Sgardelis et al., 1994), chlorophyll content (Ali,

1991), photosynthetic gas exchange rate, stomatal conductance and transpiration rate (Moraes et al.,

2003) showed significant responses to air quality. Also analysis of visible leaf damage together with

leaf chemical contents in various standard species (N. tabacum Bel W3, Petunia hybrida cv.

Mirage, Gladiolus hybrida cv. White friendship, L. multiflorum italicum cv. Lema) have been used

to characterize local air pollution (Klumpp et al., 1994; Moraes et al., 2002).

Less attention has been given to morphological and anatomical parameters of plants as indicators of

long term responses to changing (urban) habitat quality, although parameters as specific leaf area,

stomatal density and pore surface were recognized to vary depending on microclimatic conditions

(Barber et al., 2004). Moreover, sampling and analysis of these parameters is relatively easy and

inexpensive.

Beside the limited attention given to morphological and anatomical plant parameters, the use of

stable isotope techniques in plant ecological research has grown steadily during the past two

decades (Dawson et al., 2002). Stable isotopes can serve as integrators of how plants interact with,


                                                                                                   3
and responded to, the quality of their habitat. Genetic and environmental factors that influence gas

exchange through morphological and functional plant responses cause changes in plant δ13C content

(Ehleringer, 1993). For example δ13C in plants were found to reflect the habitat quality in relation to

the land use in Karlsruhe (Germany) and Gent (Belgium) (Norra et al., 2005; Boeckx et al., 2006).

δ13C in ambient air is about -8 ‰. Fossil fuel burning can locally reduce this value to about -12 ‰

(Kiyoshu and Kidoguchi, 1998). Therefore, δ13C content of plants grown in areas with poor air

quality due to fossil fuel burning is expected to be lower compared to areas with a better air quality.

In addition, variation in foliar δ13C content has been related to leaf size (Geber and Dawson, 1990)

and thickness and stomatal density (Hultline and Marshall, 2000).

The main objective of this study was to asses the potential of anatomical leaf characteristics

(specific leaf area, stomatal density and dimension) and leaf (bio)chemical characteristics

(chlorophyll a and b, C and N content, δ13C and δ15N) as effective parameters for biomonitoring of

urban habitat quality.


                                                                                                     4
Material and Methods


Study area description

The study area covered 81.5 km2 within the urban and suburban surrounding of the city of Gent,

Belgium (51° 00´ N, 3° 50´ E). Gent urban area includes several industrial zones, densely populated

areas, a harbour and network of busy highways and train tracks, urban green, agriculture and nature

areas (Boeckx et al., 2006). The predominant wind flow across the area is from southwest to

northeast. Besides the densely populated central area several moderately densely populated areas

are situated at northwest (Wondelgem-Mariakerke) northeast (Oostakker-Sint-Amandsberg and

Destelbergen) and southeast (Heusden, Melle-Merelbeke and Ledeberg-Gentbrugge) of the study

area (Figure 1). In the north of the study area, the harbour of Gent and associated industrial areas

are situated. Main industrial, commercial and service areas are situated around the city centre and in

the southern part of the city near the crossing of E17 and E40 European highways. The agricultural

area consists of pasture and arable land and is mainly situated in the eastern and upper northwest

part of the study area. The Bourgoyen-Ossemeersen nature reserve which mainly consists of wet

meadows covers a large area at the eastern part (220 ha). Forested areas are rather limited and

scattered. Urban green areas are even more scattered.

The different land uses of the study area were classified into 4 land use classes: urban (U) including

the city centre and suburban areas and roads, urban green (UG) including urban green and forested

areas, harbour and industry (HI) including the harbour, industrial areas and railways, and pasture

(P) land use class covering all pasture and grass lands (Figure 1).


Plant sampling

Figure 2 shows the position of the 148 sampling locations inside the study area. These

georeferenced sampling locations were obtained from a previous study (Boeckx et al., 2006), and

were selected within the different land use classes as mentioned above, using a partially random and


                                                                                                    5
partially grid sampling design. Dandelion (T. officinalis Weber complex), a commonly distributed

wild herb species, was selected for the study. At each sampling location, four fully grown plants at

flowering stage which were 1–3 m apart were selected for sampling from mid August till mid

October, 2005.


Specific leaf area and stomatal characteristics

From each of the four selected plants at each sampling location, four fully grown undamaged leaves

were collected. Specific leaf area (SLA) (cm2 g-1) of each plant was calculated by dividing total

single sided fresh leaf area (measured with Li–3000 leaf area meter, Li–COR, Lincoln, Nebraska)

by its oven dry weight (60°C for 24 hours).

Stomatal imprints at both the adaxial and abaxial side of a fully grown mature leaf of each sampled

plant were collected to determine stomatal density (SD) (the number of stomata per mm2 leaf area)

and stomatal pore surface (SPS) (the surface area of a widely opened stomatal pore, µm2). Stomatal

imprints were made on attached leaves by applying colourless nail varnish and peeling off the

surface with a transparent adhesive tape which was then fixed on a microscope slide. Nail varnish

was applied to an area of approximately one cm2 in the middle portion of the selected leaves

(Elagoz et al., 2006), to the right of the mid vein, avoiding areas overlying veins. Stomatal imprints

were analyzed with a light microscope (Wild Leitz GMBH 020–505.030) connected with a TV

screen at a magnification of 40 X 10. First, the statistical minimal number of microscopic fields

(Nmin) that should be counted on a single imprint was calculated for each land use class using the

student–t–test (Equation 1). Therefore, in four randomly selected sub-sampling points of each

considered land use class the number of stomata in 25 microscopic fields was counted to determine

Nmin.


         2.064 2  2
N min   2       *S                                               (1)
         X / 100 


                                                                                                    6
where 2.064 is the t–value for (25-1) degrees of freedom, with a threshold value of p = 0.05, X and

S are the mean and the standard deviation of the counted stomata in the microscopic fields,

respectively. Subsequently, the number of stomata for each stomatal imprint was counted on Nmin

microscopic fields for the respective land use class. SD was calculated by dividing the amount of

stomata by the surface area of a microscopic field after calibration with a calibration plate. The SPS

(µm2) was calculated by measuring length (L) (m) and width (W) (m) of widely opened stomata,

and by assuming an elliptical shape:


        L *W * 
SPS                                                                  (2)
           4

The theoretical minimal stomatal resistance (Rs) was calculated as:


         4l   L W
RS                                                                  (3)
       nLWD 4nLWD


where Rs is the stomatal resistance (s m-1), l is the stomatal pore depth (m), D is the diffusion

coefficient of water vapour in air (24.2*10-6 m2 s-1 at 20°C) and n is the stomatal density (number of

stomata m-2). Stomatal depth was assumed as 10 μm (Samson et al., 2000; Olyslaegers et al., 2002).


Sample preparation and chemical analysis

A composite sample for chemical analysis was made of the dried leaves from the four sub-samples

collected at each location. The pooled samples could be considered as point samples relative to the

size of the investigated area. Sub-samples were ground using an ultra-centrifugal mill (ZM200,

Retsch Germany). Samples were weighed separately in tin cups and analyzed in triplicate for C (%),

N (%), δ13C (‰) and δ15N (‰) using an elemental analyzer (EA) (ANCA-SL, Europa PDZ, UK)

coupled to an Isotope Ratio Mass Spectrometer (IRMS) (20-20, SerCon, UK) (Boeckx et al., 2006).

Isotope ratios and percent element were measured during one sample run, i.e. the IRMS was tuned

                                                                                                    7
in “dual mode” to enable simultaneous analysis of C and N. Sub-samples were also used for the

spectrophotometric (Uvikon 930, Kontron Instruments, Milan, Italy) determination of chlorophyll a

and b (g/mg), according to the methodology described by Lichtenthaler (1987).


Data analysis and geostatistical data processing

First, the temporal effect of the sampling duration was examined by means of linear regression

between the measured variables and the date of sampling, but no effect was observed. Differences

of the plant parameters between the land use classes were analyzed using analysis of variance

(ANOVA) with Duncan test (p = 0.05) using SPSS 12.0 software.

Geostatistical analysis was carried out for several selected parameters (SLA, abaxial SPS, abaxial

Rs, and δ13C). Spatial distribution of the parameters which did not show differences across land use

classes was elucidated by means of ordinary kriging. Simple Kriging with Varying Local Means

(SKLM) method was applied to the parameters which show significant differences between land

use classes. Both methods are based on the general kriging estimator with different assumptions.

Consider a random variable Z that has been measured at n locations, z(xα), α = 1,…,n, the kriging

estimator at an unsampled location x0 can be written as:


                           n ( x0 )
Z * ( x 0 )  m( x 0 )    λ
                            α 1
                                      α    [ Z ( x α )  m( x α )]   (4)

where n(x0) is the number of neighbourhood measurements z(xα) used for estimating Z * (x 0 ) , λ α are

the weights assigned to data z(xα) which are considered to be a realization of the random variable Z

and m(x 0 ) and m(x α ) are the expected values (or means) of Z * (x 0 ) and Z (x α ) . In ordinary kriging, it

is assumed that of Z * (x 0 ) and Z (x α ) are unknown, but locally stationary. The SKLM procedure uses

the secondary information, in this case land use class, to estimate Z * (x 0 ) and Z (x α ) . Extensive

discussion on these kriging methods can be found in Goovaerts (1997).


                                                                                                             8
Results

Variation between land use classes

The SLA varied between 130.1 and 472.1 cm2 g-1 over the study area (Table 1). Although SLA was

not significantly different between land use classes, mean SLA in UG, HI, and U was 297.8, 283.1,

273.8 cm2 g-1, respectively, which was an increase by 22%, 16% and 12% compared to the mean

SLA (244.8 cm2 g-1) in P.

Abaxial SPS varied between 11.0 and 44.5 μm2 over the study area, while adaxial SPS ranged from

15.5 to 64.6 μm2 (Table 1). As illustrated in Figure 3a, mean abaxial SPS in HI and U were

significantly lower compared to that of UG and P. This decrease in HI and U was 27% and 21%,

respectively, compared to P. Similar differences between land use classes were observed for adaxial

SPS (Figure 3b). Stomatal density at the abaxial side varied from 136.8 to 314.1 stomata mm-2 over

the study area. At the adaxial side, SD was lower than the abaxial values and ranged from 56.8 to

173.0 stomata mm-2 of leaf area (Table 1). SD showed an opposite pattern of variation between land

use classes compared to that observed for SPS. The adaxial variation in SD was more pronounced

compared to the abaxial variation, with a mean adaxial SD in HI of 121.2 mm-2 which was 13%

higher than SD in P (107.4 mm-2). Rs at the abaxial side varied from 41.8 to 250.3 s m-1. At the

adaxial side Rs was higher and ranged from 66.5 to 303.9 s m-1 (Table 1). Both abaxial and adaxial

Rs was higher in HI and U than in P and UG. For both sides, mean Rs in U was significantly (p<

0.05) different from P and UG, while for HI this was only the case for the abaxial side.

Chlorophyll a content varied between 30.8 and 158.4 mg g-1 within the study area, whereas,

chlorophyll b content varied from 15.2 to 127.3 mg g-1 (Table 2). Carbon content ranged from 35.0

to 56.2%, while N content of these leaves ranged from 0.9 to 6.3 %. δ15 N and δ13C values ranged

from –4.7‰ to 6.9‰ and from –34.3 to –26.3 ‰, respectively. Among the analyzed leaf

(bio)chemical parameters chlorophyll b, C and N content were not significantly different between

the land use classes. However, chlorophyll a content in UG was significantly higher compared to P

and HI land use classes, for which the lowest values were observed. Stable isotope abundances were


                                                                                                 9
not significantly different between land use classes for δ15N, while significantly higher δ13C values

were observed in P compared to the other land use classes. The urbanized and industrial land use

classes (U and HI) showed the lowest δ13C values.


Spatial distribution

SLA was ordinary krigged to understand its spatial variation. However, significant differences

observed for abaxial SPS, abaxial Rs and δ13C across different land use classes allowed to consider

land use as secondary information to predict these variables using SKLM. Firstly, the experimental

omnidirectional variograms of SLA and of the residuals of abaxial SPS, abaxial Rs and δ13C were

calculated and modelled using Variowin software (Figure 4). Table 3 summarises the variogram

parameters; range, sill, nugget and relative nugget effect of the modelled variograms. The maximum

value of semivariance () is known as the sill. The lag distance (h) where variogram reaches to sill

is known as range, which is the critical part of variogram because the observations located within

the range are spatially correlated. The semivariance when h = 0 is known as nugget, which is an

estimate of the residual error or spatially uncorrelated noise. Relative nugget effect is the ratio

between nugget and sill (Burrough and McDonnell, 1998), which quantifies the strength of spatial

structure. All variograms of the considered parameters show a bounded structure with ranges of 881

to 4000 m. The small relative nugget effects (0 – 28%) depicted by all parameters indicated a strong

spatial correlation inside their ranges (Goovaerts, 1997).

It is clear that in the central part of the study area, SPS decreased from the industrial zone and Melle

-Merelbeke residential area (southern part), over the city centre (middle) to the harbour in the

northern part (Figure 5). In addition, lower values were observed in the residential areas in

Oostakker–Sint–Amandsberg and Destelbergen suburban areas in north east and Heusden suburban

area in the eastern part. High SPS was observed in western part of the study area in Bourgoyen–

Ossemeersen nature reserve, in Blaarmeersen recreational area and the surrounding areas with high


                                                                                                     10
biological value, and also in Wondelgem–Mariakerke suburban area which consist of residential

areas with gardens. Intermediate values were found in pasture areas in the east and south–eastern

part of the study area. Two exceptional distributions could be seen with high SPS values in the

southwest of the study area around Gent Sint-Pieters railway station and intermediate values in the

southern industrial area. In contrast to the SLA map (not shown) all pasture areas, urban green and

forested areas are prominently appearing in the SPS map (Figure 5).

Highest δ13C was observed around Dampoort and Sint-Pieters railway stations, which are also busy

traffic points, and at Ledeberg where the E17 highway enters the city (Figure 6). In addition, higher

values were observed around the harbour, in the city centre, in the suburban residential areas in

Oostakker–Sint–Amandsberg and Destelbergen in the northeast, Heusden suburban area in the

eastern part and Melle–Merelbeke residential area at the southern part. Low values were observed

in grasslands including the Bourgoyen–Ossemeersen nature reserve, Blaarmeersen recreational

area, and pasture areas in the eastern part.

The spatial distribution of Rs (map not shown) yielded mostly comparable information to that of

SPS (Figure 5), whereas the spatial distribution of SLA (map not shown) did not allow

distinguishing clear spatial patterns which could be easily linked to land use (see also Table 3).


Discussion


Spatial distribution of SLA

Leaf area and specific leaf area have been studied at several locations as a biomonitoring parameter

of urban habitat quality, especially urban air quality (Carreras et al., 1996; Lima et al., 2000;

Moraes et al., 2002 and Verma and Singh, 2006).

SLA of T. officinialis measured by Poorter and de Jong (1999), 368-378 cm² g-1, was higher than

our mean value observed, but fell within the observed range in this study (Table 1). We observed


                                                                                                     11
significantly higher SLA values in UG and HI which are located in more urbanized and intensive

road traffic areas compared to P located in less urbanized areas (Figure 1). The spatial distribution

map of SLA (map not shown) tends to indicates high values in dense traffic and industrialised areas

and low SLA values in the less urbanised areas including the nature reserve Bourgoyen–

Ossemeersen. In agreement with our results, Carreras et al. (1996) found a significant increase of

SLA by 38% in Ligustrum lucidum in areas with high road traffic compared to less intensive road

traffic areas in the city of Córdoba, Argentina.

Several studies found a leaf area reduction in polluted sites in comparison to less polluted sites. For

example, a 40 and 17% leaf area reduction was observed in polluted sites in comparison to less

polluted sites in India for two tree species namely, Ficus religiosa and Thevetia nerifolia,

respectively (Verma and Singh, 2006). Lima et al. (2000) and Moraes et al. (2002) also observed a

reduction in leaf area of Phaseolus vulgaris and Tibouchina pulchara in polluted city areas of

Brazil compared to forested areas. In agreement we observed a leaf area reduction in more

urbanized land use classes, i.e. 37 and 39% reduction in U and UG compared to P, respectively. As

SLA increased in more industrialised land use classes compared to P (data and map not shown), and

simultaneously leaf area decreased (data not shown), leaf thickness should have been seriously

reduced in the more urbanized areas suggesting plants invested less energy in their leaves as their

longevity decreased due to poor habitat quality. Smaller leaves reduce the contact area between

plant and atmosphere, which leads to a reduced absorption of obnoxious gases and a decreased

deposition on the leaf’s surface. Decreased urban habitat quality to an inferior air quality can thus

largely explain the observed differences in our study area. However, the largest mean SLA is

observed in UG compared to HI, U and P. This could be an adaptation to possible lower irradiance

levels in shaded habitats (Ashton et al., 1999) in UG where trees and shrubs are abundant. In

contrast, T. officinalis is more a species of open terrains. Frequent mowing in home gardens in

Wondelgem–Mariakerke in the northwest corner of the study area, may be another reason for thick

leaves, and thus low SLA values. Unexpected low SLA values observed in a larger part of the


                                                                                                    12
harbour area can not be related to road traffic or shaded conditions in this habitat. However, soil or

water availability can be stress factors in this area.


Spatial distribution of stomatal characteristics

In accordance with our results, T. nerifolia showed a 47% increase in SD and 30% decrease in

stomatal size at polluted sites compared to a less polluted site in India (Verma and Singh, 2006).

However, in the same study the opposite result was obtained for F. religiosa, with a 59% reduction

in SD and a 40% increase in stomatal size at the high polluted site. Garg and Varshney (1980) also

reported a reduction of stomatal size by air pollution. Alessio et al. (2002) observed an increase in

stomatal resistance in response to air pollution by road traffic. Stomatal responses are regarded as

avoidance mechanisms plants employ in controlling the amount of air pollutants (e.g. O3) entering

the leaves (Andersen, 2003). As suggested by Poole et al. (2000), both SD and aperture (here

indicated by SPS) affect stomatal resistance, as they are both inversely proportional to Rs (see

equation 3). We observed a spatial distribution of abaxial SPS with low values in a north south

central band in the study area, where more urbanization and road traffic is concentrated (Figure 5),

which could indicate an increased stomatal resistance in these areas. However, the higher SD

observed in these areas suggests a reduced stomatal resistance. The net effect is that the calculated

abaxial stomatal resistance increased along a more or less similar north south central band in the

study area (map not shown) indicating decreased stomatal size overshadows increased stomatal

density. So, our measurements clearly indicate plants react to a decreased habitat quality, mainly

due to air pollution, by decreasing the size of the stomata and increasing their density. This way

plants can more ‘fine-tune’ their gas exchange with the environment, thereby avoiding as much as

possible the uptake of air pollutants, and optimising CO2-uptake for photosynthesis in relation to

water losses by transpiration.


                                                                                                   13
Spatial distribution of δ13C

We observed significantly higher δ13C values (less negative) in P compared to the other land use

classes. More urbanized and industrial land use classes (HI and U) showed lowest δ13C values

(more negative). The spatial distribution of δ13C indicates highest δ13C values around Dampoort and

Sint-Pieters railway stations and at Ledeberg where the E17 highway enters the city (Figure 6). At

all these points the intensive traffic is slowing down. In addition, higher values were observed

around the northern harbour, in the city centre and several suburban residential areas compared to

low values in eastern grasslands and Bourgoyen–Ossemeersen. This depletion in foliar δ13C values

can be due to the decreased average δ13C of ambient air in areas with high road traffic and domestic

heating. Theoretically, plants growing in fossil–fuel–CO2-contaminated areas, such as major cities,

industrial centres, and highway borders, should assimilate a mixture of atmospheric CO2 with a

δ13C value of –8.0‰ and of fossil fuel derived CO2 with a δ13C value of –27.3‰. This isotopic

difference should, thus, be recorded in plant carbon. Lichtfouse et al., (2003) revealed that grasses

growing near a major highway in Paris (France) have strikingly depleted δ13C values, averaging at –

35.1‰, versus rural grasses that show an average δ13C value of –30.6‰. We observed a lower

average depletion (about 2‰) in δ13C in T. offinalis in the urban area of Gent (about 230,000

inhabitants) which can be related to a lower degree of urbanization and traffic than in Paris and a

lower sensitivity of the selected plant species. As our study was conducted in the same study area as

used by Boeckx et al. (2006) and was mainly based on the same sampling points, we can assume a

mean soil δ13C of -27.2‰ as reported by Boeckx et al. (2006). Compared to this mean δ13C value,

δ13C of T. officinalis was 3.0‰ depleted. Boeckx et al. (2006) and Norra et al. (2005) found a

relative depletion for grass, in more urbanized areas compared to pasture land in Gent, and not

specified herbs in Karlsruhe (Germany) of 2.7 and 3.9‰, respectively. Boeckx et al. (2006)

attributed this to increased fossil fuel burning and the proximity to road traffic. However, at the

three areas, where maximum δ13C values were observed in this study (Dampoort and Sint-Pieters

railway stations and at the entrance of E17 highway in Lederberg where traffic slows down),


                                                                                                  14
average δ13C in T. officinalis was –33.8‰, showing a 5‰ depletion, which is in agreement with the

study by Lichtfouse et al., (2003). Air samples were collected at these 3 places to check the

expected depletion of δ13C in ambient air. Results revealed an average δ13C of –11.0‰ (–12.8‰ to

9.2‰) in ambient air. In agreement with these results, fossil fuel burning decreased the average

δ13C of ambient air from its atmospheric average (–8‰) to values ranging from –13.5‰ to –11.0‰

in Toyama city (Japan) (Kiyoshu and Kidoguchi, 1998) and from –19.8‰ to –8.8‰ in Paris

(France) (Widory and Javoy, 1998). However, air samples taken at Bourgoyen nature reserve also

showed a δ13C value of –10.5‰ (11.8‰ to 9.15‰). This can be due to recycling of respired CO2 by

the predominantly C3 grass species in the area. Two opposing factors may influence ecosystem

δ13C in urban areas: first, physiological stress caused by atmospheric and soil pollutants may reduce

the ratio of intercellular to ambient CO2 and increase the expected values of δ13C, while second,

δ13C dilution of the urban atmosphere by fossil fuel combustion may decrease δ13C, when plants

incorporate the depleted air into their biomass (Flanagan et al., 2005). In contrast to our results,

Norra et al., (2005) observed less negative plant δ13C downwind from the industrial area in the city

of Karlsruhe (Germany) and suggested that the injurious effects of airborne pollution on stomatal

aperture results in a reduced discrimination. Also the enriched δ13C values in grass samples

observed by Boeckx et al. (2006) in Gent city centre were explained as reduced discrimination due

to plant stress such as nutrient depletion, drought or air pollution.


Potential as bio-indicator

Based on the variation between land use classes and the spatial distribution maps, stomatal

characteristics, especially SPS and Rs, reveal the highest contrast between land use classes. The

latter integrates changes in as well SD as size. Spatial distribution maps of stomatal characteristics

allow to distinguish urban habitat quality with a very high spatial resolution, provided the sampling

network is dense enough. As can be seen from Figure 5 these parameters even allow to distinguish

very clearly e.g. the urban green areas. This result is due to the fact that stomata are the key factors


                                                                                                     15
in the vegetation–atmosphere interaction. Although, deposition of airborne particles will mainly

occur at the adaxial side of the mainly horizontally oriented leaves of T. officinalis, a similar pattern

of variation between land use classes of stomatal parameters at both sides showed that stomata at

both surfaces react similarly to the environment. However, significantly higher SD and significantly

lower SPS at the abaxial compared to the adaxial side suggests that abaxial sampling will be more

effective. Also δ13C shows potential as bio-indicator. It reveals complementary information to

stomatal characteristics, as can be seen from the isotopic signatures measured at both railway

stations and some areas around Blaarmeersen recreational area, indicating relatively undisturbed

wet meadows (Figure 6). Results for SLA and chlorophyll a were less straightforward, as they can

be influenced by a multitude of factors like water availability, nutrients, air temperature and light

amongst others. Chlorophyll b, C, N and δ15N content of the T. officinalis leaves showed less

potential as a bio-indicator since they were not significantly different between the land use classes

in the study area.


Conclusions

The spatial distribution of δ13C of T. officinalis in Gent follows the urban land use and associated

human activities. More depleted plant δ13C in more urbanized areas indicates contamination of the

air with combustion products of fossil fuel. Spatial variation of anatomical parameters of T.

officinalis as specific leaf area, stomatal pore surface and stomatal density indicate differences in

urban habitat quality for plant growth. These plant parameters, especially those related to stomatal

characteristics, have a large potential as easy to measure and cost-effective bio-indicators to monitor

urban habitat quality. Specific leaf area is the easiest parameter to determine, but the stomatal

parameters show the highest potential to discriminate between different land use classes. Just as

reported by other authors we conclude that T. officinalis is a suitable bio-indicator of urban habitat

quality as it is a commonly distributed species, which is easy to sample and shows a clear

morphological and anatomical response to differences in habitat quality. Due to the fact that causes


                                                                                                      16
of variation in discrimination of δ13C are complex, correlations between δ13C and a single factor

such as stomatal pore surface or stomatal density is problematic, and has not been observed in this

study in contrast to what was observed by Hultline and Marshall (2000). Therefore, further studies

are needed to establish such correlations, and to find out if other species, or other parameters, are

more sensitive to differences in urban habitat quality and air pollution, and are thus better suited for

passive biomonitoring.


Acknowledgements

We thank Jan Vermeulen and Eric Gilis for δ13C analysis. We thank the inhabitants and

administrative services of the city of Gent for permission to take samples. We are grateful to the

Special research fund (BOF) of University Gent for granting a scholarship to the first author to

carry out the research.


References

Alessio, M., Anselmi, S., Conforto, L., Improta, S., Manes, F., Manfra, L., 2002. Radiocarbon as a
      biomarker of urban pollution in leaves of evergreen species sampled in Rome and in rural
      areas (Lazio–Central Italy). Atmospheric Environment 36, 5405–5416.
Alfani, A., Baldantoni, D., Maisto, G., Bartoli, G., De Santo, A. V., 2000. Temporal and spatial
      variation in C, N, S and trace element contents in the leaves of Quercus ilex within the urban
      area of Naples. Environmental Pollution, 109, 119–129.
Ali, E.A., 1991. Damage to plants due to industrial pollution and their use as bioindicators in Egypt.
      Environmental Pollution 81, 251–255.
Andersen, C.P., 2003. Source–sink balance and carbon allocation below ground in plants exposed to
      ozone. New Phytologist 157, 213–228.
Ashton, P.M.S., Yoon, H.S., Thadani, R., Berlyn, G.P., 1999. Seedling leaf structure of New
      England maples in relation to light environment. Forest Science 45, 512–519.
Barber, J.L., Thomas, G.O., Kerstiens, G., Jones, K.C., 2004. Current issues and uncertainties in the
      measurement and modelling of air-vegetation exchange and within-plant processing of POPs.
      Environmental Pollution 128, 99–138.


                                                                                                     17
Bennett, J.P., Wetmore, C.M., 1999. Changes in element contents of selected lichens over 11 years
     in northern Minnesota, USA. Environmental and Experimental Botany 41, 75–82.
Boeckx, P., Van Meirvenne, M., Raulo, F., Van Cleemput, O., 2006. Spatial patterns of delta C–13
     and delta N–15 in the urban topsoil of Gent, Belgium. Organic Geochemistry 37, 1383–1393.
Burrough, P.A., McDonnell, R.A., 1998. Principles of geographical information systems. Oxford
     University Press, Oxford.
Carreras, H.A., Cañas, M.S., Pignata, M.L., 1996. Differences in responses to urban air pollutants
     by Ligustrum lucidum Ait. and Ligustrum lucidum Ait. f. tricolor (Rehd.). Environmental
     Pollution 93, 211–218.
Dawson, T.E., Mambelli, S., Plamboeck, A.H., Templer, P.H., Tu, K.P., 2002. Stable isotopes in
     plant ecology. Annu. Rev. Ecol. Syst. 33, 507–559.
Djingova, R., Kuleff, I., 1999. Seasonal variations in the metal concentration of Taraxacum
     officinale, Plantago major and Plantago lanceolata. Chemistry and Ecology 16, 239–253.
Ehleringer, J.R., 1993. Variation in leaf carbon isotope discrimination in Encelia farinose:
     implications for growth, competition and drought survival. Oecologia 95, 340–346
Elagoz, V., Han, S.S., Manning, W. J., 2006. Acquired changes in stomatal characteristics in
     response to ozone during plant growth and leaf development of bush beans (Phaseolus
     vulgaris L.) indicate phenotypic plasticity. Environmental Pollution 140, 395–405.
Flanagan, L.B., Ehleringer, J.R., Pataki, D.E., 2005. Stable isotopes and Biosphere-atmosphere
     interactions: Processes and biological controls. Elsevier, San Diego.

Garg, K.K., Varshney, C. K., 1980. Effect of air pollution on the leaf epidermis at the
     submicroscopic level. Cellular and Molecular Life Sciences 36, 1364–1366.
Geber, M.A., Dawson, T.E., 1990. Genetic variation in and covariation between leaf gas exchange,
     morphology, and development in Polygonum arenastrum, an annual plant. Oecologia 85, 53–
     58.
Goovaerts, P., 1997. Geostatistics for natural resource evaluation. Oxford University Press, New
     York.
Hultline, K.R., Marshall, J.D., 2000. Altitude trends in conifer leaf morphology and stable carbon
     isotope composition. Oecologia 123, 32–40.
Jensen, S., Eriksson, G., Kylin, H., Strachan, W.M.J., 1992. Atmospheric pollution by persistent
     organic compounds: Monitoring with pine needles. Chemosphere 24, 229–245.
Kabata-Pendias, A., Dudka, S., 1991. Trace metal contents of Taraxacum officinale (dandelion) as a
     conventional environmental indicator. Environmental and Geochemical Health 13, 108–113.


                                                                                               18
Keane, B., Collier, M.H., Shann, J.R., Rogstad, S. H., 2001. Metal content of dandelion (Taraxacum
     officinale) leaves in relation to soil contamination and airborne particulate matter. Science of
     the Total Environment 281, 63–78.
Kiyoshu, Y., Kidoguchi, M., 1998. Carbon isotope ratio in street leaves: an indicator for the
     environmental assessment of the atmosphere. Mineralogical Magazine, 62A, 785–786.
Klumpp, A., Klumpp, G., Domingos, M., 1994. Plants as bioindicators of air pollution at the Serra
     do Mar near the industrial complex of Cubatão, Brazil. Environmental Pollution 85, 109–116.
Kovac, P., Turcsanyi, G., Penksza, K., Kaszab, L., Szöke, P., 1993. Heavy metal accumulation by
     ruderal and cultivated plants in a heavily polluted district of Budapest. In: Markert, B. (Ed.),
     Plants as Biomonitors, 495–505.
Kuleff, I., Djingova, R., 1984. The dandelion (Taraxacum officinale)-A monitor for environmental
     pollution? Water, Air and Soil Pollution 21, 77–85.
Lichtenthaler,   H.K.,   1987.   Chlorophylls    and   carotenoids:   pigments    of   photosynthetic
     biomembranes. Methods in Enzymology 148, 350–382.
Lichtfouse, E., Lichtfouse, M., Jaffrezic, A., 2003. Delta C-13 values of grasses as a novel indicator
     of pollution by fossil-fuel-derived greenhouse gas CO2 in urban areas. Environmental Science
     & Technology 37, 87–89.
Lima, J.S., Fernandes, E.B., Fawcett, W.N., 2000. Mangifera indica and Phaseolus vulgaris in the
     bioindication of air pollution in Bahia, Brazil. Ecotoxicology and Environmental Safety 46,
     275–278.
Marr, K., Fyles, H., Hendershot, W., 1999. Trace metals in Montreal urban soils and the leaves of
     Taraxacum officinale. Canadian Journal Soil Science, 79, 385–387.
Martin, M.H., Coughtrey, P.J., 1982. Biological monitoring of heavy metal pollution: land and air.
     Applied Science Publishers, New York.
Moraes, R.M., Delitti W.B.C., Moraes, J.A.P.V., 2003. Gas exchange, growth, and chemical
     parameters in a native Atlantic forest tree species in polluted areas of Cubatao, Brazil.
     Ecotoxicology and Environmental Safety 54, 339–345.
Moraes, R.M., Klumpp, A., Furlan, C.M., Klumpp, G., Domingos, M., Rinaldi, M.C.S., Modesto,
     I.F., 2002. Tropical fruit trees as bioindicators of industrial air pollution in southeast Brazil.
     Environment International 28, 367–374.
Norra, S., Handley, L.L., Berner, Z., Stüben, D., 2005. 13C and 15N abundances of urban soils and
     herbaceous vegetation in Karlsruhe, Germany, Eur. J. Soil Sc. 56, 607–620.
Olyslaegers, G., Nijs, I., Roebben, J., Kockelbergh, F., Vanassche, F., Laker, M., Verbelen, J.P.,
     Samson, R., Lemeur, R., Impens, I., 2002. Morphological and physiological indicators of


                                                                                                    19
tolerance to atmospheric stress in two sensitive and two tolerant tea clones in South Africa.
     Experimental Agriculture 38, 397–410.
Osborn, J.M., Taylor, T.N., 1990. Morphological and ultrastructural studies of plant cuticular
     membranes: Sun and shade leaves of Quercus velutina(Fagacea). Botanical Gazette151, 465-
     476.
Poole, I., Lawson, T., Weyers, J.D.B., Raven, J.A., 2000. Effect of elevated CO2 on the stomatal
     distribution and leaf physiology of Alnus glutinosa. New Phytologist 145, 511–521.
Poorter, H., De Jong, R., 1999. A comparison of specific leaf area, chemical composition and leaf
     construction costs of field plants from 15 habitats differing in productivity. New Phytologist
     143, 163–167.
Ra, H.S.Y., Geiser, L.H., Crang, R.F.E., 2005. Effects of season and low-level air pollution on
     physiology and element content of lichens from the U.S. Pacific Northwest. Science of the
     Total Environment 343, 155–167.
Samson, R., Vandenberghe, J., Vanassche, F., Nijs, I., Olysalaegers, G., Kockelbergh, F., Lemeur,
     R., Laker, M., 2000. Detecting sensitivity to extreme climatic conditions in tea: sap flow as a
     potential indicator of drought sensitivity between clones. In: Ceulemans, R., Bogaert, J.,
     Deckmyn, G., Nijs, I. (Eds.), Topics in Ecology: structure and function in plants and
     ecosystems 267–268.
Sgardelis, S., Cook, C.M., Pantis, J.D., Lanaras, T., 1994. Comparison of chlorophyll fluorescence
     and some heavy metal concentrations in Sonchus spp. and Taraxacum spp. along an urban
     pollution gradient. The science of the Total Environment 158, 157–164.
Verma, A., Singh, S., 2006. Biochemical and ultra structural changes in plant foliage exposed to
     auto–pollution, Environmental Monitoring and Assessment 120, 585–602.
Widory, D., Javoy, M., 1998. Air pollution in Paris: a view through δ13C. Mineralogical Magazine
     62A, 1655.
Winter, S., Wappelhorst, O., Leffler, U.S., Korhammer, S., Markert, B., 1999. Biomonitoring in
     Städten mit Taraxacum officinale Web. (Loewenzahn)–Eine Studie in der Stadt Zittau,
     Sachsen. In: Oehlmann, J., Markert, B. (Eds.), Ökotoxicologie/ Ökosystemare Ansätze und
     Methoden 238–247.
Wittig, R. 1993. General aspects of biomonitoring heavy metals by plants. In: Markert, B. (Ed.),
     Plants as biomonitors 3–27.


                                                                                                 20
Tables


Table 1. Descriptive statistics of specific leaf area (SLA), stomatal pore surface (SPS), stomatal

     density (SD), stomatal resistance (Rs) of T. officinalis in the study area (n = 146). Different

     letters indicate significantly different mean values between the abaxial and adaxial side (p<

     0.05)

              SLA (cm2g-1)            SPS (μm2)             SD (no. mm-2)            Rs (sm-1)
                                 Abaxial      Adaxial     Abaxial   Adaxial    Abaxial     Adaxial
Min               130.1            11.0        15.5        136.8     56.8        41.8        66.5
Max               472.1            44.5        64.6        314.1     173.0      250.3       303.9
Mean              277.3           26.0a        32.8b      214.5a    117.2b      110.0a      158.0b
Median            271.8            25.2        33.0        215.1     117.0       97.6       144.4
StD               67.0             9.1         11.3        33.7      23.2        43.3        52.2
g1                0.48           0.069*        0.36*      0.032*     0.10*       1.13        0.84
g2                0.37*           -1.14       -0.66*      -0.30*    -0.33*       0.80       0.21*
Min = minimum value, Max = Maximum value, StD = standard deviation, g1 = skewness, g2 =

kurtosis

*significant normal distribution by t test at α = 0.05.


                                                                                                    21
Table 2. Descriptive statistics of chlorophyll a and chlorophyll b, C and N, δ13C and δ15N of T.

     officinalis in the study area (n = 146).

                 chlorophyll a         chlorophyll b       C        N      δ13C        δ15N
                    (mg g-1)             (mg g-1)         (%)      (%)     (‰)         (‰)
Min                   30.8                 15.2           35.0     0.9     -34.3       -4.7
Max                  158.4                 127.3          56.2     6.3     -26.3        6.9
Mean                 108.3                 58.2           47.7     3.4     -30.2        1.8
Median               112.6                 56.7           40.7     3.2     -30.3        1.9
StD                   30.8                 24.7            4.4     1.1      1.4         5.9
g1                   -0.58                 0.41*          0.86    0.26*    0.3*        -0.3*
g2                   -0.57                 0.26*          0.22*   -0.21*   0.5*        -0.2*
Min = minimum value, Max = Maximum value, StD = standard deviation, g1             =   skewness, g2 =

kurtosis

*significant normal distribution by t test at α = 0.05.


                                                                                                  22
Table 3. Omnidirectional variogram model parameters of SLA, SPS, Rs and δ13C, with indication of

the used model, the range, sill, nugget and the relative nugget effect.


     Variable             Model       Range (m) Sill* Nugget* Rel. nugget effect (%)
SLA (cm2g-1)            Exponential     2255      4500      1260          28
                    2
Abaxial SPS (μm ) Exponential           4000       66        14           22
Abaxial Rs (sm-1)       Exponential     3572      1629      128           8
δ13C (‰)                 Spherical      881        1.7       0            0
*The units are equal to the square of the variable units.


                                                                                             23
Figure Captions

Figure 1. Study area with indication of the 4 land use classes (map scale is in m according to the

   Belgian National Lambert72 projection).

Figure 2. Location of the 148 sampling locations (dots) in the study area.

Figure 3. Abaxial (a) and adaxial (b) average stomatal pore surface (SPS) (μm2) of T. officinalis in

   four land use classes: P = pasture, UG = urban green (urban green plus forest areas), U = urban

   (city, suburban plus road areas), HI = Harbor and Industry (harbor, railways plus industrial

   areas); error bars represent ± 1 standard deviation; n = number of observations per class;

   different letters indicate significantly different mean values at α = 0.05 (Duncan test)

Figure 4. Omnidirectional experimental variograms (dots) and fitted models (line) of SLA (a)

   abaxial SPS (b) abaxial Rs (c) and δ13C (d), h = lag distance in m. Note the different scales of

   the Y axis due to   h  =semivariance in square units of the measurement units.


Figure 5. Spatial distribution of abaxial stomatal pore surface (SPS) in the study area obtained by

   SKLM

Figure 6. The spatial distribution of δ13C (‰) in the study area obtained by SKLM


                                                                                                     24
Figure(s)
Figure(s)
Figure(s)


            (a)

                                 34
                                          Abaxial

                                 32
             Average SPS (µm²)


                                 30


                                 28


                                 26


                                 24


                                 22


                                 20   n=      28     55       26     19
                                      Diff:   a       a       b       b
                                              HI      U       UG     P
                                                    Land Use Class


            (b)

                                 45
                                         Adaxial


                                 40
             Average SPS (µm²)


                                 35


                                 30


                                      n=      28      54      25     19
                                 25   Diff:   a       a        b     b

                                              HI      U       UG     P
                                                    Land Use Class
Figure(s)
Figure(s)
Figure(s)

Más contenido relacionado

La actualidad más candente

Cadmium and lead hazards as occurring with their speciations in periurbain ag...
Cadmium and lead hazards as occurring with their speciations in periurbain ag...Cadmium and lead hazards as occurring with their speciations in periurbain ag...
Cadmium and lead hazards as occurring with their speciations in periurbain ag...Premier Publishers
 
Microarthropds
MicroarthropdsMicroarthropds
Microarthropdsromila123
 
Auwae and Groffman, 2010
Auwae and Groffman, 2010Auwae and Groffman, 2010
Auwae and Groffman, 2010Russell Auwae
 
Environmental impact of biosolids land application
Environmental impact of biosolids land applicationEnvironmental impact of biosolids land application
Environmental impact of biosolids land applicationSilvana Torri
 
Remediation of heavy metals lead, cobalt and copper from industrail wastewate...
Remediation of heavy metals lead, cobalt and copper from industrail wastewate...Remediation of heavy metals lead, cobalt and copper from industrail wastewate...
Remediation of heavy metals lead, cobalt and copper from industrail wastewate...EditorIJAERD
 
The International Journal of Engineering and Science (The IJES)
The International Journal of Engineering and Science (The IJES)The International Journal of Engineering and Science (The IJES)
The International Journal of Engineering and Science (The IJES)theijes
 
Enzyme And Root Activities In Surface Flow Constructed Wetlands
Enzyme And Root Activities In Surface Flow Constructed WetlandsEnzyme And Root Activities In Surface Flow Constructed Wetlands
Enzyme And Root Activities In Surface Flow Constructed Wetlandscolleen0814
 
Fate of cadmium, copper, lead and zinc on soils after the application of dif...
 Fate of cadmium, copper, lead and zinc on soils after the application of dif... Fate of cadmium, copper, lead and zinc on soils after the application of dif...
Fate of cadmium, copper, lead and zinc on soils after the application of dif...Silvana Torri
 
11.[40 51]correlates in groundwater quality parameters and textural classes o...
11.[40 51]correlates in groundwater quality parameters and textural classes o...11.[40 51]correlates in groundwater quality parameters and textural classes o...
11.[40 51]correlates in groundwater quality parameters and textural classes o...Alexander Decker
 
The Influence of Soil Organic Matter on the Uptake of Silver Nanoparticles in...
The Influence of Soil Organic Matter on the Uptake of Silver Nanoparticles in...The Influence of Soil Organic Matter on the Uptake of Silver Nanoparticles in...
The Influence of Soil Organic Matter on the Uptake of Silver Nanoparticles in...Agriculture Journal IJOEAR
 
2005 enriqueta arias et al soil health a new challenge for microbiologist and...
2005 enriqueta arias et al soil health a new challenge for microbiologist and...2005 enriqueta arias et al soil health a new challenge for microbiologist and...
2005 enriqueta arias et al soil health a new challenge for microbiologist and...Germán Tortosa
 
Quantification of Heavy Metals using Contamination and Pollution Index in Sel...
Quantification of Heavy Metals using Contamination and Pollution Index in Sel...Quantification of Heavy Metals using Contamination and Pollution Index in Sel...
Quantification of Heavy Metals using Contamination and Pollution Index in Sel...IJEAB
 
Reilly et al 2013 preprint
Reilly et al 2013 preprintReilly et al 2013 preprint
Reilly et al 2013 preprintEileen Cullen
 
Environmental restoration with deep root herbaceous species. Nicola Era, seni...
Environmental restoration with deep root herbaceous species. Nicola Era, seni...Environmental restoration with deep root herbaceous species. Nicola Era, seni...
Environmental restoration with deep root herbaceous species. Nicola Era, seni...Nicola Era
 
Autecology of Impatients parviflora DC. in natural forest communities
Autecology of Impatients parviflora DC. in natural forest communitiesAutecology of Impatients parviflora DC. in natural forest communities
Autecology of Impatients parviflora DC. in natural forest communitiesEdytaSierka
 
Effects of different land uses on soil quality in sokoto urban fringes
Effects of different land uses on soil quality in sokoto urban fringesEffects of different land uses on soil quality in sokoto urban fringes
Effects of different land uses on soil quality in sokoto urban fringesAlexander Decker
 

La actualidad más candente (20)

Cadmium and lead hazards as occurring with their speciations in periurbain ag...
Cadmium and lead hazards as occurring with their speciations in periurbain ag...Cadmium and lead hazards as occurring with their speciations in periurbain ag...
Cadmium and lead hazards as occurring with their speciations in periurbain ag...
 
Microarthropds
MicroarthropdsMicroarthropds
Microarthropds
 
Course Description
Course DescriptionCourse Description
Course Description
 
Auwae and Groffman, 2010
Auwae and Groffman, 2010Auwae and Groffman, 2010
Auwae and Groffman, 2010
 
Environmental impact of biosolids land application
Environmental impact of biosolids land applicationEnvironmental impact of biosolids land application
Environmental impact of biosolids land application
 
Remediation of heavy metals lead, cobalt and copper from industrail wastewate...
Remediation of heavy metals lead, cobalt and copper from industrail wastewate...Remediation of heavy metals lead, cobalt and copper from industrail wastewate...
Remediation of heavy metals lead, cobalt and copper from industrail wastewate...
 
Modelling soil processes
Modelling soil processesModelling soil processes
Modelling soil processes
 
The International Journal of Engineering and Science (The IJES)
The International Journal of Engineering and Science (The IJES)The International Journal of Engineering and Science (The IJES)
The International Journal of Engineering and Science (The IJES)
 
Enzyme And Root Activities In Surface Flow Constructed Wetlands
Enzyme And Root Activities In Surface Flow Constructed WetlandsEnzyme And Root Activities In Surface Flow Constructed Wetlands
Enzyme And Root Activities In Surface Flow Constructed Wetlands
 
Fate of cadmium, copper, lead and zinc on soils after the application of dif...
 Fate of cadmium, copper, lead and zinc on soils after the application of dif... Fate of cadmium, copper, lead and zinc on soils after the application of dif...
Fate of cadmium, copper, lead and zinc on soils after the application of dif...
 
11.[40 51]correlates in groundwater quality parameters and textural classes o...
11.[40 51]correlates in groundwater quality parameters and textural classes o...11.[40 51]correlates in groundwater quality parameters and textural classes o...
11.[40 51]correlates in groundwater quality parameters and textural classes o...
 
Nanowastes
NanowastesNanowastes
Nanowastes
 
The Influence of Soil Organic Matter on the Uptake of Silver Nanoparticles in...
The Influence of Soil Organic Matter on the Uptake of Silver Nanoparticles in...The Influence of Soil Organic Matter on the Uptake of Silver Nanoparticles in...
The Influence of Soil Organic Matter on the Uptake of Silver Nanoparticles in...
 
Pdf 55555555
Pdf 55555555Pdf 55555555
Pdf 55555555
 
2005 enriqueta arias et al soil health a new challenge for microbiologist and...
2005 enriqueta arias et al soil health a new challenge for microbiologist and...2005 enriqueta arias et al soil health a new challenge for microbiologist and...
2005 enriqueta arias et al soil health a new challenge for microbiologist and...
 
Quantification of Heavy Metals using Contamination and Pollution Index in Sel...
Quantification of Heavy Metals using Contamination and Pollution Index in Sel...Quantification of Heavy Metals using Contamination and Pollution Index in Sel...
Quantification of Heavy Metals using Contamination and Pollution Index in Sel...
 
Reilly et al 2013 preprint
Reilly et al 2013 preprintReilly et al 2013 preprint
Reilly et al 2013 preprint
 
Environmental restoration with deep root herbaceous species. Nicola Era, seni...
Environmental restoration with deep root herbaceous species. Nicola Era, seni...Environmental restoration with deep root herbaceous species. Nicola Era, seni...
Environmental restoration with deep root herbaceous species. Nicola Era, seni...
 
Autecology of Impatients parviflora DC. in natural forest communities
Autecology of Impatients parviflora DC. in natural forest communitiesAutecology of Impatients parviflora DC. in natural forest communities
Autecology of Impatients parviflora DC. in natural forest communities
 
Effects of different land uses on soil quality in sokoto urban fringes
Effects of different land uses on soil quality in sokoto urban fringesEffects of different land uses on soil quality in sokoto urban fringes
Effects of different land uses on soil quality in sokoto urban fringes
 

Similar a Article In Journal; Biomonitoring Of Urban Habitata Quality Using Leaf Anatomical And Chemical Characteristics

GSS_Poster_JFC_rescue
GSS_Poster_JFC_rescueGSS_Poster_JFC_rescue
GSS_Poster_JFC_rescueStenka Vulova
 
Numerical simulation of bioremediation of poly aromatic hydrocarbon polluted
Numerical simulation of bioremediation of poly aromatic hydrocarbon pollutedNumerical simulation of bioremediation of poly aromatic hydrocarbon polluted
Numerical simulation of bioremediation of poly aromatic hydrocarbon pollutedIAEME Publication
 
Effect of vegetation cover on sediment yield an empirical study through plots...
Effect of vegetation cover on sediment yield an empirical study through plots...Effect of vegetation cover on sediment yield an empirical study through plots...
Effect of vegetation cover on sediment yield an empirical study through plots...Alexander Decker
 
Effect of land use and land cover change on some soil chemical and physical p...
Effect of land use and land cover change on some soil chemical and physical p...Effect of land use and land cover change on some soil chemical and physical p...
Effect of land use and land cover change on some soil chemical and physical p...Alexander Decker
 
COMPLETE THESIS - HWR PRINT VERSION
COMPLETE THESIS - HWR PRINT VERSIONCOMPLETE THESIS - HWR PRINT VERSION
COMPLETE THESIS - HWR PRINT VERSIONGavin Fielding
 
Surface and ground water pollution in abata ogun agricultural wetland
Surface and ground water pollution in abata ogun agricultural wetlandSurface and ground water pollution in abata ogun agricultural wetland
Surface and ground water pollution in abata ogun agricultural wetlandAlexander Decker
 
Chemical and spectroscopy of peat from West and Central Kalimantan, Indonesia...
Chemical and spectroscopy of peat from West and Central Kalimantan, Indonesia...Chemical and spectroscopy of peat from West and Central Kalimantan, Indonesia...
Chemical and spectroscopy of peat from West and Central Kalimantan, Indonesia...Agriculture Journal IJOEAR
 
The Role of Soil Organisms and Functions in different Coconut based Multiple ...
The Role of Soil Organisms and Functions in different Coconut based Multiple ...The Role of Soil Organisms and Functions in different Coconut based Multiple ...
The Role of Soil Organisms and Functions in different Coconut based Multiple ...Agriculture Journal IJOEAR
 
Improvement in biological characteristics of alkaline soils by using pressmud
Improvement in biological characteristics of alkaline soils by using pressmudImprovement in biological characteristics of alkaline soils by using pressmud
Improvement in biological characteristics of alkaline soils by using pressmudIAEME Publication
 
Impact of long term application of agrochemicals on the agro-ecology of the l...
Impact of long term application of agrochemicals on the agro-ecology of the l...Impact of long term application of agrochemicals on the agro-ecology of the l...
Impact of long term application of agrochemicals on the agro-ecology of the l...Alexander Decker
 
Growth, gas exchanges and accumulation of inorganic matter of Populus nigra L...
Growth, gas exchanges and accumulation of inorganic matter of Populus nigra L...Growth, gas exchanges and accumulation of inorganic matter of Populus nigra L...
Growth, gas exchanges and accumulation of inorganic matter of Populus nigra L...Innspub Net
 
Treatment Performance of Domestic Wastewater in a Tropical Constructed Wetlan...
Treatment Performance of Domestic Wastewater in a Tropical Constructed Wetlan...Treatment Performance of Domestic Wastewater in a Tropical Constructed Wetlan...
Treatment Performance of Domestic Wastewater in a Tropical Constructed Wetlan...Oswar Mungkasa
 
Bacteria and Fungi Population of Surface Soils under Various Land Use Types i...
Bacteria and Fungi Population of Surface Soils under Various Land Use Types i...Bacteria and Fungi Population of Surface Soils under Various Land Use Types i...
Bacteria and Fungi Population of Surface Soils under Various Land Use Types i...BRNSS Publication Hub
 
The multivariate statistical analysis of the environmental pollutants at lake...
The multivariate statistical analysis of the environmental pollutants at lake...The multivariate statistical analysis of the environmental pollutants at lake...
The multivariate statistical analysis of the environmental pollutants at lake...Alexander Decker
 
IRJET- Assessment of Farmers’ Perception Towards the Adoption of Soil and Wat...
IRJET- Assessment of Farmers’ Perception Towards the Adoption of Soil and Wat...IRJET- Assessment of Farmers’ Perception Towards the Adoption of Soil and Wat...
IRJET- Assessment of Farmers’ Perception Towards the Adoption of Soil and Wat...IRJET Journal
 
Influence of Climatic Factors on the Δ13c Values of the C3, C4 And CAM Dicot ...
Influence of Climatic Factors on the Δ13c Values of the C3, C4 And CAM Dicot ...Influence of Climatic Factors on the Δ13c Values of the C3, C4 And CAM Dicot ...
Influence of Climatic Factors on the Δ13c Values of the C3, C4 And CAM Dicot ...QUESTJOURNAL
 
Remediation of heavy metals lead, cobalt and copper from industrail wastewate...
Remediation of heavy metals lead, cobalt and copper from industrail wastewate...Remediation of heavy metals lead, cobalt and copper from industrail wastewate...
Remediation of heavy metals lead, cobalt and copper from industrail wastewate...EditorIJAERD
 

Similar a Article In Journal; Biomonitoring Of Urban Habitata Quality Using Leaf Anatomical And Chemical Characteristics (20)

GSS_Poster_JFC_rescue
GSS_Poster_JFC_rescueGSS_Poster_JFC_rescue
GSS_Poster_JFC_rescue
 
Numerical simulation of bioremediation of poly aromatic hydrocarbon polluted
Numerical simulation of bioremediation of poly aromatic hydrocarbon pollutedNumerical simulation of bioremediation of poly aromatic hydrocarbon polluted
Numerical simulation of bioremediation of poly aromatic hydrocarbon polluted
 
Numerical simulation of bioremediation of poly aromatic hydrocarbon polluted
Numerical simulation of bioremediation of poly aromatic hydrocarbon pollutedNumerical simulation of bioremediation of poly aromatic hydrocarbon polluted
Numerical simulation of bioremediation of poly aromatic hydrocarbon polluted
 
Effect of vegetation cover on sediment yield an empirical study through plots...
Effect of vegetation cover on sediment yield an empirical study through plots...Effect of vegetation cover on sediment yield an empirical study through plots...
Effect of vegetation cover on sediment yield an empirical study through plots...
 
Effect of land use and land cover change on some soil chemical and physical p...
Effect of land use and land cover change on some soil chemical and physical p...Effect of land use and land cover change on some soil chemical and physical p...
Effect of land use and land cover change on some soil chemical and physical p...
 
Variability of Some Soil Physicochemical Properties on Lithosequence in Funtu...
Variability of Some Soil Physicochemical Properties on Lithosequence in Funtu...Variability of Some Soil Physicochemical Properties on Lithosequence in Funtu...
Variability of Some Soil Physicochemical Properties on Lithosequence in Funtu...
 
COMPLETE THESIS - HWR PRINT VERSION
COMPLETE THESIS - HWR PRINT VERSIONCOMPLETE THESIS - HWR PRINT VERSION
COMPLETE THESIS - HWR PRINT VERSION
 
Surface and ground water pollution in abata ogun agricultural wetland
Surface and ground water pollution in abata ogun agricultural wetlandSurface and ground water pollution in abata ogun agricultural wetland
Surface and ground water pollution in abata ogun agricultural wetland
 
Chemical and spectroscopy of peat from West and Central Kalimantan, Indonesia...
Chemical and spectroscopy of peat from West and Central Kalimantan, Indonesia...Chemical and spectroscopy of peat from West and Central Kalimantan, Indonesia...
Chemical and spectroscopy of peat from West and Central Kalimantan, Indonesia...
 
The Role of Soil Organisms and Functions in different Coconut based Multiple ...
The Role of Soil Organisms and Functions in different Coconut based Multiple ...The Role of Soil Organisms and Functions in different Coconut based Multiple ...
The Role of Soil Organisms and Functions in different Coconut based Multiple ...
 
Improvement in biological characteristics of alkaline soils by using pressmud
Improvement in biological characteristics of alkaline soils by using pressmudImprovement in biological characteristics of alkaline soils by using pressmud
Improvement in biological characteristics of alkaline soils by using pressmud
 
Impact of long term application of agrochemicals on the agro-ecology of the l...
Impact of long term application of agrochemicals on the agro-ecology of the l...Impact of long term application of agrochemicals on the agro-ecology of the l...
Impact of long term application of agrochemicals on the agro-ecology of the l...
 
Influence of Row Covers on Soil Loss & Plant Growth in White Cabbage Cultivat...
Influence of Row Covers on Soil Loss & Plant Growth in White Cabbage Cultivat...Influence of Row Covers on Soil Loss & Plant Growth in White Cabbage Cultivat...
Influence of Row Covers on Soil Loss & Plant Growth in White Cabbage Cultivat...
 
Growth, gas exchanges and accumulation of inorganic matter of Populus nigra L...
Growth, gas exchanges and accumulation of inorganic matter of Populus nigra L...Growth, gas exchanges and accumulation of inorganic matter of Populus nigra L...
Growth, gas exchanges and accumulation of inorganic matter of Populus nigra L...
 
Treatment Performance of Domestic Wastewater in a Tropical Constructed Wetlan...
Treatment Performance of Domestic Wastewater in a Tropical Constructed Wetlan...Treatment Performance of Domestic Wastewater in a Tropical Constructed Wetlan...
Treatment Performance of Domestic Wastewater in a Tropical Constructed Wetlan...
 
Bacteria and Fungi Population of Surface Soils under Various Land Use Types i...
Bacteria and Fungi Population of Surface Soils under Various Land Use Types i...Bacteria and Fungi Population of Surface Soils under Various Land Use Types i...
Bacteria and Fungi Population of Surface Soils under Various Land Use Types i...
 
The multivariate statistical analysis of the environmental pollutants at lake...
The multivariate statistical analysis of the environmental pollutants at lake...The multivariate statistical analysis of the environmental pollutants at lake...
The multivariate statistical analysis of the environmental pollutants at lake...
 
IRJET- Assessment of Farmers’ Perception Towards the Adoption of Soil and Wat...
IRJET- Assessment of Farmers’ Perception Towards the Adoption of Soil and Wat...IRJET- Assessment of Farmers’ Perception Towards the Adoption of Soil and Wat...
IRJET- Assessment of Farmers’ Perception Towards the Adoption of Soil and Wat...
 
Influence of Climatic Factors on the Δ13c Values of the C3, C4 And CAM Dicot ...
Influence of Climatic Factors on the Δ13c Values of the C3, C4 And CAM Dicot ...Influence of Climatic Factors on the Δ13c Values of the C3, C4 And CAM Dicot ...
Influence of Climatic Factors on the Δ13c Values of the C3, C4 And CAM Dicot ...
 
Remediation of heavy metals lead, cobalt and copper from industrail wastewate...
Remediation of heavy metals lead, cobalt and copper from industrail wastewate...Remediation of heavy metals lead, cobalt and copper from industrail wastewate...
Remediation of heavy metals lead, cobalt and copper from industrail wastewate...
 

Último

Measures of Position DECILES for ungrouped data
Measures of Position DECILES for ungrouped dataMeasures of Position DECILES for ungrouped data
Measures of Position DECILES for ungrouped dataBabyAnnMotar
 
Q4-PPT-Music9_Lesson-1-Romantic-Opera.pptx
Q4-PPT-Music9_Lesson-1-Romantic-Opera.pptxQ4-PPT-Music9_Lesson-1-Romantic-Opera.pptx
Q4-PPT-Music9_Lesson-1-Romantic-Opera.pptxlancelewisportillo
 
week 1 cookery 8 fourth - quarter .pptx
week 1 cookery 8  fourth  -  quarter .pptxweek 1 cookery 8  fourth  -  quarter .pptx
week 1 cookery 8 fourth - quarter .pptxJonalynLegaspi2
 
Active Learning Strategies (in short ALS).pdf
Active Learning Strategies (in short ALS).pdfActive Learning Strategies (in short ALS).pdf
Active Learning Strategies (in short ALS).pdfPatidar M
 
4.16.24 21st Century Movements for Black Lives.pptx
4.16.24 21st Century Movements for Black Lives.pptx4.16.24 21st Century Movements for Black Lives.pptx
4.16.24 21st Century Movements for Black Lives.pptxmary850239
 
Multi Domain Alias In the Odoo 17 ERP Module
Multi Domain Alias In the Odoo 17 ERP ModuleMulti Domain Alias In the Odoo 17 ERP Module
Multi Domain Alias In the Odoo 17 ERP ModuleCeline George
 
Beauty Amidst the Bytes_ Unearthing Unexpected Advantages of the Digital Wast...
Beauty Amidst the Bytes_ Unearthing Unexpected Advantages of the Digital Wast...Beauty Amidst the Bytes_ Unearthing Unexpected Advantages of the Digital Wast...
Beauty Amidst the Bytes_ Unearthing Unexpected Advantages of the Digital Wast...DhatriParmar
 
DIFFERENT BASKETRY IN THE PHILIPPINES PPT.pptx
DIFFERENT BASKETRY IN THE PHILIPPINES PPT.pptxDIFFERENT BASKETRY IN THE PHILIPPINES PPT.pptx
DIFFERENT BASKETRY IN THE PHILIPPINES PPT.pptxMichelleTuguinay1
 
Expanded definition: technical and operational
Expanded definition: technical and operationalExpanded definition: technical and operational
Expanded definition: technical and operationalssuser3e220a
 
Daily Lesson Plan in Mathematics Quarter 4
Daily Lesson Plan in Mathematics Quarter 4Daily Lesson Plan in Mathematics Quarter 4
Daily Lesson Plan in Mathematics Quarter 4JOYLYNSAMANIEGO
 
Concurrency Control in Database Management system
Concurrency Control in Database Management systemConcurrency Control in Database Management system
Concurrency Control in Database Management systemChristalin Nelson
 
Transaction Management in Database Management System
Transaction Management in Database Management SystemTransaction Management in Database Management System
Transaction Management in Database Management SystemChristalin Nelson
 
ESP 4-EDITED.pdfmmcncncncmcmmnmnmncnmncmnnjvnnv
ESP 4-EDITED.pdfmmcncncncmcmmnmnmncnmncmnnjvnnvESP 4-EDITED.pdfmmcncncncmcmmnmnmncnmncmnnjvnnv
ESP 4-EDITED.pdfmmcncncncmcmmnmnmncnmncmnnjvnnvRicaMaeCastro1
 
Man or Manufactured_ Redefining Humanity Through Biopunk Narratives.pptx
Man or Manufactured_ Redefining Humanity Through Biopunk Narratives.pptxMan or Manufactured_ Redefining Humanity Through Biopunk Narratives.pptx
Man or Manufactured_ Redefining Humanity Through Biopunk Narratives.pptxDhatriParmar
 
Student Profile Sample - We help schools to connect the data they have, with ...
Student Profile Sample - We help schools to connect the data they have, with ...Student Profile Sample - We help schools to connect the data they have, with ...
Student Profile Sample - We help schools to connect the data they have, with ...Seán Kennedy
 
Unraveling Hypertext_ Analyzing Postmodern Elements in Literature.pptx
Unraveling Hypertext_ Analyzing  Postmodern Elements in  Literature.pptxUnraveling Hypertext_ Analyzing  Postmodern Elements in  Literature.pptx
Unraveling Hypertext_ Analyzing Postmodern Elements in Literature.pptxDhatriParmar
 
BIOCHEMISTRY-CARBOHYDRATE METABOLISM CHAPTER 2.pptx
BIOCHEMISTRY-CARBOHYDRATE METABOLISM CHAPTER 2.pptxBIOCHEMISTRY-CARBOHYDRATE METABOLISM CHAPTER 2.pptx
BIOCHEMISTRY-CARBOHYDRATE METABOLISM CHAPTER 2.pptxSayali Powar
 
Team Lead Succeed – Helping you and your team achieve high-performance teamwo...
Team Lead Succeed – Helping you and your team achieve high-performance teamwo...Team Lead Succeed – Helping you and your team achieve high-performance teamwo...
Team Lead Succeed – Helping you and your team achieve high-performance teamwo...Association for Project Management
 

Último (20)

Measures of Position DECILES for ungrouped data
Measures of Position DECILES for ungrouped dataMeasures of Position DECILES for ungrouped data
Measures of Position DECILES for ungrouped data
 
Q4-PPT-Music9_Lesson-1-Romantic-Opera.pptx
Q4-PPT-Music9_Lesson-1-Romantic-Opera.pptxQ4-PPT-Music9_Lesson-1-Romantic-Opera.pptx
Q4-PPT-Music9_Lesson-1-Romantic-Opera.pptx
 
week 1 cookery 8 fourth - quarter .pptx
week 1 cookery 8  fourth  -  quarter .pptxweek 1 cookery 8  fourth  -  quarter .pptx
week 1 cookery 8 fourth - quarter .pptx
 
Active Learning Strategies (in short ALS).pdf
Active Learning Strategies (in short ALS).pdfActive Learning Strategies (in short ALS).pdf
Active Learning Strategies (in short ALS).pdf
 
4.16.24 21st Century Movements for Black Lives.pptx
4.16.24 21st Century Movements for Black Lives.pptx4.16.24 21st Century Movements for Black Lives.pptx
4.16.24 21st Century Movements for Black Lives.pptx
 
Mattingly "AI & Prompt Design: Large Language Models"
Mattingly "AI & Prompt Design: Large Language Models"Mattingly "AI & Prompt Design: Large Language Models"
Mattingly "AI & Prompt Design: Large Language Models"
 
Multi Domain Alias In the Odoo 17 ERP Module
Multi Domain Alias In the Odoo 17 ERP ModuleMulti Domain Alias In the Odoo 17 ERP Module
Multi Domain Alias In the Odoo 17 ERP Module
 
Beauty Amidst the Bytes_ Unearthing Unexpected Advantages of the Digital Wast...
Beauty Amidst the Bytes_ Unearthing Unexpected Advantages of the Digital Wast...Beauty Amidst the Bytes_ Unearthing Unexpected Advantages of the Digital Wast...
Beauty Amidst the Bytes_ Unearthing Unexpected Advantages of the Digital Wast...
 
DIFFERENT BASKETRY IN THE PHILIPPINES PPT.pptx
DIFFERENT BASKETRY IN THE PHILIPPINES PPT.pptxDIFFERENT BASKETRY IN THE PHILIPPINES PPT.pptx
DIFFERENT BASKETRY IN THE PHILIPPINES PPT.pptx
 
Expanded definition: technical and operational
Expanded definition: technical and operationalExpanded definition: technical and operational
Expanded definition: technical and operational
 
Daily Lesson Plan in Mathematics Quarter 4
Daily Lesson Plan in Mathematics Quarter 4Daily Lesson Plan in Mathematics Quarter 4
Daily Lesson Plan in Mathematics Quarter 4
 
Concurrency Control in Database Management system
Concurrency Control in Database Management systemConcurrency Control in Database Management system
Concurrency Control in Database Management system
 
Paradigm shift in nursing research by RS MEHTA
Paradigm shift in nursing research by RS MEHTAParadigm shift in nursing research by RS MEHTA
Paradigm shift in nursing research by RS MEHTA
 
Transaction Management in Database Management System
Transaction Management in Database Management SystemTransaction Management in Database Management System
Transaction Management in Database Management System
 
ESP 4-EDITED.pdfmmcncncncmcmmnmnmncnmncmnnjvnnv
ESP 4-EDITED.pdfmmcncncncmcmmnmnmncnmncmnnjvnnvESP 4-EDITED.pdfmmcncncncmcmmnmnmncnmncmnnjvnnv
ESP 4-EDITED.pdfmmcncncncmcmmnmnmncnmncmnnjvnnv
 
Man or Manufactured_ Redefining Humanity Through Biopunk Narratives.pptx
Man or Manufactured_ Redefining Humanity Through Biopunk Narratives.pptxMan or Manufactured_ Redefining Humanity Through Biopunk Narratives.pptx
Man or Manufactured_ Redefining Humanity Through Biopunk Narratives.pptx
 
Student Profile Sample - We help schools to connect the data they have, with ...
Student Profile Sample - We help schools to connect the data they have, with ...Student Profile Sample - We help schools to connect the data they have, with ...
Student Profile Sample - We help schools to connect the data they have, with ...
 
Unraveling Hypertext_ Analyzing Postmodern Elements in Literature.pptx
Unraveling Hypertext_ Analyzing  Postmodern Elements in  Literature.pptxUnraveling Hypertext_ Analyzing  Postmodern Elements in  Literature.pptx
Unraveling Hypertext_ Analyzing Postmodern Elements in Literature.pptx
 
BIOCHEMISTRY-CARBOHYDRATE METABOLISM CHAPTER 2.pptx
BIOCHEMISTRY-CARBOHYDRATE METABOLISM CHAPTER 2.pptxBIOCHEMISTRY-CARBOHYDRATE METABOLISM CHAPTER 2.pptx
BIOCHEMISTRY-CARBOHYDRATE METABOLISM CHAPTER 2.pptx
 
Team Lead Succeed – Helping you and your team achieve high-performance teamwo...
Team Lead Succeed – Helping you and your team achieve high-performance teamwo...Team Lead Succeed – Helping you and your team achieve high-performance teamwo...
Team Lead Succeed – Helping you and your team achieve high-performance teamwo...
 

Article In Journal; Biomonitoring Of Urban Habitata Quality Using Leaf Anatomical And Chemical Characteristics

  • 1. Elsevier Editorial System(tm) for Environmental and Experimental Botany Manuscript Draft Manuscript Number: Title: Biomonitoring of urban habitat quality by anatomical and chemical leaf characteristics Article Type: Research Article Keywords: passive biomonitoring, herb, air pollution, geostatistical analysis, leaf area per mass Corresponding Author: Ms. Wajira Kumuduni Balasooriya, Corresponding Author's Institution: Gent University First Author: Wajira K Balasooriya Order of Authors: Wajira K Balasooriya; Roeland Samson; Frankline Mbikwa; Udayakantha W Vitharana; Pascal Boeckx; Marc Van Meirvenne Abstract: This study focused on the potential of specific leaf area, stomatal density and stomatal pore surface as easy-to-measure plant parameters in low cost biomonitoring of urban habitat quality with a high spatial resolution. The study area (81.5 km2) was the city of Gent, Belgium. In the study area 148 sampling locations were identified within four land use classes. Specific leaf area, stomatal density, stomatal pore surface, minimal stomatal resistance, chlorophyll a and b, C and N content, δ13C and δ15N in the leaf samples of a common herbaceous plant Taraxacum officinalis were measured. The stomatal pore surface and minimal stomatal resistance of T. officinalis varied significantly between land use classes. In the harbor and industry land use class and the urban land use class a 27% and 21% lower mean stomatal pore surface at the abaxial leaf surface, and a 29% and 27% lower mean stomatal pore surface at the adaxial leaf surface was observed compared to that in the pasture land use class. The minimal stomatal resistance at the abaxial leaf surface was significantly higher in the urban land use class and harbor and industry land use class by 28% and 29%, respectively compared to that in the pasture land use class. In addition, urbanized and industrial land use classes as the harbour and industry and the urban land
  • 2. use classes showed significantly lower δ13C values compared to pasture land use class. The specific leaf area, stomatal parameters and δ13C data were geostatistically analysed to understand their spatial variation. The spatial distributions of stomatal pore surface and minimal stomatal resistance varied considerably across the study area, indicating a different habitat quality from the harbour area in the north, over the city centre in the middle and the industrial areas in the south, compared to off city areas. Spatial patterns of δ13C showed depleted δ13C levels in city areas indicating the diluted δ13C in the urban atmosphere by fuel combustion. We concluded that stomatal characteristics seem to be the most promising parameter for estimating urban habitat quality.
  • 3. Manuscript Click here to view linked References Biomonitoring of urban habitat quality by anatomical and chemical leaf characteristics Authors: B.L.W.K. Balasooriya1,2, R. Samson*1, F. Mbikwa 1, U. W.A.Vitharana3, P. Boeckx2, M. Van Meirvenne3 1 Department of Bioscience Engineering, University of Antwerp, Groenenborgerlaan 171, 2020 Antwerpen, Belgium 2 Laboratory of Applied Physical Chemistry- ISOFYS, Faculty of Bioscience Engineering, Ghent University, Coupure Links 653, 9000 Gent, Belgium 3 Department of Soil Management and Soil Care, Faculty of Bioscience Engineering, Ghent University, Coupure Links 653, 9000 Gent, Belgium Abstract This study focused on the potential of specific leaf area, stomatal density and stomatal pore surface as easy-to-measure plant parameters in low cost biomonitoring of urban habitat quality with a high spatial resolution. The study area (81.5 km2) was the city of Gent, Belgium. In the study area 148 sampling locations were identified within four land use classes. Specific leaf area, stomatal density, stomatal pore surface, minimal stomatal resistance, chlorophyll a and b, C and N content, δ13C and δ15N in the leaf samples of a common herbaceous plant Taraxacum officinalis were measured. The stomatal pore surface and minimal stomatal resistance of T. officinalis varied significantly between land use classes. In the harbor and industry land use class and the urban land use class a 27% and 21% lower mean stomatal pore surface at the abaxial leaf surface, and a 29% and 27% lower mean stomatal pore surface at the adaxial leaf surface was observed compared to that in the pasture land use class. The minimal stomatal resistance at the abaxial leaf surface was significantly higher in the urban land use class and harbor and industry land use class by 28% and 29%, respectively compared to that in the pasture land use class. In addition, urbanized and industrial land use classes as the harbour and industry and the urban land use classes showed significantly lower δ13C values
  • 4. compared to pasture land use class. The specific leaf area, stomatal parameters and δ13C data were geostatistically analysed to understand their spatial variation. The spatial distributions of stomatal pore surface and minimal stomatal resistance varied considerably across the study area, indicating a different habitat quality from the harbour area in the north, over the city centre in the middle and the industrial areas in the south, compared to off city areas. Spatial patterns of δ13C showed depleted δ13C levels in city areas indicating the diluted δ13C in the urban atmosphere by fuel combustion. We concluded that stomatal characteristics seem to be the most promising parameter for estimating urban habitat quality. *corresponding author. Tel.: +32-3-2653437; Fax: +32-3-2653225 E-mail address: roeland.samson@ua.ac.be Keywords: passive biomonitoring, herb, air pollution, geostatistical analysis, leaf area per mass Introduction Urban ecosystems are comprised of diverse land uses including commercial, industrial, residential, transport, recreational, agricultural and nature areas, resulting in different habitats for plants, animals and humans within the urban landscape. Urban habitat quality comprises the integration of different abiotic and biotic components making up the habitat, such as air, soil and water quality, microclimate and the presence of vegetation. Due to variations in both the abiotic and biotic components urban habitat quality will vary between different land uses. Data on atmospheric, soil or water quality are erroneous or inadequate to show variations of urban habitat quality since these data do not provide information on synergistic, antagonistic or additive effects of chemicals in complex pollutant mixtures and integrated responses in biological tissues which vary with prevailing microclimatic conditions. Biological monitoring procedures are thus required to evaluate urban habitat quality. Advantages of biomonitoring have been discussed frequently (Martin and Coughtrey, 1982; Wittig, 1993). 2
  • 5. Lichens are the most studied species as biomonitors of urban air quality. In numerous studies their bioaccumulation potential of trace elements and alteration of physiology and population changes due to poor air quality have been proven (Bennett and Wetmore, 1999; Ra et al., 2005). Tree species such as oak (Quercus ilex) (Alfani et al., 2000), and pine needles (Jensen et al., 1992) also showed significant potential for accumulating trace elements and persistent organic compounds. Taraxacum officinalis is a common herbaceous weed that has been frequently studied as a biomonitor of environmental pollution (Kuleff and Djingova, 1984; Djingova and Kuleff, 1999) and has been used in a number of regional scale studies in Poland (Kabata–Pendias and Dudka, 1991), Hungary (Kovac et al., 1993), USA (Keane et al., 2001), Germany (Winter et al., 1999), and Canada (Marr et al., 1999). Most of these studies focused, however, on the use of T. officinalis for biomonitoring of trace metals. Plant physiological parameters have also been used frequently as bio–indicators of urban habitat quality. For example, chlorophyll fluorescence (Sgardelis et al., 1994), chlorophyll content (Ali, 1991), photosynthetic gas exchange rate, stomatal conductance and transpiration rate (Moraes et al., 2003) showed significant responses to air quality. Also analysis of visible leaf damage together with leaf chemical contents in various standard species (N. tabacum Bel W3, Petunia hybrida cv. Mirage, Gladiolus hybrida cv. White friendship, L. multiflorum italicum cv. Lema) have been used to characterize local air pollution (Klumpp et al., 1994; Moraes et al., 2002). Less attention has been given to morphological and anatomical parameters of plants as indicators of long term responses to changing (urban) habitat quality, although parameters as specific leaf area, stomatal density and pore surface were recognized to vary depending on microclimatic conditions (Barber et al., 2004). Moreover, sampling and analysis of these parameters is relatively easy and inexpensive. Beside the limited attention given to morphological and anatomical plant parameters, the use of stable isotope techniques in plant ecological research has grown steadily during the past two decades (Dawson et al., 2002). Stable isotopes can serve as integrators of how plants interact with, 3
  • 6. and responded to, the quality of their habitat. Genetic and environmental factors that influence gas exchange through morphological and functional plant responses cause changes in plant δ13C content (Ehleringer, 1993). For example δ13C in plants were found to reflect the habitat quality in relation to the land use in Karlsruhe (Germany) and Gent (Belgium) (Norra et al., 2005; Boeckx et al., 2006). δ13C in ambient air is about -8 ‰. Fossil fuel burning can locally reduce this value to about -12 ‰ (Kiyoshu and Kidoguchi, 1998). Therefore, δ13C content of plants grown in areas with poor air quality due to fossil fuel burning is expected to be lower compared to areas with a better air quality. In addition, variation in foliar δ13C content has been related to leaf size (Geber and Dawson, 1990) and thickness and stomatal density (Hultline and Marshall, 2000). The main objective of this study was to asses the potential of anatomical leaf characteristics (specific leaf area, stomatal density and dimension) and leaf (bio)chemical characteristics (chlorophyll a and b, C and N content, δ13C and δ15N) as effective parameters for biomonitoring of urban habitat quality. 4
  • 7. Material and Methods Study area description The study area covered 81.5 km2 within the urban and suburban surrounding of the city of Gent, Belgium (51° 00´ N, 3° 50´ E). Gent urban area includes several industrial zones, densely populated areas, a harbour and network of busy highways and train tracks, urban green, agriculture and nature areas (Boeckx et al., 2006). The predominant wind flow across the area is from southwest to northeast. Besides the densely populated central area several moderately densely populated areas are situated at northwest (Wondelgem-Mariakerke) northeast (Oostakker-Sint-Amandsberg and Destelbergen) and southeast (Heusden, Melle-Merelbeke and Ledeberg-Gentbrugge) of the study area (Figure 1). In the north of the study area, the harbour of Gent and associated industrial areas are situated. Main industrial, commercial and service areas are situated around the city centre and in the southern part of the city near the crossing of E17 and E40 European highways. The agricultural area consists of pasture and arable land and is mainly situated in the eastern and upper northwest part of the study area. The Bourgoyen-Ossemeersen nature reserve which mainly consists of wet meadows covers a large area at the eastern part (220 ha). Forested areas are rather limited and scattered. Urban green areas are even more scattered. The different land uses of the study area were classified into 4 land use classes: urban (U) including the city centre and suburban areas and roads, urban green (UG) including urban green and forested areas, harbour and industry (HI) including the harbour, industrial areas and railways, and pasture (P) land use class covering all pasture and grass lands (Figure 1). Plant sampling Figure 2 shows the position of the 148 sampling locations inside the study area. These georeferenced sampling locations were obtained from a previous study (Boeckx et al., 2006), and were selected within the different land use classes as mentioned above, using a partially random and 5
  • 8. partially grid sampling design. Dandelion (T. officinalis Weber complex), a commonly distributed wild herb species, was selected for the study. At each sampling location, four fully grown plants at flowering stage which were 1–3 m apart were selected for sampling from mid August till mid October, 2005. Specific leaf area and stomatal characteristics From each of the four selected plants at each sampling location, four fully grown undamaged leaves were collected. Specific leaf area (SLA) (cm2 g-1) of each plant was calculated by dividing total single sided fresh leaf area (measured with Li–3000 leaf area meter, Li–COR, Lincoln, Nebraska) by its oven dry weight (60°C for 24 hours). Stomatal imprints at both the adaxial and abaxial side of a fully grown mature leaf of each sampled plant were collected to determine stomatal density (SD) (the number of stomata per mm2 leaf area) and stomatal pore surface (SPS) (the surface area of a widely opened stomatal pore, µm2). Stomatal imprints were made on attached leaves by applying colourless nail varnish and peeling off the surface with a transparent adhesive tape which was then fixed on a microscope slide. Nail varnish was applied to an area of approximately one cm2 in the middle portion of the selected leaves (Elagoz et al., 2006), to the right of the mid vein, avoiding areas overlying veins. Stomatal imprints were analyzed with a light microscope (Wild Leitz GMBH 020–505.030) connected with a TV screen at a magnification of 40 X 10. First, the statistical minimal number of microscopic fields (Nmin) that should be counted on a single imprint was calculated for each land use class using the student–t–test (Equation 1). Therefore, in four randomly selected sub-sampling points of each considered land use class the number of stomata in 25 microscopic fields was counted to determine Nmin.  2.064 2  2 N min   2 *S (1)  X / 100  6
  • 9. where 2.064 is the t–value for (25-1) degrees of freedom, with a threshold value of p = 0.05, X and S are the mean and the standard deviation of the counted stomata in the microscopic fields, respectively. Subsequently, the number of stomata for each stomatal imprint was counted on Nmin microscopic fields for the respective land use class. SD was calculated by dividing the amount of stomata by the surface area of a microscopic field after calibration with a calibration plate. The SPS (µm2) was calculated by measuring length (L) (m) and width (W) (m) of widely opened stomata, and by assuming an elliptical shape: L *W *  SPS  (2) 4 The theoretical minimal stomatal resistance (Rs) was calculated as: 4l L W RS   (3) nLWD 4nLWD where Rs is the stomatal resistance (s m-1), l is the stomatal pore depth (m), D is the diffusion coefficient of water vapour in air (24.2*10-6 m2 s-1 at 20°C) and n is the stomatal density (number of stomata m-2). Stomatal depth was assumed as 10 μm (Samson et al., 2000; Olyslaegers et al., 2002). Sample preparation and chemical analysis A composite sample for chemical analysis was made of the dried leaves from the four sub-samples collected at each location. The pooled samples could be considered as point samples relative to the size of the investigated area. Sub-samples were ground using an ultra-centrifugal mill (ZM200, Retsch Germany). Samples were weighed separately in tin cups and analyzed in triplicate for C (%), N (%), δ13C (‰) and δ15N (‰) using an elemental analyzer (EA) (ANCA-SL, Europa PDZ, UK) coupled to an Isotope Ratio Mass Spectrometer (IRMS) (20-20, SerCon, UK) (Boeckx et al., 2006). Isotope ratios and percent element were measured during one sample run, i.e. the IRMS was tuned 7
  • 10. in “dual mode” to enable simultaneous analysis of C and N. Sub-samples were also used for the spectrophotometric (Uvikon 930, Kontron Instruments, Milan, Italy) determination of chlorophyll a and b (g/mg), according to the methodology described by Lichtenthaler (1987). Data analysis and geostatistical data processing First, the temporal effect of the sampling duration was examined by means of linear regression between the measured variables and the date of sampling, but no effect was observed. Differences of the plant parameters between the land use classes were analyzed using analysis of variance (ANOVA) with Duncan test (p = 0.05) using SPSS 12.0 software. Geostatistical analysis was carried out for several selected parameters (SLA, abaxial SPS, abaxial Rs, and δ13C). Spatial distribution of the parameters which did not show differences across land use classes was elucidated by means of ordinary kriging. Simple Kriging with Varying Local Means (SKLM) method was applied to the parameters which show significant differences between land use classes. Both methods are based on the general kriging estimator with different assumptions. Consider a random variable Z that has been measured at n locations, z(xα), α = 1,…,n, the kriging estimator at an unsampled location x0 can be written as: n ( x0 ) Z * ( x 0 )  m( x 0 )  λ α 1 α  [ Z ( x α )  m( x α )] (4) where n(x0) is the number of neighbourhood measurements z(xα) used for estimating Z * (x 0 ) , λ α are the weights assigned to data z(xα) which are considered to be a realization of the random variable Z and m(x 0 ) and m(x α ) are the expected values (or means) of Z * (x 0 ) and Z (x α ) . In ordinary kriging, it is assumed that of Z * (x 0 ) and Z (x α ) are unknown, but locally stationary. The SKLM procedure uses the secondary information, in this case land use class, to estimate Z * (x 0 ) and Z (x α ) . Extensive discussion on these kriging methods can be found in Goovaerts (1997). 8
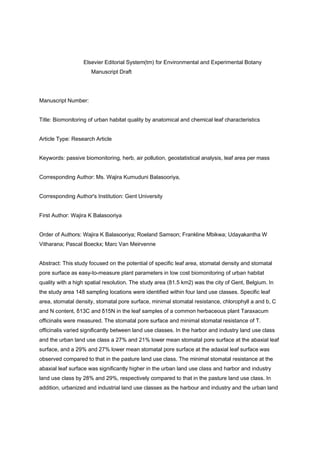
  • 11. Results Variation between land use classes The SLA varied between 130.1 and 472.1 cm2 g-1 over the study area (Table 1). Although SLA was not significantly different between land use classes, mean SLA in UG, HI, and U was 297.8, 283.1, 273.8 cm2 g-1, respectively, which was an increase by 22%, 16% and 12% compared to the mean SLA (244.8 cm2 g-1) in P. Abaxial SPS varied between 11.0 and 44.5 μm2 over the study area, while adaxial SPS ranged from 15.5 to 64.6 μm2 (Table 1). As illustrated in Figure 3a, mean abaxial SPS in HI and U were significantly lower compared to that of UG and P. This decrease in HI and U was 27% and 21%, respectively, compared to P. Similar differences between land use classes were observed for adaxial SPS (Figure 3b). Stomatal density at the abaxial side varied from 136.8 to 314.1 stomata mm-2 over the study area. At the adaxial side, SD was lower than the abaxial values and ranged from 56.8 to 173.0 stomata mm-2 of leaf area (Table 1). SD showed an opposite pattern of variation between land use classes compared to that observed for SPS. The adaxial variation in SD was more pronounced compared to the abaxial variation, with a mean adaxial SD in HI of 121.2 mm-2 which was 13% higher than SD in P (107.4 mm-2). Rs at the abaxial side varied from 41.8 to 250.3 s m-1. At the adaxial side Rs was higher and ranged from 66.5 to 303.9 s m-1 (Table 1). Both abaxial and adaxial Rs was higher in HI and U than in P and UG. For both sides, mean Rs in U was significantly (p< 0.05) different from P and UG, while for HI this was only the case for the abaxial side. Chlorophyll a content varied between 30.8 and 158.4 mg g-1 within the study area, whereas, chlorophyll b content varied from 15.2 to 127.3 mg g-1 (Table 2). Carbon content ranged from 35.0 to 56.2%, while N content of these leaves ranged from 0.9 to 6.3 %. δ15 N and δ13C values ranged from –4.7‰ to 6.9‰ and from –34.3 to –26.3 ‰, respectively. Among the analyzed leaf (bio)chemical parameters chlorophyll b, C and N content were not significantly different between the land use classes. However, chlorophyll a content in UG was significantly higher compared to P and HI land use classes, for which the lowest values were observed. Stable isotope abundances were 9
  • 12. not significantly different between land use classes for δ15N, while significantly higher δ13C values were observed in P compared to the other land use classes. The urbanized and industrial land use classes (U and HI) showed the lowest δ13C values. Spatial distribution SLA was ordinary krigged to understand its spatial variation. However, significant differences observed for abaxial SPS, abaxial Rs and δ13C across different land use classes allowed to consider land use as secondary information to predict these variables using SKLM. Firstly, the experimental omnidirectional variograms of SLA and of the residuals of abaxial SPS, abaxial Rs and δ13C were calculated and modelled using Variowin software (Figure 4). Table 3 summarises the variogram parameters; range, sill, nugget and relative nugget effect of the modelled variograms. The maximum value of semivariance () is known as the sill. The lag distance (h) where variogram reaches to sill is known as range, which is the critical part of variogram because the observations located within the range are spatially correlated. The semivariance when h = 0 is known as nugget, which is an estimate of the residual error or spatially uncorrelated noise. Relative nugget effect is the ratio between nugget and sill (Burrough and McDonnell, 1998), which quantifies the strength of spatial structure. All variograms of the considered parameters show a bounded structure with ranges of 881 to 4000 m. The small relative nugget effects (0 – 28%) depicted by all parameters indicated a strong spatial correlation inside their ranges (Goovaerts, 1997). It is clear that in the central part of the study area, SPS decreased from the industrial zone and Melle -Merelbeke residential area (southern part), over the city centre (middle) to the harbour in the northern part (Figure 5). In addition, lower values were observed in the residential areas in Oostakker–Sint–Amandsberg and Destelbergen suburban areas in north east and Heusden suburban area in the eastern part. High SPS was observed in western part of the study area in Bourgoyen– Ossemeersen nature reserve, in Blaarmeersen recreational area and the surrounding areas with high 10
  • 13. biological value, and also in Wondelgem–Mariakerke suburban area which consist of residential areas with gardens. Intermediate values were found in pasture areas in the east and south–eastern part of the study area. Two exceptional distributions could be seen with high SPS values in the southwest of the study area around Gent Sint-Pieters railway station and intermediate values in the southern industrial area. In contrast to the SLA map (not shown) all pasture areas, urban green and forested areas are prominently appearing in the SPS map (Figure 5). Highest δ13C was observed around Dampoort and Sint-Pieters railway stations, which are also busy traffic points, and at Ledeberg where the E17 highway enters the city (Figure 6). In addition, higher values were observed around the harbour, in the city centre, in the suburban residential areas in Oostakker–Sint–Amandsberg and Destelbergen in the northeast, Heusden suburban area in the eastern part and Melle–Merelbeke residential area at the southern part. Low values were observed in grasslands including the Bourgoyen–Ossemeersen nature reserve, Blaarmeersen recreational area, and pasture areas in the eastern part. The spatial distribution of Rs (map not shown) yielded mostly comparable information to that of SPS (Figure 5), whereas the spatial distribution of SLA (map not shown) did not allow distinguishing clear spatial patterns which could be easily linked to land use (see also Table 3). Discussion Spatial distribution of SLA Leaf area and specific leaf area have been studied at several locations as a biomonitoring parameter of urban habitat quality, especially urban air quality (Carreras et al., 1996; Lima et al., 2000; Moraes et al., 2002 and Verma and Singh, 2006). SLA of T. officinialis measured by Poorter and de Jong (1999), 368-378 cm² g-1, was higher than our mean value observed, but fell within the observed range in this study (Table 1). We observed 11
  • 14. significantly higher SLA values in UG and HI which are located in more urbanized and intensive road traffic areas compared to P located in less urbanized areas (Figure 1). The spatial distribution map of SLA (map not shown) tends to indicates high values in dense traffic and industrialised areas and low SLA values in the less urbanised areas including the nature reserve Bourgoyen– Ossemeersen. In agreement with our results, Carreras et al. (1996) found a significant increase of SLA by 38% in Ligustrum lucidum in areas with high road traffic compared to less intensive road traffic areas in the city of Córdoba, Argentina. Several studies found a leaf area reduction in polluted sites in comparison to less polluted sites. For example, a 40 and 17% leaf area reduction was observed in polluted sites in comparison to less polluted sites in India for two tree species namely, Ficus religiosa and Thevetia nerifolia, respectively (Verma and Singh, 2006). Lima et al. (2000) and Moraes et al. (2002) also observed a reduction in leaf area of Phaseolus vulgaris and Tibouchina pulchara in polluted city areas of Brazil compared to forested areas. In agreement we observed a leaf area reduction in more urbanized land use classes, i.e. 37 and 39% reduction in U and UG compared to P, respectively. As SLA increased in more industrialised land use classes compared to P (data and map not shown), and simultaneously leaf area decreased (data not shown), leaf thickness should have been seriously reduced in the more urbanized areas suggesting plants invested less energy in their leaves as their longevity decreased due to poor habitat quality. Smaller leaves reduce the contact area between plant and atmosphere, which leads to a reduced absorption of obnoxious gases and a decreased deposition on the leaf’s surface. Decreased urban habitat quality to an inferior air quality can thus largely explain the observed differences in our study area. However, the largest mean SLA is observed in UG compared to HI, U and P. This could be an adaptation to possible lower irradiance levels in shaded habitats (Ashton et al., 1999) in UG where trees and shrubs are abundant. In contrast, T. officinalis is more a species of open terrains. Frequent mowing in home gardens in Wondelgem–Mariakerke in the northwest corner of the study area, may be another reason for thick leaves, and thus low SLA values. Unexpected low SLA values observed in a larger part of the 12
  • 15. harbour area can not be related to road traffic or shaded conditions in this habitat. However, soil or water availability can be stress factors in this area. Spatial distribution of stomatal characteristics In accordance with our results, T. nerifolia showed a 47% increase in SD and 30% decrease in stomatal size at polluted sites compared to a less polluted site in India (Verma and Singh, 2006). However, in the same study the opposite result was obtained for F. religiosa, with a 59% reduction in SD and a 40% increase in stomatal size at the high polluted site. Garg and Varshney (1980) also reported a reduction of stomatal size by air pollution. Alessio et al. (2002) observed an increase in stomatal resistance in response to air pollution by road traffic. Stomatal responses are regarded as avoidance mechanisms plants employ in controlling the amount of air pollutants (e.g. O3) entering the leaves (Andersen, 2003). As suggested by Poole et al. (2000), both SD and aperture (here indicated by SPS) affect stomatal resistance, as they are both inversely proportional to Rs (see equation 3). We observed a spatial distribution of abaxial SPS with low values in a north south central band in the study area, where more urbanization and road traffic is concentrated (Figure 5), which could indicate an increased stomatal resistance in these areas. However, the higher SD observed in these areas suggests a reduced stomatal resistance. The net effect is that the calculated abaxial stomatal resistance increased along a more or less similar north south central band in the study area (map not shown) indicating decreased stomatal size overshadows increased stomatal density. So, our measurements clearly indicate plants react to a decreased habitat quality, mainly due to air pollution, by decreasing the size of the stomata and increasing their density. This way plants can more ‘fine-tune’ their gas exchange with the environment, thereby avoiding as much as possible the uptake of air pollutants, and optimising CO2-uptake for photosynthesis in relation to water losses by transpiration. 13
  • 16. Spatial distribution of δ13C We observed significantly higher δ13C values (less negative) in P compared to the other land use classes. More urbanized and industrial land use classes (HI and U) showed lowest δ13C values (more negative). The spatial distribution of δ13C indicates highest δ13C values around Dampoort and Sint-Pieters railway stations and at Ledeberg where the E17 highway enters the city (Figure 6). At all these points the intensive traffic is slowing down. In addition, higher values were observed around the northern harbour, in the city centre and several suburban residential areas compared to low values in eastern grasslands and Bourgoyen–Ossemeersen. This depletion in foliar δ13C values can be due to the decreased average δ13C of ambient air in areas with high road traffic and domestic heating. Theoretically, plants growing in fossil–fuel–CO2-contaminated areas, such as major cities, industrial centres, and highway borders, should assimilate a mixture of atmospheric CO2 with a δ13C value of –8.0‰ and of fossil fuel derived CO2 with a δ13C value of –27.3‰. This isotopic difference should, thus, be recorded in plant carbon. Lichtfouse et al., (2003) revealed that grasses growing near a major highway in Paris (France) have strikingly depleted δ13C values, averaging at – 35.1‰, versus rural grasses that show an average δ13C value of –30.6‰. We observed a lower average depletion (about 2‰) in δ13C in T. offinalis in the urban area of Gent (about 230,000 inhabitants) which can be related to a lower degree of urbanization and traffic than in Paris and a lower sensitivity of the selected plant species. As our study was conducted in the same study area as used by Boeckx et al. (2006) and was mainly based on the same sampling points, we can assume a mean soil δ13C of -27.2‰ as reported by Boeckx et al. (2006). Compared to this mean δ13C value, δ13C of T. officinalis was 3.0‰ depleted. Boeckx et al. (2006) and Norra et al. (2005) found a relative depletion for grass, in more urbanized areas compared to pasture land in Gent, and not specified herbs in Karlsruhe (Germany) of 2.7 and 3.9‰, respectively. Boeckx et al. (2006) attributed this to increased fossil fuel burning and the proximity to road traffic. However, at the three areas, where maximum δ13C values were observed in this study (Dampoort and Sint-Pieters railway stations and at the entrance of E17 highway in Lederberg where traffic slows down), 14
  • 17. average δ13C in T. officinalis was –33.8‰, showing a 5‰ depletion, which is in agreement with the study by Lichtfouse et al., (2003). Air samples were collected at these 3 places to check the expected depletion of δ13C in ambient air. Results revealed an average δ13C of –11.0‰ (–12.8‰ to 9.2‰) in ambient air. In agreement with these results, fossil fuel burning decreased the average δ13C of ambient air from its atmospheric average (–8‰) to values ranging from –13.5‰ to –11.0‰ in Toyama city (Japan) (Kiyoshu and Kidoguchi, 1998) and from –19.8‰ to –8.8‰ in Paris (France) (Widory and Javoy, 1998). However, air samples taken at Bourgoyen nature reserve also showed a δ13C value of –10.5‰ (11.8‰ to 9.15‰). This can be due to recycling of respired CO2 by the predominantly C3 grass species in the area. Two opposing factors may influence ecosystem δ13C in urban areas: first, physiological stress caused by atmospheric and soil pollutants may reduce the ratio of intercellular to ambient CO2 and increase the expected values of δ13C, while second, δ13C dilution of the urban atmosphere by fossil fuel combustion may decrease δ13C, when plants incorporate the depleted air into their biomass (Flanagan et al., 2005). In contrast to our results, Norra et al., (2005) observed less negative plant δ13C downwind from the industrial area in the city of Karlsruhe (Germany) and suggested that the injurious effects of airborne pollution on stomatal aperture results in a reduced discrimination. Also the enriched δ13C values in grass samples observed by Boeckx et al. (2006) in Gent city centre were explained as reduced discrimination due to plant stress such as nutrient depletion, drought or air pollution. Potential as bio-indicator Based on the variation between land use classes and the spatial distribution maps, stomatal characteristics, especially SPS and Rs, reveal the highest contrast between land use classes. The latter integrates changes in as well SD as size. Spatial distribution maps of stomatal characteristics allow to distinguish urban habitat quality with a very high spatial resolution, provided the sampling network is dense enough. As can be seen from Figure 5 these parameters even allow to distinguish very clearly e.g. the urban green areas. This result is due to the fact that stomata are the key factors 15
  • 18. in the vegetation–atmosphere interaction. Although, deposition of airborne particles will mainly occur at the adaxial side of the mainly horizontally oriented leaves of T. officinalis, a similar pattern of variation between land use classes of stomatal parameters at both sides showed that stomata at both surfaces react similarly to the environment. However, significantly higher SD and significantly lower SPS at the abaxial compared to the adaxial side suggests that abaxial sampling will be more effective. Also δ13C shows potential as bio-indicator. It reveals complementary information to stomatal characteristics, as can be seen from the isotopic signatures measured at both railway stations and some areas around Blaarmeersen recreational area, indicating relatively undisturbed wet meadows (Figure 6). Results for SLA and chlorophyll a were less straightforward, as they can be influenced by a multitude of factors like water availability, nutrients, air temperature and light amongst others. Chlorophyll b, C, N and δ15N content of the T. officinalis leaves showed less potential as a bio-indicator since they were not significantly different between the land use classes in the study area. Conclusions The spatial distribution of δ13C of T. officinalis in Gent follows the urban land use and associated human activities. More depleted plant δ13C in more urbanized areas indicates contamination of the air with combustion products of fossil fuel. Spatial variation of anatomical parameters of T. officinalis as specific leaf area, stomatal pore surface and stomatal density indicate differences in urban habitat quality for plant growth. These plant parameters, especially those related to stomatal characteristics, have a large potential as easy to measure and cost-effective bio-indicators to monitor urban habitat quality. Specific leaf area is the easiest parameter to determine, but the stomatal parameters show the highest potential to discriminate between different land use classes. Just as reported by other authors we conclude that T. officinalis is a suitable bio-indicator of urban habitat quality as it is a commonly distributed species, which is easy to sample and shows a clear morphological and anatomical response to differences in habitat quality. Due to the fact that causes 16
  • 19. of variation in discrimination of δ13C are complex, correlations between δ13C and a single factor such as stomatal pore surface or stomatal density is problematic, and has not been observed in this study in contrast to what was observed by Hultline and Marshall (2000). Therefore, further studies are needed to establish such correlations, and to find out if other species, or other parameters, are more sensitive to differences in urban habitat quality and air pollution, and are thus better suited for passive biomonitoring. Acknowledgements We thank Jan Vermeulen and Eric Gilis for δ13C analysis. We thank the inhabitants and administrative services of the city of Gent for permission to take samples. We are grateful to the Special research fund (BOF) of University Gent for granting a scholarship to the first author to carry out the research. References Alessio, M., Anselmi, S., Conforto, L., Improta, S., Manes, F., Manfra, L., 2002. Radiocarbon as a biomarker of urban pollution in leaves of evergreen species sampled in Rome and in rural areas (Lazio–Central Italy). Atmospheric Environment 36, 5405–5416. Alfani, A., Baldantoni, D., Maisto, G., Bartoli, G., De Santo, A. V., 2000. Temporal and spatial variation in C, N, S and trace element contents in the leaves of Quercus ilex within the urban area of Naples. Environmental Pollution, 109, 119–129. Ali, E.A., 1991. Damage to plants due to industrial pollution and their use as bioindicators in Egypt. Environmental Pollution 81, 251–255. Andersen, C.P., 2003. Source–sink balance and carbon allocation below ground in plants exposed to ozone. New Phytologist 157, 213–228. Ashton, P.M.S., Yoon, H.S., Thadani, R., Berlyn, G.P., 1999. Seedling leaf structure of New England maples in relation to light environment. Forest Science 45, 512–519. Barber, J.L., Thomas, G.O., Kerstiens, G., Jones, K.C., 2004. Current issues and uncertainties in the measurement and modelling of air-vegetation exchange and within-plant processing of POPs. Environmental Pollution 128, 99–138. 17
  • 20. Bennett, J.P., Wetmore, C.M., 1999. Changes in element contents of selected lichens over 11 years in northern Minnesota, USA. Environmental and Experimental Botany 41, 75–82. Boeckx, P., Van Meirvenne, M., Raulo, F., Van Cleemput, O., 2006. Spatial patterns of delta C–13 and delta N–15 in the urban topsoil of Gent, Belgium. Organic Geochemistry 37, 1383–1393. Burrough, P.A., McDonnell, R.A., 1998. Principles of geographical information systems. Oxford University Press, Oxford. Carreras, H.A., Cañas, M.S., Pignata, M.L., 1996. Differences in responses to urban air pollutants by Ligustrum lucidum Ait. and Ligustrum lucidum Ait. f. tricolor (Rehd.). Environmental Pollution 93, 211–218. Dawson, T.E., Mambelli, S., Plamboeck, A.H., Templer, P.H., Tu, K.P., 2002. Stable isotopes in plant ecology. Annu. Rev. Ecol. Syst. 33, 507–559. Djingova, R., Kuleff, I., 1999. Seasonal variations in the metal concentration of Taraxacum officinale, Plantago major and Plantago lanceolata. Chemistry and Ecology 16, 239–253. Ehleringer, J.R., 1993. Variation in leaf carbon isotope discrimination in Encelia farinose: implications for growth, competition and drought survival. Oecologia 95, 340–346 Elagoz, V., Han, S.S., Manning, W. J., 2006. Acquired changes in stomatal characteristics in response to ozone during plant growth and leaf development of bush beans (Phaseolus vulgaris L.) indicate phenotypic plasticity. Environmental Pollution 140, 395–405. Flanagan, L.B., Ehleringer, J.R., Pataki, D.E., 2005. Stable isotopes and Biosphere-atmosphere interactions: Processes and biological controls. Elsevier, San Diego. Garg, K.K., Varshney, C. K., 1980. Effect of air pollution on the leaf epidermis at the submicroscopic level. Cellular and Molecular Life Sciences 36, 1364–1366. Geber, M.A., Dawson, T.E., 1990. Genetic variation in and covariation between leaf gas exchange, morphology, and development in Polygonum arenastrum, an annual plant. Oecologia 85, 53– 58. Goovaerts, P., 1997. Geostatistics for natural resource evaluation. Oxford University Press, New York. Hultline, K.R., Marshall, J.D., 2000. Altitude trends in conifer leaf morphology and stable carbon isotope composition. Oecologia 123, 32–40. Jensen, S., Eriksson, G., Kylin, H., Strachan, W.M.J., 1992. Atmospheric pollution by persistent organic compounds: Monitoring with pine needles. Chemosphere 24, 229–245. Kabata-Pendias, A., Dudka, S., 1991. Trace metal contents of Taraxacum officinale (dandelion) as a conventional environmental indicator. Environmental and Geochemical Health 13, 108–113. 18
  • 21. Keane, B., Collier, M.H., Shann, J.R., Rogstad, S. H., 2001. Metal content of dandelion (Taraxacum officinale) leaves in relation to soil contamination and airborne particulate matter. Science of the Total Environment 281, 63–78. Kiyoshu, Y., Kidoguchi, M., 1998. Carbon isotope ratio in street leaves: an indicator for the environmental assessment of the atmosphere. Mineralogical Magazine, 62A, 785–786. Klumpp, A., Klumpp, G., Domingos, M., 1994. Plants as bioindicators of air pollution at the Serra do Mar near the industrial complex of Cubatão, Brazil. Environmental Pollution 85, 109–116. Kovac, P., Turcsanyi, G., Penksza, K., Kaszab, L., Szöke, P., 1993. Heavy metal accumulation by ruderal and cultivated plants in a heavily polluted district of Budapest. In: Markert, B. (Ed.), Plants as Biomonitors, 495–505. Kuleff, I., Djingova, R., 1984. The dandelion (Taraxacum officinale)-A monitor for environmental pollution? Water, Air and Soil Pollution 21, 77–85. Lichtenthaler, H.K., 1987. Chlorophylls and carotenoids: pigments of photosynthetic biomembranes. Methods in Enzymology 148, 350–382. Lichtfouse, E., Lichtfouse, M., Jaffrezic, A., 2003. Delta C-13 values of grasses as a novel indicator of pollution by fossil-fuel-derived greenhouse gas CO2 in urban areas. Environmental Science & Technology 37, 87–89. Lima, J.S., Fernandes, E.B., Fawcett, W.N., 2000. Mangifera indica and Phaseolus vulgaris in the bioindication of air pollution in Bahia, Brazil. Ecotoxicology and Environmental Safety 46, 275–278. Marr, K., Fyles, H., Hendershot, W., 1999. Trace metals in Montreal urban soils and the leaves of Taraxacum officinale. Canadian Journal Soil Science, 79, 385–387. Martin, M.H., Coughtrey, P.J., 1982. Biological monitoring of heavy metal pollution: land and air. Applied Science Publishers, New York. Moraes, R.M., Delitti W.B.C., Moraes, J.A.P.V., 2003. Gas exchange, growth, and chemical parameters in a native Atlantic forest tree species in polluted areas of Cubatao, Brazil. Ecotoxicology and Environmental Safety 54, 339–345. Moraes, R.M., Klumpp, A., Furlan, C.M., Klumpp, G., Domingos, M., Rinaldi, M.C.S., Modesto, I.F., 2002. Tropical fruit trees as bioindicators of industrial air pollution in southeast Brazil. Environment International 28, 367–374. Norra, S., Handley, L.L., Berner, Z., Stüben, D., 2005. 13C and 15N abundances of urban soils and herbaceous vegetation in Karlsruhe, Germany, Eur. J. Soil Sc. 56, 607–620. Olyslaegers, G., Nijs, I., Roebben, J., Kockelbergh, F., Vanassche, F., Laker, M., Verbelen, J.P., Samson, R., Lemeur, R., Impens, I., 2002. Morphological and physiological indicators of 19
  • 22. tolerance to atmospheric stress in two sensitive and two tolerant tea clones in South Africa. Experimental Agriculture 38, 397–410. Osborn, J.M., Taylor, T.N., 1990. Morphological and ultrastructural studies of plant cuticular membranes: Sun and shade leaves of Quercus velutina(Fagacea). Botanical Gazette151, 465- 476. Poole, I., Lawson, T., Weyers, J.D.B., Raven, J.A., 2000. Effect of elevated CO2 on the stomatal distribution and leaf physiology of Alnus glutinosa. New Phytologist 145, 511–521. Poorter, H., De Jong, R., 1999. A comparison of specific leaf area, chemical composition and leaf construction costs of field plants from 15 habitats differing in productivity. New Phytologist 143, 163–167. Ra, H.S.Y., Geiser, L.H., Crang, R.F.E., 2005. Effects of season and low-level air pollution on physiology and element content of lichens from the U.S. Pacific Northwest. Science of the Total Environment 343, 155–167. Samson, R., Vandenberghe, J., Vanassche, F., Nijs, I., Olysalaegers, G., Kockelbergh, F., Lemeur, R., Laker, M., 2000. Detecting sensitivity to extreme climatic conditions in tea: sap flow as a potential indicator of drought sensitivity between clones. In: Ceulemans, R., Bogaert, J., Deckmyn, G., Nijs, I. (Eds.), Topics in Ecology: structure and function in plants and ecosystems 267–268. Sgardelis, S., Cook, C.M., Pantis, J.D., Lanaras, T., 1994. Comparison of chlorophyll fluorescence and some heavy metal concentrations in Sonchus spp. and Taraxacum spp. along an urban pollution gradient. The science of the Total Environment 158, 157–164. Verma, A., Singh, S., 2006. Biochemical and ultra structural changes in plant foliage exposed to auto–pollution, Environmental Monitoring and Assessment 120, 585–602. Widory, D., Javoy, M., 1998. Air pollution in Paris: a view through δ13C. Mineralogical Magazine 62A, 1655. Winter, S., Wappelhorst, O., Leffler, U.S., Korhammer, S., Markert, B., 1999. Biomonitoring in Städten mit Taraxacum officinale Web. (Loewenzahn)–Eine Studie in der Stadt Zittau, Sachsen. In: Oehlmann, J., Markert, B. (Eds.), Ökotoxicologie/ Ökosystemare Ansätze und Methoden 238–247. Wittig, R. 1993. General aspects of biomonitoring heavy metals by plants. In: Markert, B. (Ed.), Plants as biomonitors 3–27. 20
  • 23. Tables Table 1. Descriptive statistics of specific leaf area (SLA), stomatal pore surface (SPS), stomatal density (SD), stomatal resistance (Rs) of T. officinalis in the study area (n = 146). Different letters indicate significantly different mean values between the abaxial and adaxial side (p< 0.05) SLA (cm2g-1) SPS (μm2) SD (no. mm-2) Rs (sm-1) Abaxial Adaxial Abaxial Adaxial Abaxial Adaxial Min 130.1 11.0 15.5 136.8 56.8 41.8 66.5 Max 472.1 44.5 64.6 314.1 173.0 250.3 303.9 Mean 277.3 26.0a 32.8b 214.5a 117.2b 110.0a 158.0b Median 271.8 25.2 33.0 215.1 117.0 97.6 144.4 StD 67.0 9.1 11.3 33.7 23.2 43.3 52.2 g1 0.48 0.069* 0.36* 0.032* 0.10* 1.13 0.84 g2 0.37* -1.14 -0.66* -0.30* -0.33* 0.80 0.21* Min = minimum value, Max = Maximum value, StD = standard deviation, g1 = skewness, g2 = kurtosis *significant normal distribution by t test at α = 0.05. 21
  • 24. Table 2. Descriptive statistics of chlorophyll a and chlorophyll b, C and N, δ13C and δ15N of T. officinalis in the study area (n = 146). chlorophyll a chlorophyll b C N δ13C δ15N (mg g-1) (mg g-1) (%) (%) (‰) (‰) Min 30.8 15.2 35.0 0.9 -34.3 -4.7 Max 158.4 127.3 56.2 6.3 -26.3 6.9 Mean 108.3 58.2 47.7 3.4 -30.2 1.8 Median 112.6 56.7 40.7 3.2 -30.3 1.9 StD 30.8 24.7 4.4 1.1 1.4 5.9 g1 -0.58 0.41* 0.86 0.26* 0.3* -0.3* g2 -0.57 0.26* 0.22* -0.21* 0.5* -0.2* Min = minimum value, Max = Maximum value, StD = standard deviation, g1 = skewness, g2 = kurtosis *significant normal distribution by t test at α = 0.05. 22
  • 25. Table 3. Omnidirectional variogram model parameters of SLA, SPS, Rs and δ13C, with indication of the used model, the range, sill, nugget and the relative nugget effect. Variable Model Range (m) Sill* Nugget* Rel. nugget effect (%) SLA (cm2g-1) Exponential 2255 4500 1260 28 2 Abaxial SPS (μm ) Exponential 4000 66 14 22 Abaxial Rs (sm-1) Exponential 3572 1629 128 8 δ13C (‰) Spherical 881 1.7 0 0 *The units are equal to the square of the variable units. 23
  • 26. Figure Captions Figure 1. Study area with indication of the 4 land use classes (map scale is in m according to the Belgian National Lambert72 projection). Figure 2. Location of the 148 sampling locations (dots) in the study area. Figure 3. Abaxial (a) and adaxial (b) average stomatal pore surface (SPS) (μm2) of T. officinalis in four land use classes: P = pasture, UG = urban green (urban green plus forest areas), U = urban (city, suburban plus road areas), HI = Harbor and Industry (harbor, railways plus industrial areas); error bars represent ± 1 standard deviation; n = number of observations per class; different letters indicate significantly different mean values at α = 0.05 (Duncan test) Figure 4. Omnidirectional experimental variograms (dots) and fitted models (line) of SLA (a) abaxial SPS (b) abaxial Rs (c) and δ13C (d), h = lag distance in m. Note the different scales of the Y axis due to   h  =semivariance in square units of the measurement units. Figure 5. Spatial distribution of abaxial stomatal pore surface (SPS) in the study area obtained by SKLM Figure 6. The spatial distribution of δ13C (‰) in the study area obtained by SKLM 24
  • 29. Figure(s) (a) 34 Abaxial 32 Average SPS (µm²) 30 28 26 24 22 20 n= 28 55 26 19 Diff: a a b b HI U UG P Land Use Class (b) 45 Adaxial 40 Average SPS (µm²) 35 30 n= 28 54 25 19 25 Diff: a a b b HI U UG P Land Use Class