VIP Model Call Girls Chakan ( Pune ) Call ON 8005736733 Starting From 5K to 2...
Hydrography
1. 1
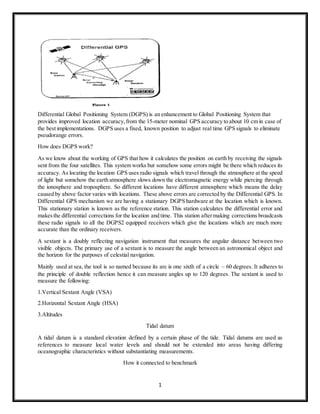
Differential Global Positioning System (DGPS) is an enhancement to Global Positioning System that
provides improved location accuracy,from the 15-meter nominal GPS accuracy to about 10 cm in case of
the best implementations. DGPS uses a fixed, known position to adjust real time GPS signals to eliminate
pseudorange errors.
How does DGPS work?
As we know about the working of GPS that how it calculates the position on earth by receiving the signals
sent from the four satellites. This system works but somehow some errors might be there which reduces its
accuracy. As locating the location GPS uses radio signals which travel through the atmosphere at the speed
of light but somehow the earth atmosphere slows down the electromagnetic energy while piercing through
the ionosphere and troposphere. So different locations have different atmosphere which means the delay
caused by above factor varies with locations. These above errors are corrected by the Differential GPS. In
Differential GPS mechanism we are having a stationary DGPS hardware at the location which is known.
This stationary station is known as the reference station. This station calculates the differential error and
makesthe differential corrections for the location and time. This station aftermaking corrections broadcasts
these radio signals to all the DGPS2 equipped receivers which give the locations which are much more
accurate than the ordinary receivers.
A sextant is a doubly reflecting navigation instrument that measures the angular distance between two
visible objects. The primary use of a sextant is to measure the angle between an astronomical object and
the horizon for the purposes of celestial navigation.
Mainly used at sea, the tool is so named because its arc is one sixth of a circle – 60 degrees. It adheres to
the principle of double reflection hence it can measure angles up to 120 degrees. The sextant is used to
measure the following:
1.Vertical Sextant Angle (VSA)
2.Horizontal Sextant Angle (HSA)
3.Altitudes
Tidal datum
A tidal datum is a standard elevation defined by a certain phase of the tide. Tidal datums are used as
references to measure local water levels and should not be extended into areas having differing
oceanographic characteristics without substantiating measurements.
How it connected to benchmark
2. 2
A bench mark is a fixed physical object or mark used as a reference for a vertical datum. A tidal bench
mark is a mark near a tide station to which the tidal datums are referenced. A network of bench marks is
an integral part of every water level measurement station. Since gauge measurements are related to the
bench marks, it follows that the overall quality of datums is dependent on both the quality of the
bench mark installation and the quality of the leveling betweenthe bench marks and the gauge. Benchmarks
are leveled whenever a new tide station is established or when data collection is discontinued at a tide
station. Bench marks are also leveled before and after maintenance is performed at a station, and
at least annually to perform stability checks. In addition, whenever new bench marks are installed, the
existing bench marks are re-leveled.
Tidal datum is important for hydrographic measurement
tidal datums are the reference planes from which measurements of height and depth are made and from
which marine boundaries are determined. The purpose of a hydrographic survey is to determine the
topography of the ocean floor and to locate and describe all hazards and aids to navigation. Horizontally,
surveys are referenced to the North American Datum of 1983 (NAD 83) or WGS84 via measurements
from GPS. Vertically,they are referenced to a tidal datum.
In hydrographic survey operations, in situ water level observations are required to reduce the soundings to
chart datum, MLLW.
All bathymetry is predicted
Importance ofbathymetry: Bathymetric data, which includes information about the depths and shapes of
underwater terrain, has a range of uses: Accurate bathymetry is the foundation for much of ocean science
and policy. Nautical charts are based on data acquired during bathymetric surveys. These charts guide
mariners much as road maps guide motorists, ensuring safe and efficient maritime transportation.
Bathymetric maps are increasingly important as scientists learn more about the effects of climate change
on the environment. Bathymetric surveys can alert scientists to ongoing and potential beach erosion, sea-
level rise, and subsidence (land sinking). Scientists also use bathymetric data to create hydrodynamic
models. Bathymetry is a key element of biological oceanography. The depth and characteristics of the
seabed define the habitat for benthic (bottom-dwelling) organisms, and are fundamental parameters of
marine ecosystems. Scientists use high-resolution bathymetry to help determine where fish and other sea
life will feed, live, and breed.
Importance of hydrographic chart
Geodetic distance is the shortest distance
Basic principle of cartography and projections
Cartography is the study and practice of making maps. Combining science, aesthetics, and technique,
cartography builds on the premise that reality can be modeled in waysthat communicate spatial information
effectively. The representation of the ellipsoid on a plane (horizontal) surface is the fundamental problem
and objective of Cartography. Finding the best method to remove this
According to the selected method there are:
a. Charts in which distances are preserved (equidistant charts): It means along certain lines that the
relationship (scale) is preserved between the measured distances on the paper and the measured
distances on the reference surface;
3. 3
b. Charts in which the areas are preserved (equivalent or equal area charts): It means that the
relationship is preserved between a measured area on the paper and a measured area on the
reference surface.
c. Charts in which the angles are preserved (conformal charts): It means that the measured angle
between two geodetics transformed on the paper is equal to the angle between two corresponding
directions on the reference surface (ellipsoid or sphere);
d. Charts in which the scale is the same in all directions at any point (orthomorphic charts):angles
round a point are preserved and small shapes are not distorted over the entire paper;
e. e. Charts in which none of the element above is rigorously preserved but where the relative
deformations are contained within suitable tolerances (aphilatic or not orthomorphic charts).
Projection
Map projection is a systematic transformation of the latitudes and logitudes of locations on the
surface of a sphere or an ellipsoid into locations on a plane.
1.Conic projections: a map projection in which an area of the earth is projected onto a cone whose
vertex is usually above one of the poles, then unrolled onto a flat surface.
2. Cylindrical projections: A map projection in which the surface features of a globe are depicted
as if projected onto a cylinder, typically positioned with the globe centered horizontally inside the
cylinder. Distortion of shape and scale in a cylindrical projection of the earth is minimal in
equatorial regions and maximal at the poles.
3. azimuthal projection : a map projection in which a region of the earth is projected onto a plane
tangential to the surface,typically at a pole or the equator
4. Universal Transverse Mercator projection: The Universal Transverse Mercator (UTM)
conformal projection uses a 2-dimensional Cartesian coordinate system to give locations on the
surface of the Earth.
GEBCO:The GeneralBathymetric Chart of the Oceans(GEBCO)is a publicly available bathymetric chart
of the world's oceans. The GEBCO chart series was initiated in 1903 by an international group of
geographers and oceanographers, under the leadership of Prince Albert I of Monaco. GEBCO
operates under the joint auspices of the International Hydrographic Organization (IHO). and the
Intergovernmental Oceanographic Commission (IOC) of UNESCO. Its work is done by an
international group of experts in seafloor mapping who develop a range of bathymetric data sets
and data products. Although originally GEBCO published paper contour charts,today it hasmoved
into the digital age and collects digital depths of the ocean from wherever they are available.
GEBCO provides a range of bathymetric data sets and data products, including: Global gridded
bathymetric data sets:
4. 4
1.GEBCO_08 Grid — a global bathymetric grid with 30 arc-second spacing, generated by combining
quality-controlled ship depth soundings with interpolation between sounding points guided by
satellite-derived gravity data.
2.GEBCO_2014 Grid — an update to the previously released GEBCO_08 Grid.
3.GEBCO One Minute Grid — a global grid at one arc-minute intervals, based largely on the most recent
set of bathymetric contours contained within the GEBCO Digital Atlas. The first hundred years of
the project were described in the book The History of GEBCO 1903-2003 published by GITC in
2003.Nowadays GEBCO’s role has become increasingly important, due to the increased interest in
the oceans for scientific research and for the exploitation and conservation of resources.
tidal gauge
A tide gauge (also known as mareograph or marigraph, as well as sea-level recorder is a device for
measuring the change in sea level relative to a datum. Sensors continuously record the height of the water
level with respect to a height reference surface close to the geoid. Water enters the device by the bottom
pipe (far end of the tube, see picture), and electronic sensors measure its height and send the data to a tiny
computer. This data is critical for many coastalactivities, including safe navigation, sound engineering, and
habitat restoration and preservation.
Types of tide gauge
1. floating gauge
2. acoustic tide gauge : Acoustic systems in tube with Aquatrak transducer (NGWLMS or
SEAFRAME) with various data loggers. These are now something of a GLOSS standard in many
areas.Acoustic systems in open air or inside the stilling wells of float gauges. Cheap but several
groups have not been successful in operating them to good standards
3. pressure gauge
4. radar gauge
Factors with associated Sound velocity is always changing with depth
5. 5
The speed of sound through water has been found to be mainly a function of three factors. They are
temperature,pressure or depth and salinity. Because the speed is not constant, sound does not travel along
straight paths.
1.temperature: the water temperature decreases from the surface to the bottom, but there are many local
variations. Shallow layers see the most variation with time and depth (ie. Surface mixing, solar heating,
currents, seasonal variations, etc). In vary deep water, the temperature eventual becomes constant with
depth at about 4 C. 1 ° C change in Temperature = 4.0 m/sec change in velocity
2.salinity : 1 ppt change in Salinity= 1.4 m/sec change in velocity
3. pressure: 100 m change in Depth (10 atm’s pressure)= 1.7 m/sec change in velocity
Coastal processes influence hydrographic survey
Waves, winds, currents, tides and storms are the major forces on the coast. The results of actions and
interactions of these natural forces on the shoreline and near-shore seabed are called coastal processes.
These include erosion and deposition, movement of dunes, longshore drift, and the effects of storms on the
coastline.
1.erosion
2. sedimentation
3. coastal dredging
4.under water construction
5. channel construction
6. port management
7.deep sea construction
8. coastal zone management
9.water flow
Format and types of digital chart
6. 6
Digital charts are a new navigation aid that can provide significant benefits to maritime navigation, safety,
and commerce. digital chart systems combine both geographic and textual data into a readily useful
operational tool. The most advanced form of digital chart systems represents an entirely new approach to
maritime navigation.
ENC: An Electronic Navigational Chart (ENC) is vector data conforming to IHO S-57 ENC product
specification in terms of contents, structure and format. an ENCcontains all the chartinformation necessary
for safe navigation and may contain supplementary information in addition to that contained in the paper
chart (e.g.,sailing directions). In general, an S-57 ENC is an object-oriented, structurally layered data set
designed for a range of hydrographic applications. As defined in IHO S-57 Edition 3, the data is comprised
of a series of points, lines, features,and objects. The minimum size of a data is a “cell” which is a spherical
rectangle (i.e. bordered by meridians and latitude circles).Adjacent cells do not overlap. The scale of the
data contained in the cell is dependent upon the navigational purpose (e.g. general, coastal, approach,
Harbour)
BSB Format: The (BSB)format is basically one or more rasterimages compressedin to an efficient package
that is accompanied by the chart details within the package. These chart details include the geo referencing
required for determining latitude and longitude as well as other particulars such as,scale, depth units, chart
name, etc. The BSB format separates a chart into images depending on the number of compartments a chart
contains where a 'compartment' is defined as main chart, chart inset, and chart continuation.
BM
TMB: A temporary benchmark (TBM) is a fixed point with a known elevation used for level control during
construction works and surveys. Nails in road seals, or marks on kerb & channel are commonly used as
temporary benchmarks.
,BMB ,WGS84 , NAD83 , zone of confidence
7. 7
Electronic Chart Display and Information System - An ECDIS is a computer-based navigation information
system that complies with International Maritime Organization (IMO) regulations and can be used as an
alternative and replacement to paper nautical charts.
Basic principle of cartography and projections
BSB
Geodesy
An electronic navigational chart or ENC is an official database created by a national hydrographic office
for use with an Electronic Chart Display and Information System (ECDIS). An electronic chart must
conform to standards stated in the International Hydrographic Organization (IHO) Publication S-57 before
it can be certified as an ENC. Only ENCs can be used within ECDIS to meet the International Maritime
Organisation (IMO) performance standard for ECDIS.
Raster vs vector
Raster vector
1 raster graphics is that raster graphics are composed of
pixels
vector graphics are composed of paths.
2 A raster graphic is an array of pixels of various colors,
which together form an image
A vector graphic is composed of paths, or
lines, that are either straight or curved.
3 Raster images are mainly used for high density
images, or images with many different colors, as each
pixel can have a different color, which can be
overlapped for different colors and shapes.
The advantage that vector images have
over raster images is that vector images
canbe resized without any visible negative
impacts.
Raster images are used for photographs and high
colored images in web and print, as they are capable
of displaying various different colors in a single image
and allow for color editing in the image.
vector images is that they cannot be used
in an electronic format; they must first be
converted to a raster image.
Seafloor classification
There are three requirements for seafloor classification, i.e. nautical charting, commercial/ environmental
and military.
1. Nautical Charting. A relatively simple classification method is used for nautical charting and
navigational purposes; it is defined as determining the composition of the seafloor. The mariner
needs this information:
• to decide where to anchor;
• to determine the type of holding ground and how much cable to use;
• to help assess the safety of an anchorage;
• to provide an additional check on navigation.
2.Commercial/Environmental. A more detailed classification, usually obtained using commercial
processing software and used for:
8. 8
• offshore engineering e.g. siting oil platforms, beacons and sea walls,
• mineral exploration;
• fishing etc.
2. Military. A combination of four basic seafloor types with detailed and specific additional data and
attributes. Military users rely upon this information for:
• amphibious operations;
• mine countermeasures,i.e. selecting operating areas in order to avoid those of unfavourable seafloor
topography;
• submarine and anti-submarine operations, e.g.. selection of safe areas for submarines to take the
seafloor;
• sonar acoustic performance.
The following information is to be shown in seafloor classification models:
• natures of the seafloor from samples;
• texture of the seafloor from echo sounder, SSS etc.;
• seafloor contacts and features (i.e. wrecks,sand waves,trawl scours);
• depth contours.
Nature of the Seafloor:
The seafloor is formed of rock of various types overlaid in most places by unconsolidated sediments from
two main sources:
• materials washed from adjacent land masses or from erosion of the seafloor itself;
• biologically produced sediments which are formed from decaying animal and vegetable products within
the ocean basins.
Seafloor sediment classification
General description Name Limits(mm)
Mud Clay <.002
Silt 0.002-0.063
Sand Very fine sand 0.063-0.125
Fine sand 0.125-0.250
Medium sand 0.250-0.50
Coarse sand 0.5-1
Very coarse sand 1-2
Gravel Granules 2-4
Pebbles 4-64
Cobbles 64-256