Mr. Jones and the New Worksheet
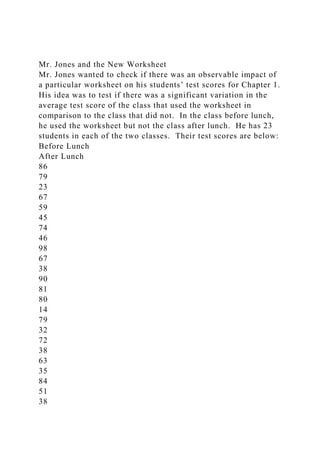
Mr. Jones wanted to check if there was an observable impact of a particular worksheet on his students’ test scores for Chapter 1. His idea was to test if there was a significant variation in the average test score of the class that used the worksheet in comparison to the class that did not. In the class before lunch, he used the worksheet but not the class after lunch. He has 23 students in each of the two classes. Their test scores are below:
Before Lunch
After Lunch
86
79
23
67
59
45
74
46
98
67
38
90
81
80
14
79
32
72
38
63
35
84
51
38
31
60
18
56
57
20
44
70
68
43
27
33
24
16
16
14
31
58
24
30
82
95
a. Which test are you using?
b. What are your H0 (null hypothesis) and Ha (alternative hypothesis)?
c. Calculate your statistic.
d. What decision does this inform you to make and why? (You may use the critical value in the chart or the calculated p-value, but you must indicate what you are doing.)
e. Write a one to two sentence conclusion that correctly responds to the question. Use APA format to report your statistic ex. [(df)=1.1, p<.05]
1. A particular resource class must perform at a level consistent with the rest of the school to avoid being discontinued. On the first quarter statewide test, the mean score of the school was 84. The 14 students in the resource class had a 76.17 mean test score and a 17.52 standard deviation. The district informs the principal that the class should be discontinued because the average is below that of the rest of school. Is this reasonable or does the principal have evidence to support an argument against this decision?
0. Which test are you using?
0. What are your H0 (null hypothesis) and Ha (alternative hypothesis)?
0. Calculate your statistic.
0. What decision does this inform you to make and why? (You may use the critical value in the chart or the calculated p-value, but you must indicate what you are doing.)
0. Write a one to two sentence conclusion that correctly responds to the question. Use APA format to report your statistic ex. [(df)=1.1, p<.05]
.
Decoding the Tweet _ Practical Criticism in the Age of Hashtag.pptx
Mr. Jones and the New WorksheetMr. Jones wanted to check if ther.docx
1. Mr. Jones and the New Worksheet
Mr. Jones wanted to check if there was an observable impact of
a particular worksheet on his students’ test scores for Chapter 1.
His idea was to test if there was a significant variation in the
average test score of the class that used the worksheet in
comparison to the class that did not. In the class before lunch,
he used the worksheet but not the class after lunch. He has 23
students in each of the two classes. Their test scores are below:
Before Lunch
After Lunch
86
79
23
67
59
45
74
46
98
67
38
90
81
80
14
79
32
72
38
63
35
84
51
38
2. 31
60
18
56
57
20
44
70
68
43
27
33
24
16
16
14
31
58
24
30
82
95
a. Which test are you using?
b. What are your H0 (null hypothesis) and Ha (alternative
hypothesis)?
c. Calculate your statistic.
d. What decision does this inform you to make and why? (You
may use the critical value in the chart or the calculated p-value,
3. but you must indicate what you are doing.)
e. Write a one to two sentence conclusion that correctly
responds to the question. Use APA format to report your
statistic ex. [(df)=1.1, p<.05]
1. A particular resource class must perform at a level consistent
with the rest of the school to avoid being discontinued. On the
first quarter statewide test, the mean score of the school was 84.
The 14 students in the resource class had a 76.17 mean test
score and a 17.52 standard deviation. The district informs the
principal that the class should be discontinued because the
average is below that of the rest of school. Is this reasonable or
does the principal have evidence to support an argument against
this decision?
0. Which test are you using?
0. What are your H0 (null hypothesis) and Ha (alternative
hypothesis)?
0. Calculate your statistic.
0. What decision does this inform you to make and why? (You
may use the critical value in the chart or the calculated p-value,
but you must indicate what you are doing.)
0. Write a one to two sentence conclusion that correctly
responds to the question. Use APA format to report your
statistic ex. [(df)=1.1, p<.05]