Tabel R
- 1. Wijaya : Tabel Statistika 1
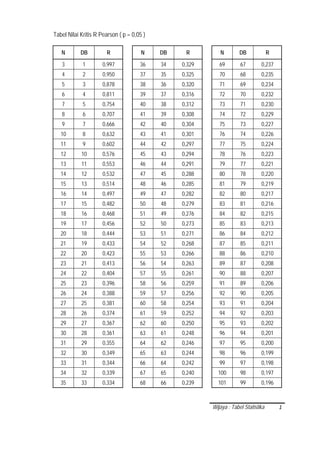
Tabel Nilai Kritis R Pearson ( p = 0,05 )
N DB R N DB R N DB R
3 1 0,997 36 34 0,329 69 67 0,237
4 2 0,950 37 35 0,325 70 68 0,235
5 3 0,878 38 36 0,320 71 69 0,234
6 4 0,811 39 37 0,316 72 70 0,232
7 5 0,754 40 38 0,312 73 71 0,230
8 6 0,707 41 39 0,308 74 72 0,229
9 7 0,666 42 40 0,304 75 73 0,227
10 8 0,632 43 41 0,301 76 74 0,226
11 9 0,602 44 42 0,297 77 75 0,224
12 10 0,576 45 43 0,294 78 76 0,223
13 11 0,553 46 44 0,291 79 77 0,221
14 12 0,532 47 45 0,288 80 78 0,220
15 13 0,514 48 46 0,285 81 79 0,219
16 14 0,497 49 47 0,282 82 80 0,217
17 15 0,482 50 48 0,279 83 81 0,216
18 16 0,468 51 49 0,276 84 82 0,215
19 17 0,456 52 50 0,273 85 83 0,213
20 18 0,444 53 51 0,271 86 84 0,212
21 19 0,433 54 52 0,268 87 85 0,211
22 20 0,423 55 53 0,266 88 86 0,210
23 21 0,413 56 54 0,263 89 87 0,208
24 22 0,404 57 55 0,261 90 88 0,207
25 23 0,396 58 56 0,259 91 89 0,206
26 24 0,388 59 57 0,256 92 90 0,205
27 25 0,381 60 58 0,254 93 91 0,204
28 26 0,374 61 59 0,252 94 92 0,203
29 27 0,367 62 60 0,250 95 93 0,202
30 28 0,361 63 61 0,248 96 94 0,201
31 29 0,355 64 62 0,246 97 95 0,200
32 30 0,349 65 63 0,244 98 96 0,199
33 31 0,344 66 64 0,242 99 97 0,198
34 32 0,339 67 65 0,240 100 98 0,197
35 33 0,334 68 66 0,239 101 99 0,196
- 2. Wijaya : Tabel Statistika 2
Tabel Nilai Kritis R Pearson ( p = 0,05 )
N DB R N DB R N DB R
102 100 0,195 135 133 0,169 168 166 0,151
103 101 0,194 136 134 0,168 169 167 0,151
104 102 0,193 137 135 0,168 170 168 0,151
105 103 0,192 138 136 0,167 171 169 0,150
106 104 0,191 139 137 0,167 172 170 0,150
107 105 0,190 140 138 0,166 173 171 0,149
108 106 0,189 141 139 0,165 174 172 0,149
109 107 0,188 142 140 0,165 175 173 0,148
110 108 0,187 143 141 0,164 176 174 0,148
111 109 0,187 144 142 0,164 177 175 0,148
112 110 0,186 145 143 0,163 178 176 0,147
113 111 0,185 146 144 0,163 179 177 0,147
114 112 0,184 147 145 0,162 180 178 0,146
115 113 0,183 148 146 0,161 181 179 0,146
116 114 0,182 149 147 0,161 182 180 0,146
117 115 0,182 150 148 0,160 183 181 0,145
118 116 0,181 151 149 0,160 184 182 0,145
119 117 0,180 152 150 0,159 185 183 0,144
120 118 0,179 153 151 0,159 186 184 0,144
121 119 0,179 154 152 0,158 187 185 0,144
122 120 0,178 155 153 0,158 188 186 0,143
123 121 0,177 156 154 0,157 189 187 0,143
124 122 0,176 157 155 0,157 190 188 0,142
125 123 0,176 158 156 0,156 191 189 0,142
126 124 0,175 159 157 0,156 192 190 0,142
127 125 0,174 160 158 0,155 193 191 0,141
128 126 0,174 161 159 0,155 194 192 0,141
129 127 0,173 162 160 0,154 195 193 0,141
130 128 0,172 163 161 0,154 196 194 0,140
131 129 0,172 164 162 0,153 197 195 0,140
132 130 0,171 165 163 0,153 198 196 0,139
133 131 0,170 166 164 0,152 199 197 0,139
134 132 0,170 167 165 0,152 200 198 0,139