SlideShare a Scribd company logo
1 of 16
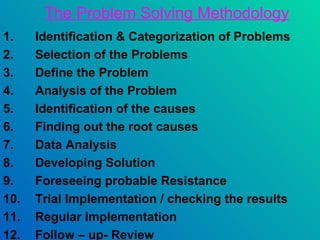
The Problem Solving Methodology
1.    Identification & Categorization of Problems
2.    Selection of the Problems
3.    Define the Problem
4.    Analysis of the Problem
5.    Identification of the causes
6.    Finding out the root causes
7.    Data Analysis
8.    Developing Solution
9.    Foreseeing probable Resistance
10.   Trial Implementation / checking the results
11.   Regular Implementation
12.   Follow – up- Review
1. Identification problems
 If brainstorming is done in the proper way,
 minimum 50 problems can be easily
 identified.
So the marks to be given are as follows:

  50 and more problems          : 5 marks
  40 to 49 problems             : 4 marks
  30 to 39 problems             : 3 marks
  20 to 29 problems             : 2 marks
  Below 20                      : 1 mark
Categorization of Problems
 Quality Circle members are advised to
 categories the problems generated as:

‘A’ : Minimum involvement of other
  departments needed in solving them.

‘B’ : Involvement of other department is a
      necessity.

‘C’ : Management sanction may be
     needed in implementing the solution.
Basis of Categorization
They can also use a different method to
categories them such as pollution related,
safety related, waste related, productivity
related etc.

Therefore, As long as there is a systematic
approach for categorization, it is taken it is
acceptable for evaluation.
2. Selection of Problems
Selection of problem can be done.,
• Based on data
• Using weightage basis
• Using group consensus method or any
  other acceptable system.
  Best way of selecting a problem is based
  on data. Brain Storming, Data Collection,
  Pareto Analysis and Flow Diagram and
  Graphs are used.
  Where data is not available weightage
  basis or group consensus method may be
3. Define the Problem
• Quality Circle activity is a group activity and one
  should get synergistic effect through that. They
  call for effective contribution from all participants.
  Participants can contribute only when there is
  clarity about the problem.
• Such clarity can be achieved with the help of Flow
  Diagram and also carrying out Brainstorming.
• This is the stage in which Quality Circle will have
  to work out the action plan, setting up a target of
  achievement and also time needed to carry out the
  entire task.
• A Gantt Chart or Milestone Chart need to be made
  in this stage. Flow diagrams may be also used for
  this.
4. Analysis of the Problem
For this step Quality Circle should
•     collect further data,

•    study the flow diagram,

•    stratify the data available,

•    check up the graphs or make graphs with the
     data available.

Brainstorming also need to be done.
5. Identification of Causes
• Quality Circles should at the initial stage make C
  & E diagram using dispersion Analysis Method.
  Here logical approach and questioning ‘why’ is
  done for finding the sub cause, sub-sub cause,
  sub-sub-sub cause by the circles.

• Once they become knowledgeable after a year or
  two Quality Circles should use C & E Diagram or
  Enumeration Method. This will help to have
  creative thinking. Ultimately, C & E Diagram
  Process Oriented type is to be used.
6. Identification of the Root Causes
• This is the stage of selecting the root causes and
  establishing them beyond doubts.

• Brainstorming is need to be done in this stage. A
  Flow Diagram will be very useful.

• All analysis are based on data collected.
  Stratification, Graphs will be of great use.

• ‘AA’ category circles of five years and above are
  expected to use Scatter Diagram to establish
  correlation and Histogram to find out the
  frequency distribution.
7. Data Analysis
• This is the step for confirming of one’s
  finding before proceeding for finding out
  the solution.

• Pareto Diagram, Stratification, Graphs,
  Scatter Diagram, Histogram and Control
  Charts are very useful here. Use of them
  depends upon the type of Quality Circle.
8. Developing the Solution

• Brain Storming can be used but data
  collection is a must. Flow Diagram,
  Graphs, Scatter Diagram and Control also
  will be helpful in this activities.
9. Foreseeing Probable Resistance

  • Changes are not easily acceptable to the
    people. Brain Storming to find out ways to
    over come the resistance is needed here.
    Flow diagram will be very useful here.
10. Trial Implementation
• It is not advisable to go for regular
  complementation straight away. Trial
  implementation is to be done.
• Then collect data on the trial implementation
  to find out the effectiveness. They can be
  made as Graphs, Stratification may be needed
  of the data collected.
• Scatter Diagram, Histogram and Control
  Charts are of additional use.
11. Regular Implementation
• Once this is done QC should ensure that
  changes are made in the standard
  practice or working system.

• Data Collection is a must to know the real
  benefit, Graphs are needed. Control
  Charts are useful for regular follow up.
12. Follow up / Review

• This is the report based on follow up over a
  period. Review need to be done to see whether
  any further improvement is possible and also to
  ensure necessary measures are taken to hold the
  gain achieved.

• Flow Diagram, Data Collection, Graphs are
  needed here. Control Chart is recommended.
NOTE

• Is it necessary that all the steps have to be
  compulsorily used by the QC? Not
  necessarily. This is a systematic way of
  problem solving. For some problems there
  may not be any need to use a particular step.

• QC should mention in those places reason
  for not using those steps. If the evaluator is
  satisfied, the Circle can be given the
  appropriate marks for that step.

More Related Content

What's hot (20)

Basic 8D Problem Solving Tools & Methods - Part 2
Basic 8D Problem Solving Tools & Methods - Part 2Basic 8D Problem Solving Tools & Methods - Part 2
Basic 8D Problem Solving Tools & Methods - Part 2
 
Quality circle
Quality circle Quality circle
Quality circle
 
7 qc tools training material[1]
7 qc tools training material[1]7 qc tools training material[1]
7 qc tools training material[1]
 
Dmaic overview for slideshare
Dmaic overview for slideshareDmaic overview for slideshare
Dmaic overview for slideshare
 
Quality circle presentation by yusuff
Quality circle presentation by yusuffQuality circle presentation by yusuff
Quality circle presentation by yusuff
 
Spc training
Spc training Spc training
Spc training
 
Problem solving preview
Problem solving previewProblem solving preview
Problem solving preview
 
Quality circles
Quality circlesQuality circles
Quality circles
 
Quality circle 2
Quality circle 2Quality circle 2
Quality circle 2
 
Six sigma case study-a good approach with example
Six sigma case study-a good approach with exampleSix sigma case study-a good approach with example
Six sigma case study-a good approach with example
 
Quality Circle
Quality CircleQuality Circle
Quality Circle
 
TPM 8 Pillars
TPM 8 PillarsTPM 8 Pillars
TPM 8 Pillars
 
QC Circle
QC CircleQC Circle
QC Circle
 
DMAIC Components
DMAIC ComponentsDMAIC Components
DMAIC Components
 
5 whys
5 whys5 whys
5 whys
 
7 QC TOOLS PRESENTATION PPT
 7 QC TOOLS PRESENTATION PPT 7 QC TOOLS PRESENTATION PPT
7 QC TOOLS PRESENTATION PPT
 
Failure Mode & Effects Analysis (FMEA)
Failure Mode & Effects Analysis (FMEA)Failure Mode & Effects Analysis (FMEA)
Failure Mode & Effects Analysis (FMEA)
 
Jishu hozen
Jishu  hozenJishu  hozen
Jishu hozen
 
Qcc
QccQcc
Qcc
 
Qcc
QccQcc
Qcc
 

Viewers also liked (6)

Medical records department
Medical records departmentMedical records department
Medical records department
 
medical record department
medical record departmentmedical record department
medical record department
 
Role of medical audit
Role of medical auditRole of medical audit
Role of medical audit
 
Medical Records Role and its Maintenance.
Medical Records Role and its Maintenance.Medical Records Role and its Maintenance.
Medical Records Role and its Maintenance.
 
Medical records ppt
Medical records pptMedical records ppt
Medical records ppt
 
Clinilal audit
Clinilal auditClinilal audit
Clinilal audit
 

Similar to Twelve steps of qc

8D Problem Solving
8D Problem Solving8D Problem Solving
8D Problem SolvingAjay Garg
 
TQM UNIT 2.pptx presentation with images
TQM UNIT 2.pptx presentation with imagesTQM UNIT 2.pptx presentation with images
TQM UNIT 2.pptx presentation with imagesPradeep482741
 
Ppt total quality management
Ppt total quality managementPpt total quality management
Ppt total quality managementAnitha Velusamy
 
Quality assurance
Quality assuranceQuality assurance
Quality assuranceRijoLijo
 
Root cause analysis arg sc
Root cause analysis arg scRoot cause analysis arg sc
Root cause analysis arg scManish Chaurasia
 
Introduction to Six Sigma.pptx
Introduction to Six Sigma.pptxIntroduction to Six Sigma.pptx
Introduction to Six Sigma.pptxAshweeniTiwari
 
FOCUS PDCA Quality Imporvement Methodology
FOCUS PDCA  Quality Imporvement MethodologyFOCUS PDCA  Quality Imporvement Methodology
FOCUS PDCA Quality Imporvement MethodologyJoven Botin Bilbao
 
Lecture 5 Quality Performance Tools & Techniques
Lecture 5  Quality Performance Tools & TechniquesLecture 5  Quality Performance Tools & Techniques
Lecture 5 Quality Performance Tools & TechniquesTantish QS, UTM
 
8D Training Material From VDiversify.com | 8D Training Material PDF Free Down...
8D Training Material From VDiversify.com | 8D Training Material PDF Free Down...8D Training Material From VDiversify.com | 8D Training Material PDF Free Down...
8D Training Material From VDiversify.com | 8D Training Material PDF Free Down...VDiversify
 
A3 Problem Solving Technique.pdf
A3 Problem Solving Technique.pdfA3 Problem Solving Technique.pdf
A3 Problem Solving Technique.pdfLeviBian1
 
Root cause analysis - tools and process
Root cause analysis - tools and processRoot cause analysis - tools and process
Root cause analysis - tools and processCharles Cotter, PhD
 
Pick 2 topics and discusstalk about the topics. No plagiarism wi.docx
Pick 2 topics and discusstalk about the topics.  No plagiarism wi.docxPick 2 topics and discusstalk about the topics.  No plagiarism wi.docx
Pick 2 topics and discusstalk about the topics. No plagiarism wi.docxrandymartin91030
 
LPP application and problem formulation
LPP application and problem formulationLPP application and problem formulation
LPP application and problem formulationKarishma Chaudhary
 
Total Quality Management_module 4_18ME734.pptx
Total Quality Management_module 4_18ME734.pptxTotal Quality Management_module 4_18ME734.pptx
Total Quality Management_module 4_18ME734.pptxRoopaDNDandally
 

Similar to Twelve steps of qc (20)

8D Problem Solving
8D Problem Solving8D Problem Solving
8D Problem Solving
 
PDCA AND SEVEN STEPS
PDCA AND SEVEN STEPSPDCA AND SEVEN STEPS
PDCA AND SEVEN STEPS
 
TQM UNIT 2.pptx presentation with images
TQM UNIT 2.pptx presentation with imagesTQM UNIT 2.pptx presentation with images
TQM UNIT 2.pptx presentation with images
 
Ppt total quality management
Ppt total quality managementPpt total quality management
Ppt total quality management
 
Quality assurance
Quality assuranceQuality assurance
Quality assurance
 
Root cause analysis arg sc
Root cause analysis arg scRoot cause analysis arg sc
Root cause analysis arg sc
 
Introduction to Six Sigma.pptx
Introduction to Six Sigma.pptxIntroduction to Six Sigma.pptx
Introduction to Six Sigma.pptx
 
FOCUS PDCA Quality Imporvement Methodology
FOCUS PDCA  Quality Imporvement MethodologyFOCUS PDCA  Quality Imporvement Methodology
FOCUS PDCA Quality Imporvement Methodology
 
FOCUS PDCA
FOCUS PDCAFOCUS PDCA
FOCUS PDCA
 
Lecture 5 Quality Performance Tools & Techniques
Lecture 5  Quality Performance Tools & TechniquesLecture 5  Quality Performance Tools & Techniques
Lecture 5 Quality Performance Tools & Techniques
 
QT final.pptx
QT final.pptxQT final.pptx
QT final.pptx
 
8D Training Material From VDiversify.com | 8D Training Material PDF Free Down...
8D Training Material From VDiversify.com | 8D Training Material PDF Free Down...8D Training Material From VDiversify.com | 8D Training Material PDF Free Down...
8D Training Material From VDiversify.com | 8D Training Material PDF Free Down...
 
SQT.ppt
SQT.pptSQT.ppt
SQT.ppt
 
A3 Problem Solving Technique.pdf
A3 Problem Solving Technique.pdfA3 Problem Solving Technique.pdf
A3 Problem Solving Technique.pdf
 
Root cause analysis - tools and process
Root cause analysis - tools and processRoot cause analysis - tools and process
Root cause analysis - tools and process
 
Pick 2 topics and discusstalk about the topics. No plagiarism wi.docx
Pick 2 topics and discusstalk about the topics.  No plagiarism wi.docxPick 2 topics and discusstalk about the topics.  No plagiarism wi.docx
Pick 2 topics and discusstalk about the topics. No plagiarism wi.docx
 
LPP application and problem formulation
LPP application and problem formulationLPP application and problem formulation
LPP application and problem formulation
 
Total Quality Management_module 4_18ME734.pptx
Total Quality Management_module 4_18ME734.pptxTotal Quality Management_module 4_18ME734.pptx
Total Quality Management_module 4_18ME734.pptx
 
Root Cause Analysis تحليل أسباب جذور المشكلة
Root Cause Analysis تحليل أسباب جذور المشكلةRoot Cause Analysis تحليل أسباب جذور المشكلة
Root Cause Analysis تحليل أسباب جذور المشكلة
 
Qc
QcQc
Qc
 

More from Prabhat Pandey

More from Prabhat Pandey (7)

Basic concept of q c
Basic concept of q cBasic concept of q c
Basic concept of q c
 
QC question answer
QC question answerQC question answer
QC question answer
 
Cosmic power
Cosmic powerCosmic power
Cosmic power
 
How to make presentation for qc competition
How to make presentation for qc competitionHow to make presentation for qc competition
How to make presentation for qc competition
 
Benefits of kaizen
Benefits of kaizenBenefits of kaizen
Benefits of kaizen
 
Basic concept of qc
Basic concept of qcBasic concept of qc
Basic concept of qc
 
We indian
We indianWe indian
We indian
 

Recently uploaded

Measures of Dispersion and Variability: Range, QD, AD and SD
Measures of Dispersion and Variability: Range, QD, AD and SDMeasures of Dispersion and Variability: Range, QD, AD and SD
Measures of Dispersion and Variability: Range, QD, AD and SDThiyagu K
 
Nutritional Needs Presentation - HLTH 104
Nutritional Needs Presentation - HLTH 104Nutritional Needs Presentation - HLTH 104
Nutritional Needs Presentation - HLTH 104misteraugie
 
Z Score,T Score, Percential Rank and Box Plot Graph
Z Score,T Score, Percential Rank and Box Plot GraphZ Score,T Score, Percential Rank and Box Plot Graph
Z Score,T Score, Percential Rank and Box Plot GraphThiyagu K
 
Web & Social Media Analytics Previous Year Question Paper.pdf
Web & Social Media Analytics Previous Year Question Paper.pdfWeb & Social Media Analytics Previous Year Question Paper.pdf
Web & Social Media Analytics Previous Year Question Paper.pdfJayanti Pande
 
JAPAN: ORGANISATION OF PMDA, PHARMACEUTICAL LAWS & REGULATIONS, TYPES OF REGI...
JAPAN: ORGANISATION OF PMDA, PHARMACEUTICAL LAWS & REGULATIONS, TYPES OF REGI...JAPAN: ORGANISATION OF PMDA, PHARMACEUTICAL LAWS & REGULATIONS, TYPES OF REGI...
JAPAN: ORGANISATION OF PMDA, PHARMACEUTICAL LAWS & REGULATIONS, TYPES OF REGI...anjaliyadav012327
 
Separation of Lanthanides/ Lanthanides and Actinides
Separation of Lanthanides/ Lanthanides and ActinidesSeparation of Lanthanides/ Lanthanides and Actinides
Separation of Lanthanides/ Lanthanides and ActinidesFatimaKhan178732
 
1029-Danh muc Sach Giao Khoa khoi 6.pdf
1029-Danh muc Sach Giao Khoa khoi  6.pdf1029-Danh muc Sach Giao Khoa khoi  6.pdf
1029-Danh muc Sach Giao Khoa khoi 6.pdfQucHHunhnh
 
Call Girls in Dwarka Mor Delhi Contact Us 9654467111
Call Girls in Dwarka Mor Delhi Contact Us 9654467111Call Girls in Dwarka Mor Delhi Contact Us 9654467111
Call Girls in Dwarka Mor Delhi Contact Us 9654467111Sapana Sha
 
Student login on Anyboli platform.helpin
Student login on Anyboli platform.helpinStudent login on Anyboli platform.helpin
Student login on Anyboli platform.helpinRaunakKeshri1
 
Russian Call Girls in Andheri Airport Mumbai WhatsApp 9167673311 💞 Full Nigh...
Russian Call Girls in Andheri Airport Mumbai WhatsApp  9167673311 💞 Full Nigh...Russian Call Girls in Andheri Airport Mumbai WhatsApp  9167673311 💞 Full Nigh...
Russian Call Girls in Andheri Airport Mumbai WhatsApp 9167673311 💞 Full Nigh...Pooja Nehwal
 
BAG TECHNIQUE Bag technique-a tool making use of public health bag through wh...
BAG TECHNIQUE Bag technique-a tool making use of public health bag through wh...BAG TECHNIQUE Bag technique-a tool making use of public health bag through wh...
BAG TECHNIQUE Bag technique-a tool making use of public health bag through wh...Sapna Thakur
 
A Critique of the Proposed National Education Policy Reform
A Critique of the Proposed National Education Policy ReformA Critique of the Proposed National Education Policy Reform
A Critique of the Proposed National Education Policy ReformChameera Dedduwage
 
Measures of Central Tendency: Mean, Median and Mode
Measures of Central Tendency: Mean, Median and ModeMeasures of Central Tendency: Mean, Median and Mode
Measures of Central Tendency: Mean, Median and ModeThiyagu K
 
Activity 01 - Artificial Culture (1).pdf
Activity 01 - Artificial Culture (1).pdfActivity 01 - Artificial Culture (1).pdf
Activity 01 - Artificial Culture (1).pdfciinovamais
 
The Most Excellent Way | 1 Corinthians 13
The Most Excellent Way | 1 Corinthians 13The Most Excellent Way | 1 Corinthians 13
The Most Excellent Way | 1 Corinthians 13Steve Thomason
 
Paris 2024 Olympic Geographies - an activity
Paris 2024 Olympic Geographies - an activityParis 2024 Olympic Geographies - an activity
Paris 2024 Olympic Geographies - an activityGeoBlogs
 
Introduction to Nonprofit Accounting: The Basics
Introduction to Nonprofit Accounting: The BasicsIntroduction to Nonprofit Accounting: The Basics
Introduction to Nonprofit Accounting: The BasicsTechSoup
 

Recently uploaded (20)

Measures of Dispersion and Variability: Range, QD, AD and SD
Measures of Dispersion and Variability: Range, QD, AD and SDMeasures of Dispersion and Variability: Range, QD, AD and SD
Measures of Dispersion and Variability: Range, QD, AD and SD
 
Nutritional Needs Presentation - HLTH 104
Nutritional Needs Presentation - HLTH 104Nutritional Needs Presentation - HLTH 104
Nutritional Needs Presentation - HLTH 104
 
Mattingly "AI & Prompt Design: The Basics of Prompt Design"
Mattingly "AI & Prompt Design: The Basics of Prompt Design"Mattingly "AI & Prompt Design: The Basics of Prompt Design"
Mattingly "AI & Prompt Design: The Basics of Prompt Design"
 
Z Score,T Score, Percential Rank and Box Plot Graph
Z Score,T Score, Percential Rank and Box Plot GraphZ Score,T Score, Percential Rank and Box Plot Graph
Z Score,T Score, Percential Rank and Box Plot Graph
 
Web & Social Media Analytics Previous Year Question Paper.pdf
Web & Social Media Analytics Previous Year Question Paper.pdfWeb & Social Media Analytics Previous Year Question Paper.pdf
Web & Social Media Analytics Previous Year Question Paper.pdf
 
JAPAN: ORGANISATION OF PMDA, PHARMACEUTICAL LAWS & REGULATIONS, TYPES OF REGI...
JAPAN: ORGANISATION OF PMDA, PHARMACEUTICAL LAWS & REGULATIONS, TYPES OF REGI...JAPAN: ORGANISATION OF PMDA, PHARMACEUTICAL LAWS & REGULATIONS, TYPES OF REGI...
JAPAN: ORGANISATION OF PMDA, PHARMACEUTICAL LAWS & REGULATIONS, TYPES OF REGI...
 
Separation of Lanthanides/ Lanthanides and Actinides
Separation of Lanthanides/ Lanthanides and ActinidesSeparation of Lanthanides/ Lanthanides and Actinides
Separation of Lanthanides/ Lanthanides and Actinides
 
1029-Danh muc Sach Giao Khoa khoi 6.pdf
1029-Danh muc Sach Giao Khoa khoi  6.pdf1029-Danh muc Sach Giao Khoa khoi  6.pdf
1029-Danh muc Sach Giao Khoa khoi 6.pdf
 
Call Girls in Dwarka Mor Delhi Contact Us 9654467111
Call Girls in Dwarka Mor Delhi Contact Us 9654467111Call Girls in Dwarka Mor Delhi Contact Us 9654467111
Call Girls in Dwarka Mor Delhi Contact Us 9654467111
 
Student login on Anyboli platform.helpin
Student login on Anyboli platform.helpinStudent login on Anyboli platform.helpin
Student login on Anyboli platform.helpin
 
Advance Mobile Application Development class 07
Advance Mobile Application Development class 07Advance Mobile Application Development class 07
Advance Mobile Application Development class 07
 
Russian Call Girls in Andheri Airport Mumbai WhatsApp 9167673311 💞 Full Nigh...
Russian Call Girls in Andheri Airport Mumbai WhatsApp  9167673311 💞 Full Nigh...Russian Call Girls in Andheri Airport Mumbai WhatsApp  9167673311 💞 Full Nigh...
Russian Call Girls in Andheri Airport Mumbai WhatsApp 9167673311 💞 Full Nigh...
 
BAG TECHNIQUE Bag technique-a tool making use of public health bag through wh...
BAG TECHNIQUE Bag technique-a tool making use of public health bag through wh...BAG TECHNIQUE Bag technique-a tool making use of public health bag through wh...
BAG TECHNIQUE Bag technique-a tool making use of public health bag through wh...
 
A Critique of the Proposed National Education Policy Reform
A Critique of the Proposed National Education Policy ReformA Critique of the Proposed National Education Policy Reform
A Critique of the Proposed National Education Policy Reform
 
Measures of Central Tendency: Mean, Median and Mode
Measures of Central Tendency: Mean, Median and ModeMeasures of Central Tendency: Mean, Median and Mode
Measures of Central Tendency: Mean, Median and Mode
 
Mattingly "AI & Prompt Design: Structured Data, Assistants, & RAG"
Mattingly "AI & Prompt Design: Structured Data, Assistants, & RAG"Mattingly "AI & Prompt Design: Structured Data, Assistants, & RAG"
Mattingly "AI & Prompt Design: Structured Data, Assistants, & RAG"
 
Activity 01 - Artificial Culture (1).pdf
Activity 01 - Artificial Culture (1).pdfActivity 01 - Artificial Culture (1).pdf
Activity 01 - Artificial Culture (1).pdf
 
The Most Excellent Way | 1 Corinthians 13
The Most Excellent Way | 1 Corinthians 13The Most Excellent Way | 1 Corinthians 13
The Most Excellent Way | 1 Corinthians 13
 
Paris 2024 Olympic Geographies - an activity
Paris 2024 Olympic Geographies - an activityParis 2024 Olympic Geographies - an activity
Paris 2024 Olympic Geographies - an activity
 
Introduction to Nonprofit Accounting: The Basics
Introduction to Nonprofit Accounting: The BasicsIntroduction to Nonprofit Accounting: The Basics
Introduction to Nonprofit Accounting: The Basics
 

Twelve steps of qc

  • 1. The Problem Solving Methodology 1. Identification & Categorization of Problems 2. Selection of the Problems 3. Define the Problem 4. Analysis of the Problem 5. Identification of the causes 6. Finding out the root causes 7. Data Analysis 8. Developing Solution 9. Foreseeing probable Resistance 10. Trial Implementation / checking the results 11. Regular Implementation 12. Follow – up- Review
  • 2. 1. Identification problems If brainstorming is done in the proper way, minimum 50 problems can be easily identified. So the marks to be given are as follows: 50 and more problems : 5 marks 40 to 49 problems : 4 marks 30 to 39 problems : 3 marks 20 to 29 problems : 2 marks Below 20 : 1 mark
  • 3. Categorization of Problems Quality Circle members are advised to categories the problems generated as: ‘A’ : Minimum involvement of other departments needed in solving them. ‘B’ : Involvement of other department is a necessity. ‘C’ : Management sanction may be needed in implementing the solution.
  • 4. Basis of Categorization They can also use a different method to categories them such as pollution related, safety related, waste related, productivity related etc. Therefore, As long as there is a systematic approach for categorization, it is taken it is acceptable for evaluation.
  • 5. 2. Selection of Problems Selection of problem can be done., • Based on data • Using weightage basis • Using group consensus method or any other acceptable system. Best way of selecting a problem is based on data. Brain Storming, Data Collection, Pareto Analysis and Flow Diagram and Graphs are used. Where data is not available weightage basis or group consensus method may be
  • 6. 3. Define the Problem • Quality Circle activity is a group activity and one should get synergistic effect through that. They call for effective contribution from all participants. Participants can contribute only when there is clarity about the problem. • Such clarity can be achieved with the help of Flow Diagram and also carrying out Brainstorming. • This is the stage in which Quality Circle will have to work out the action plan, setting up a target of achievement and also time needed to carry out the entire task. • A Gantt Chart or Milestone Chart need to be made in this stage. Flow diagrams may be also used for this.
  • 7. 4. Analysis of the Problem For this step Quality Circle should • collect further data, • study the flow diagram, • stratify the data available, • check up the graphs or make graphs with the data available. Brainstorming also need to be done.
  • 8. 5. Identification of Causes • Quality Circles should at the initial stage make C & E diagram using dispersion Analysis Method. Here logical approach and questioning ‘why’ is done for finding the sub cause, sub-sub cause, sub-sub-sub cause by the circles. • Once they become knowledgeable after a year or two Quality Circles should use C & E Diagram or Enumeration Method. This will help to have creative thinking. Ultimately, C & E Diagram Process Oriented type is to be used.
  • 9. 6. Identification of the Root Causes • This is the stage of selecting the root causes and establishing them beyond doubts. • Brainstorming is need to be done in this stage. A Flow Diagram will be very useful. • All analysis are based on data collected. Stratification, Graphs will be of great use. • ‘AA’ category circles of five years and above are expected to use Scatter Diagram to establish correlation and Histogram to find out the frequency distribution.
  • 10. 7. Data Analysis • This is the step for confirming of one’s finding before proceeding for finding out the solution. • Pareto Diagram, Stratification, Graphs, Scatter Diagram, Histogram and Control Charts are very useful here. Use of them depends upon the type of Quality Circle.
  • 11. 8. Developing the Solution • Brain Storming can be used but data collection is a must. Flow Diagram, Graphs, Scatter Diagram and Control also will be helpful in this activities.
  • 12. 9. Foreseeing Probable Resistance • Changes are not easily acceptable to the people. Brain Storming to find out ways to over come the resistance is needed here. Flow diagram will be very useful here.
  • 13. 10. Trial Implementation • It is not advisable to go for regular complementation straight away. Trial implementation is to be done. • Then collect data on the trial implementation to find out the effectiveness. They can be made as Graphs, Stratification may be needed of the data collected. • Scatter Diagram, Histogram and Control Charts are of additional use.
  • 14. 11. Regular Implementation • Once this is done QC should ensure that changes are made in the standard practice or working system. • Data Collection is a must to know the real benefit, Graphs are needed. Control Charts are useful for regular follow up.
  • 15. 12. Follow up / Review • This is the report based on follow up over a period. Review need to be done to see whether any further improvement is possible and also to ensure necessary measures are taken to hold the gain achieved. • Flow Diagram, Data Collection, Graphs are needed here. Control Chart is recommended.
  • 16. NOTE • Is it necessary that all the steps have to be compulsorily used by the QC? Not necessarily. This is a systematic way of problem solving. For some problems there may not be any need to use a particular step. • QC should mention in those places reason for not using those steps. If the evaluator is satisfied, the Circle can be given the appropriate marks for that step.