
Recommended
More Related Content
Similar to K1046761 Project Report
Similar to K1046761 Project Report (20)
K1046761 Project Report
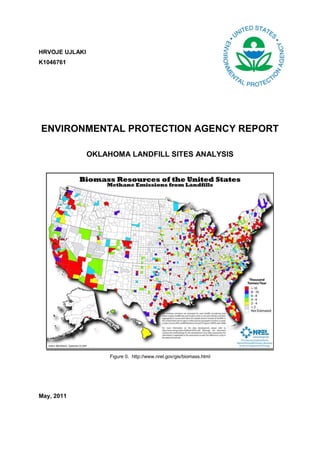
- 1. HRVOJE UJLAKI K1046761 ENVIRONMENTAL PROTECTION AGENCY REPORT OKLAHOMA LANDFILL SITES ANALYSIS Figure 0. http://www.nrel.gov/gis/biomass.html May, 2011
- 2. INTRODUCTION Landfill sites represent locations where local authorities and industry take waste to be buried and compacted with other wastes. The Environmental Agency licenses and regulates landfill sites to ensure that their impact on the environment is minimised. According to EPA Municipal Solid Waste (MSW), landfills are the second-largest source of human-related methane emissions in the United States. The landfills at the same time represent an opportunity to capture and use methane as a significant source of energy. As solid waste decomposes in a landfill, LFG is created. LFG consists of Methane (50%), which is primary component of natural gas, carbon dioxide CO2 (50%) and just small amount of organic compounds. The amount of methane created depends on the quantity and moisture content of the waste and the design and management practices at the site. Environmental Protection Agency (EPA) has a task to evaluate and assess potential environmental danger associated with landfill sites across the United States. EPA has also established a voluntary program to reduce methane emissions from landfills. This program is known as Landfill Methane Outreach Program (LMOP). LMOP works with companies, utilities and communities to encourage the use of landfill gas for energy. This report will investigate threats from landfill sites in Oklahoma. There are 94 Landfill sites in Oklahoma. Information about these sites and their post codes are obtained from EPA database. Post codes were used for determining landfill locations. For that operation ArcGis geocoding tool was used. Analysis will be conducted using GIS tools like ESRI ARCINFO and results will be compared with analysis conducted with Quantum GIS. Data used for this analysis is taken from US TIGER in vector format. Before we started analysis, the data was projected to WGS_1984_UTM_Zone_14N. Data obtained represented all of the US. Therefore, data was clipped to the Oklahoma area before the analysis took place. This report includes two main segments of analysis and except the tables with calculations, two additional maps will be produced to assist in visualization of results. 1. METHANE GAS LEAKAGE SCENARIO For this analysis the task was to establish areas that would be affected in case of any uncontrolled methane leakage. The analysis is based upon wind speeds of 10mph to 100mph in 10mph interval. Initially landfill zip codes were geocoded in ARCInfo with the help of Geocode Adresses tool. The Buffering method was used to determine the areas, cities and towns that will be affected in one hour period at different wind speeds. Buffers were also completed in ARCInfo software from ESRI. Buffer Wizard was used in this project.
- 3. Buffers from landfill sites are made separately for each wind speed. Cities and towns were extracted for each buffer zone in order to determine population and area affected by contamination. In order to sum up population cities, the layer was joined with buffer layer and all components from Cities attribute tables were summarised. At wind speeds higher than 20 mph, the affected area crosses Oklahoma borders. In these cases the number of affected population was extracted in Oklahoma from the total number of the population affected. The area affected in case of uncontrolled leakage was mapped first. Areas were split into 10 buffer zones according to wind speeds, from 10mph-100mph. Figure 1: Affected area after uncontrolled leakage in one hour period at different wind speeds This map shows how contamination will increase in one hour period at different wind speeds. If wind speed is 100mph, the whole Oklahoma area will be affected in less than 30 minutes. The whole state of Oklahoma will be affected in one hour if wind speed is 40mph or greater. In order to obtain more detailed information about affected areas, the whole analysis was made again for different wind speeds.
- 4. 10 miles per hour analysis At wind speed of 10mph, 152 urban areas were affected. Out of these 152 areas, 100 were cities, 47 towns and 5 CDP. All together 1964130 people were affected. Figure 2: Affected area after uncontrolled leakage in one hour period at 20mph wind speeds 20 miles per hour analysis At wind speeds of 20mph, the affected area is much larger. The affected area includes 552 places, out of which 164 are cities, 382 are towns and 6 are CDP. Total population affected in these places is 2475375. If the area is narrowed strictly to Oklahoma State, the number of affected places is 519 and the number of affected people is 2303499. Figure 3: Affected area after uncontrolled leakage in one hour period at 20mph wind speeds
- 5. 30 miles per hour analysis At this wind speed, almost all Oklahoma will be contaminated. All together 2835925 people will be affected and out of that number, 2405956 is from 586 places in Oklahoma and 429969 is from surrounding states. Figure 4: Affected area after uncontrolled leakage in one hour period at 30mph wind speeds 40 miles per hour analysis At 40 mph, all urban areas of Oklahoma are affected, which means that 588 places and 2411339 residents are in danger zone. If we include surrounding states, this number raises up to 806 places and 3093306 people. For higher wind speeds number of affected places and people is same. That means that all of them will be contaminated within one hour if wind speeds are above 30mph. Figure 5: Affected area after uncontrolled leakage in one hour period at 40mph wind speeds
- 6. 40-100 miles per hour analysis Above images clearly show that in the case of the increase in wind speed, the affected area is larger than Oklahoma State. Therefore, in the case of wind speed of 50mph, 3380435 people are affected. At 60mph, 3687510 people are affected; at 70mph 4584304 people are affected. At 80mph there are 5524854 residents who will be affected. For 90mph, 7729103 people will be affected and for 100mph wind around 8539211 people will be affected. Detailed names of places with population number for Oklahoma State can be provided upon request in a detailed table. Table 1. Wind speed People affected OK Urban areas ALL Cities Towns CDP TOTAL people in All states 10 1964130 152 100 47 5 1964130 20 2303790 552 164 382 6 2303790 30 2405956 586 156 424 6 2405956 40 2411339 588 158 424 6 3093306 50 2411339 588 158 424 6 3380435 60 2411339 588 158 424 6 3687510 70 2411339 588 158 424 6 4584304 80 2411339 588 158 424 6 5524854 90 2411339 588 158 424 6 7729103 100 2411339 588 158 424 6 8539211 Figure 6: People affected across USA and Oklahoma people affected at different wind speeds (mpa) Table and graph show how number of population rises with increase in wind speed. When wind speed exceeds 30mph, the whole area and population of Oklahoma is affected.
- 7. SUMMARY Based on the information gathered in the analysis, it is clear that amount of people affected by leakage is rising as wind speed is increasing. Even though methane is a non toxic element, it can have negative effects on population. For example, if buildings are built close to landfill sites, methane gas can penetrate into structures and expose residents to significant amount of methane. EFA recommends that buildings that are closest to landfill sites install specially engineered recovery systems below their basements to actively capture such fugitive off-gas and vent it away from the building. 2. LOCATIONS FOR NEW LANDFILL SITES IN OKLAHOMA In order to fulfil public demand for new landfill sites, several new locations had to be found in Oklahoma State. EPA task is to ensure that impact of these sites on environment and public is minimal. In order to achieve that, preliminary analysis of possible locations was conducted. In this analysis EPA was directed according to standard criteria for Landfill sites. An additional analysis will have to be done, but the Landfill sites should be at least as below: Within 10 miles of a major road Within 20 miles of a transportation terminal Within 30 miles of a hospital At least 20 miles outside of any major urban area At least 20 miles from major water feature At least 10 miles from a national park Results of this analysis are shown in Figure 7. They show that according to given criteria there are no suitable landfill sites in Oklahoma.
- 8. Figure 7: Exclusion zone according to given criteria Since demand for new landfill sites rises rapidly, criteria will have to be modified where possible and new analysis will have to be done. In the second analysis, a buffer zone around major water areas will have to be reduced to at least 10 miles and the road zone to 5 miles. In this case, three new possible locations occur in North Oklahoma. If we reduce buffer zone around hospitals to 20 miles, several new locations emerge and with these criteria there are 10 potential locations. The Landfill sites based on the new criteria have to be at least as below: Within 5 miles of a major road Within 20 miles of a transportation terminal Within 20 miles of a hospital At least 20 miles outside of any major urban area At least 10 miles from major water feature At least 10 miles from a national park
- 9. Figure 8: Second part of a new landfill locations analysis SUMMARY EPA suggests ten new possible locations for land fill sites. They are developed according to above criteria and are the best possible solution in given circumstances. In the Appendix 1, two maps will be added. One map for each task will be produced to help in visualization of the analysis results. At the end of this part of the report A4 size maps for both of analyses will be added. The first map is showing area affected by methane leakage at wind speeds from 10 – 100 miles per hour. The second map is a part of Landfill location analysis and shows areas suitable for new landfill sites in Oklahoma. Both of them are completed with ArcGIS.
- 10. ZONES AFFECTED BY METHANE LEAKAGE AT DIFFERENT WIND SPEEDS
- 12. 3. ARCINFO AND Q-GIS SOFTWARE COMPARISON In order to check the accuracy of the methods used in the above analysis, another parallel analysis was conducted. This analysis was delivered with the usage of a different GIS software which is known as Quantum GIS. Quantum GIS is an Open Source Geographical Information System. The idea for that open project was born in May 2002. Currently QGIS runs on almost all platforms like UNIX, Windows and OS X. This report will compare major differences, advantages and disadvantages of the two systems. Major difference is in the fact that ARCInfo consists of three separate parts, ArcCatalog, ArcToolbox and ArcMap, while QGIS is developed as one Interface. The major problem in QGIS is reprojecting landfill sites. During the reprojection some of the sites were not reprojected, even after they were edited in Excel and reopened. More differences between two software’s are shown in Table 2 Table 2. Operation performed in ArcInfo – Professional software QGIS- Open Source software this analysis Projection On fly and permanent OTF is not set by default projection qrj. file Geocoding Easy Problems with geocoding Intersect - Require Two step to draw Only one step, it saves selection Selection new layer directly Some lines stretch Much better on edges Multiple buffers No multiple buffers Buffering with OTF Cannot buffer on OTF or CRS Buffering projection projection Faster buffering of larger Buffering only in meters files Longer time needed for buffering water and roads features Works fine Could not perform reproject on all Reproject landfill points even after editing points in excel Much better view with Basic layout with more complicated Layout view more options way for exporting or printing files Maplex option Legend is simple without extra possibilities More Professional More user friendly User Interface oriented Licences are Open source free software Costs expensive
- 13. Figure 9: Map produced entirely with QGIS – Methane spreading at different wind speeds Figure 10: Map of potential landfill sites produced entirely in QGIS software
- 14. Conclusion This report has described two analyses of landfill sites in Oklahoma State. Firstly, both analyses were conducted using professional software for which a licence has to be purchased. The second time, both analyses were completed in Open Source software QGIS. After performing the same analyses using two different systems, the aim was to prove that GIS analysis and mapping is possible to complete without investing large amounts of money in buying licences. As documented in the above text, both systems are capable of performing these types of tasks. ArcGIS is more professionally orientated, with higher speed in complex operations. QGIS had minor problems during projecting landfill sites, however at all other operations it did well. It is slower than ArcGIS, especially in buffering larger files such as rivers and roads. On the other hand, QGIS has more user friendly interface and it is easier to understand, especially for beginners in GIS. If we consider price and possibilities of software, the advantage is on QGIS side.
- 15. REFERENCES Figure 0. National Renewable Energy Laboratory Biomass maps http://www.nrel.gov/gis/biomass.html accessed [ 10.05.2011] Jiawei Facts about landfills http://jiawei2010.com/indies-facts-about-landfills-for-kids/ [accessed 10.03.2011] Sutton, T., O. Dassau., M. Sutton. (2009) A Gentle Introduction to GIS Spatial Planning & Information, Department of Land Affairs, Eastern Cape, South Africa United States Environmental Protection Agency Basic Information http://www.epa.gov/lmop/basic-info/ carful [accessed 15.04.2011] United States Environmental Protection Agency Sources and Emissions http://www.epa.gov/methane/sources.html [accessed 16.04.2011]