SlideShare una empresa de Scribd logo
1 de 16
•   Of the various types of thematic maps, choropleth maps are the most common and easily
    interpreted. With a choropleth map one uses a sequence of shades, colors or patterns to assign
    values/classes using predefined areal units (politically-defined area or administrative units--census
    areas or zip codes). Here we are using dot maps, as they provide an easily understood pattern of
    relative AIDS density.
•
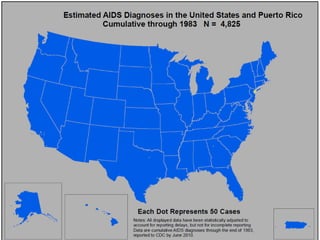
•   In this series of county-based dot-density maps, the data used are estimated AIDS cases by county,
    for the 50 US states, Washington D.C. and Puerto Rico, cumulative through 2008. The mapped
    data excludes cases where the county of residence at AIDS diagnosis is unknown (but these cases
    are accounted for in the title of each map where the cumulative number is provided). The dot size
    and value remain constant through time; each dot represents 50 cases of AIDS by county. In other
    words, if by 2005 a particular county hasn’t reported more than 49 cumulative cases of AIDS, then
    that county would not have a dot associated with it -- it doesn’t mean that county doesn’t have any
    cases of AIDS, only that it doesn’t have 50 or more. Additionally, if a county has between 50 and
    99 cases of AIDS, it receives 1 dot. In several areas the dots begin to coalesce as time
    passes. Assigning one dot to every 100 cases was considered, but left many areas of the
    US erroneously under-represented. Finally, the dots are randomly placed inside the counties.
•
•   Data source: HIV Incidence and Case Surveillance Branch, Division of HIV/AIDS Prevention, Centers
    for Disease Control and Prevention. Data have been adjusted for reporting delays. Data are
    presented for AIDS cases reported to CDC through June 2008. All data are provisional.
Was your Sex Ed lacking? Find the
      missing chapter with


                            Username:
                            iPROVIBE

Más contenido relacionado

Similar a AIDS Maps

C.2. Risk and Risk Assessments HCA 402Risk and Community Risk .docx
C.2. Risk and Risk Assessments HCA 402Risk and Community Risk .docxC.2. Risk and Risk Assessments HCA 402Risk and Community Risk .docx
C.2. Risk and Risk Assessments HCA 402Risk and Community Risk .docxclairbycraft
 
Sample, advanced epidemiology factor analysis
Sample, advanced epidemiology factor analysisSample, advanced epidemiology factor analysis
Sample, advanced epidemiology factor analysisKellieWatkins1
 
CJS_SeniorSythesis_HRawl
CJS_SeniorSythesis_HRawlCJS_SeniorSythesis_HRawl
CJS_SeniorSythesis_HRawlHollie Rawl
 
Police-Related Deaths and Neighborhood Economic and Racial/Ethnic Polarizatio...
Police-Related Deaths and Neighborhood Economic and Racial/Ethnic Polarizatio...Police-Related Deaths and Neighborhood Economic and Racial/Ethnic Polarizatio...
Police-Related Deaths and Neighborhood Economic and Racial/Ethnic Polarizatio...Jim Bloyd, DrPH, MPH
 
Regionalsnapshot_HealthDisparities_Oct2023
Regionalsnapshot_HealthDisparities_Oct2023Regionalsnapshot_HealthDisparities_Oct2023
Regionalsnapshot_HealthDisparities_Oct2023ARCResearch
 
0Principles of EpidemiologyMEASURES OF DISEASE OCCURRENCE IN POPUL.docx
0Principles of EpidemiologyMEASURES OF DISEASE OCCURRENCE IN POPUL.docx0Principles of EpidemiologyMEASURES OF DISEASE OCCURRENCE IN POPUL.docx
0Principles of EpidemiologyMEASURES OF DISEASE OCCURRENCE IN POPUL.docxhoney725342
 
November 2021 Public Health Snapshot
November 2021 Public Health SnapshotNovember 2021 Public Health Snapshot
November 2021 Public Health Snapshotlaylabellows
 
The Effect Race and Income on HIV AIDS infection in African-Americans - Sunil...
The Effect Race and Income on HIV AIDS infection in African-Americans - Sunil...The Effect Race and Income on HIV AIDS infection in African-Americans - Sunil...
The Effect Race and Income on HIV AIDS infection in African-Americans - Sunil...Sunil Nair
 

Similar a AIDS Maps (12)

C.2. Risk and Risk Assessments HCA 402Risk and Community Risk .docx
C.2. Risk and Risk Assessments HCA 402Risk and Community Risk .docxC.2. Risk and Risk Assessments HCA 402Risk and Community Risk .docx
C.2. Risk and Risk Assessments HCA 402Risk and Community Risk .docx
 
Sample, advanced epidemiology factor analysis
Sample, advanced epidemiology factor analysisSample, advanced epidemiology factor analysis
Sample, advanced epidemiology factor analysis
 
GIS_Final Draft
GIS_Final DraftGIS_Final Draft
GIS_Final Draft
 
CJS_SeniorSythesis_HRawl
CJS_SeniorSythesis_HRawlCJS_SeniorSythesis_HRawl
CJS_SeniorSythesis_HRawl
 
Police-Related Deaths and Neighborhood Economic and Racial/Ethnic Polarizatio...
Police-Related Deaths and Neighborhood Economic and Racial/Ethnic Polarizatio...Police-Related Deaths and Neighborhood Economic and Racial/Ethnic Polarizatio...
Police-Related Deaths and Neighborhood Economic and Racial/Ethnic Polarizatio...
 
Regionalsnapshot_HealthDisparities_Oct2023
Regionalsnapshot_HealthDisparities_Oct2023Regionalsnapshot_HealthDisparities_Oct2023
Regionalsnapshot_HealthDisparities_Oct2023
 
0Principles of EpidemiologyMEASURES OF DISEASE OCCURRENCE IN POPUL.docx
0Principles of EpidemiologyMEASURES OF DISEASE OCCURRENCE IN POPUL.docx0Principles of EpidemiologyMEASURES OF DISEASE OCCURRENCE IN POPUL.docx
0Principles of EpidemiologyMEASURES OF DISEASE OCCURRENCE IN POPUL.docx
 
Poster
PosterPoster
Poster
 
DEMOGRAPHY.pptx
DEMOGRAPHY.pptxDEMOGRAPHY.pptx
DEMOGRAPHY.pptx
 
November 2021 Public Health Snapshot
November 2021 Public Health SnapshotNovember 2021 Public Health Snapshot
November 2021 Public Health Snapshot
 
The Effect Race and Income on HIV AIDS infection in African-Americans - Sunil...
The Effect Race and Income on HIV AIDS infection in African-Americans - Sunil...The Effect Race and Income on HIV AIDS infection in African-Americans - Sunil...
The Effect Race and Income on HIV AIDS infection in African-Americans - Sunil...
 
Rural Minnesota Journal: Who Lives in Minnesota?
Rural Minnesota Journal: Who Lives in Minnesota?Rural Minnesota Journal: Who Lives in Minnesota?
Rural Minnesota Journal: Who Lives in Minnesota?
 

Más de iPROVIBE

Mortality - HIV
Mortality - HIVMortality - HIV
Mortality - HIViPROVIBE
 
Method of Collecting HIV Statistics
Method of Collecting HIV StatisticsMethod of Collecting HIV Statistics
Method of Collecting HIV StatisticsiPROVIBE
 
Hiv incidence
Hiv incidenceHiv incidence
Hiv incidenceiPROVIBE
 
HIV US Maps 2010
HIV US Maps 2010HIV US Maps 2010
HIV US Maps 2010iPROVIBE
 
HIV Injection Drug Users
HIV Injection Drug UsersHIV Injection Drug Users
HIV Injection Drug UsersiPROVIBE
 
Epidemiology of HIV Infection
Epidemiology of HIV InfectionEpidemiology of HIV Infection
Epidemiology of HIV InfectioniPROVIBE
 
AIDS Regional
AIDS RegionalAIDS Regional
AIDS RegionaliPROVIBE
 
Adolescents
AdolescentsAdolescents
AdolescentsiPROVIBE
 
2010 HIV Race/Ethnicity Slides
2010 HIV Race/Ethnicity Slides2010 HIV Race/Ethnicity Slides
2010 HIV Race/Ethnicity SlidesiPROVIBE
 
2010 aid strends
2010 aid strends2010 aid strends
2010 aid strendsiPROVIBE
 
2010 Pediatric HIV
2010 Pediatric HIV2010 Pediatric HIV
2010 Pediatric HIViPROVIBE
 
Urban and Nonurban Areas - HIV
Urban and Nonurban Areas - HIVUrban and Nonurban Areas - HIV
Urban and Nonurban Areas - HIViPROVIBE
 
Molluscum Contagiosum
Molluscum ContagiosumMolluscum Contagiosum
Molluscum ContagiosumiPROVIBE
 
Lice & Scabies
Lice & ScabiesLice & Scabies
Lice & ScabiesiPROVIBE
 
Lymphogranuloma Venereum - LGV
Lymphogranuloma Venereum - LGVLymphogranuloma Venereum - LGV
Lymphogranuloma Venereum - LGViPROVIBE
 
Granuloma inguinale
Granuloma inguinaleGranuloma inguinale
Granuloma inguinaleiPROVIBE
 

Más de iPROVIBE (20)

Women
WomenWomen
Women
 
Msm 2010
Msm 2010Msm 2010
Msm 2010
 
Mortality - HIV
Mortality - HIVMortality - HIV
Mortality - HIV
 
Method of Collecting HIV Statistics
Method of Collecting HIV StatisticsMethod of Collecting HIV Statistics
Method of Collecting HIV Statistics
 
Hiv incidence
Hiv incidenceHiv incidence
Hiv incidence
 
HIV US Maps 2010
HIV US Maps 2010HIV US Maps 2010
HIV US Maps 2010
 
HIV Injection Drug Users
HIV Injection Drug UsersHIV Injection Drug Users
HIV Injection Drug Users
 
Epidemiology of HIV Infection
Epidemiology of HIV InfectionEpidemiology of HIV Infection
Epidemiology of HIV Infection
 
AIDS Regional
AIDS RegionalAIDS Regional
AIDS Regional
 
Adolescents
AdolescentsAdolescents
Adolescents
 
2010 HIV Race/Ethnicity Slides
2010 HIV Race/Ethnicity Slides2010 HIV Race/Ethnicity Slides
2010 HIV Race/Ethnicity Slides
 
2010 aid strends
2010 aid strends2010 aid strends
2010 aid strends
 
2010 Pediatric HIV
2010 Pediatric HIV2010 Pediatric HIV
2010 Pediatric HIV
 
Urban and Nonurban Areas - HIV
Urban and Nonurban Areas - HIVUrban and Nonurban Areas - HIV
Urban and Nonurban Areas - HIV
 
Molluscum Contagiosum
Molluscum ContagiosumMolluscum Contagiosum
Molluscum Contagiosum
 
Lice & Scabies
Lice & ScabiesLice & Scabies
Lice & Scabies
 
Lymphogranuloma Venereum - LGV
Lymphogranuloma Venereum - LGVLymphogranuloma Venereum - LGV
Lymphogranuloma Venereum - LGV
 
Herpes
HerpesHerpes
Herpes
 
Granuloma inguinale
Granuloma inguinaleGranuloma inguinale
Granuloma inguinale
 
Gonorrhea
GonorrheaGonorrhea
Gonorrhea
 

AIDS Maps

  • 1.
  • 2.
  • 3.
  • 4.
  • 5.
  • 6.
  • 7.
  • 8.
  • 9.
  • 10.
  • 11.
  • 12.
  • 13.
  • 14.
  • 15. Of the various types of thematic maps, choropleth maps are the most common and easily interpreted. With a choropleth map one uses a sequence of shades, colors or patterns to assign values/classes using predefined areal units (politically-defined area or administrative units--census areas or zip codes). Here we are using dot maps, as they provide an easily understood pattern of relative AIDS density. • • In this series of county-based dot-density maps, the data used are estimated AIDS cases by county, for the 50 US states, Washington D.C. and Puerto Rico, cumulative through 2008. The mapped data excludes cases where the county of residence at AIDS diagnosis is unknown (but these cases are accounted for in the title of each map where the cumulative number is provided). The dot size and value remain constant through time; each dot represents 50 cases of AIDS by county. In other words, if by 2005 a particular county hasn’t reported more than 49 cumulative cases of AIDS, then that county would not have a dot associated with it -- it doesn’t mean that county doesn’t have any cases of AIDS, only that it doesn’t have 50 or more. Additionally, if a county has between 50 and 99 cases of AIDS, it receives 1 dot. In several areas the dots begin to coalesce as time passes. Assigning one dot to every 100 cases was considered, but left many areas of the US erroneously under-represented. Finally, the dots are randomly placed inside the counties. • • Data source: HIV Incidence and Case Surveillance Branch, Division of HIV/AIDS Prevention, Centers for Disease Control and Prevention. Data have been adjusted for reporting delays. Data are presented for AIDS cases reported to CDC through June 2008. All data are provisional.
  • 16. Was your Sex Ed lacking? Find the missing chapter with Username: iPROVIBE