Jaenisch ron - power trend investing with andrews pithfork
- 2. To contact the author, go to www.Andrewscourse.com
He can be reached via email at ronj@san.rr.com
Copyrights Notice © Reinhart Industries Inc, 2013. All rights reserved
ALL RIGHTS RESERVED: No part of this material may be reproduced without written permission from
the publisher and the author. No part of this book may be reproduced, stored in a retrieval system, or
transmitted in any form or by any means, photocopying, electronic, mechanical, or otherwise, without the
prior permission of the publisher and the author.
Library of Congress Cataloguing-in-Publication
Protected by United States Copyright Law in accordance with title 17, United States Code
Table of Contents
A kind review is appreciated
Preface
REQUIRED LEGAL STUFF
What’s in it for you?
The Basis of Elliott Wave and Andrews Pivot Theory
The Elliott Rule of Alternation
The Elliott Thrust Wave Rules
The Andrews Median Line
Making Corrections Easier to Deal With
Andrews Rules
Andrews Rules Combined with Elliott Wave Theory
Why Selectively Focus Upon A Part of Elliott Wave Theory?
Letting the Rules Work for You
Using Software that Combines Andrews and Elliott
Taking it to the Next Level
Entering the Trade/Investment
Exiting the Trade/Investment
Keeping Profits from Vanishing
Getting started with minimal risk
- 5. Preface
This book is the first in the series. Each book in the series has a unique technique.
Alan Andrews liked to enter a position at the start of a new trend, ideally at the end of a correction. What
did Andrews use to determine if a move had ended? It appears that he would look at a chart and simply
know. When the author asked him to explain how he knew, he drew several lines and showed how the
market had set things up for a reversal. He showed how he did this with multiple charts and, in most
cases, the logic for finding the reversal points varied slightly.
Doing this on historical charts with perfect 20/20 hindsight is easy, but what about doing this while the
market is reversing? To convince doubters, he demonstrated his uncanny ability each year covering a
period of several months. His goal was to turn $5,000 into $50,000 by trading futures.
To provide those observing with a more hands-on experience, he sent out a newsletter on Friday
containing a script to be read to the broker on Monday (the orders indicated section). In his newsletters he
also explained the signals used and exactly what the logic was behind the orders.
You can clearly see in the excerpts from his newsletters (sections cut out below) that the orders were
given in advance and the profits were significant. These excerpts are from the nearly 1,000 page Andrews
Expanded Course, which contains years of newsletters and all of the documentation that this author has
from Alan Andrews. It is only available to a limited number.
- 8. motivated me to travel and fly across the country to his home in Florida and attend his private course and
live seminar. During the private time I spent with Dr. Andrews sitting at his kitchen table, I was able to
ask him many questions. One of them was “Which easy-to-apply course techniques can be combined with
Elliott Wave to find future long and strong moves for investing?” Dr. Andrews’ answer was that Elliott
Wave was unnecessarily complicated, but he encouraged me to combine some of his techniques with
specific subsets of the Elliott Wave theory.
R. N. Elliott based his wave theory on market psychology, Fibonacci numbers, the .618 ratio, and
reoccurring patterns of the behavior of investors, resulting in predictable future patterns.
Professor Alan Hall Andrews based his theories upon the energy and location of price action patterns,
Newton’s laws of motion, and probability to pinpoint when the trend has reversed and predict when it
will reverse in the future.
As you will discover, the differences between the two are both in theory and practice. This is partially
due to vast differences between the selections of pivots. A five wave count in Andrews is not necessarily
a five wave count in Elliott Wave.
This writer’s computer-based research in combining the Babson, Andrews, and Elliott techniques
resulted in determining times when they can be combined. This book covers the easy-to-learn method
approved by Dr. Andrews.
After the findings were documented, they were included in, what was at the time, the new Andrews
Babson course manual, which the writer developed for teaching course methods on the west coast. Prior
to his passing, Dr. Andrews reviewed the entire course manual and wrote on the cover, “An Inspiring
digest of the course methods.”
This book answers many questions. One of them is, “What portion of the Andrews Advanced course
techniques can be combined with specific Elliott Wave patterns to find many future long and strong moves
for investing?” It also serves as an introduction to both Elliott Wave and Andrews’ “pitchfork”
techniques. The focus is to find a good percentage of the long and strong moves in ETF’s, Forex, futures,
and stocks. As a result, the focus is limited to specific patterns.
To fully understand Elliott Wave involves elaborate correction patterns that are far too difficult for most
traders. These sometimes complex patterns are beyond the scope of this work. They are well documented
in books by many others.
To fully understand all of Andrews’ techniques would require the reader to be familiar with his writings
prior to 1975. Alan Andrews’ best work was in the early 1970s when he was sending out a newsletter at
the end of every week with a detailed script for his students to read to the broker on the following
Monday morning. The newsletter contained the reasoning behind the various trades, along with extensive
instructions and illustrations. Andrews is known for the median line; however, much of the focus of his
writings was on the Babson Reaction lines. The reaction line that he wrote was best for determining the
location of the end of a trend; he referred to it as “ORE.” This was something that he did not include in the
course that he sold. It is only available to those that are fortunate enough to have his writings from the
early 1970s.
At the present time, this writer is involved in the development of software with the latest technology that
will take this to the next level.
- 10. REQUIRED LEGAL STUFF
General Terms of Use
THE INFORMATION PROVIDED IN THIS DOCUMENT IS FOR EDUCATIONAL
PURPOSES ONLY.
IT IS PROVIDED AS GENERAL MARKET COMMENTARY AND DOES NOT
CONSTITUTE INVESTMENT ADVICE. NEITHER THE AUTHOR NOR ASSOCIATES,
DISTRIBUTORS, HEIRS, OR ASSIGNS SHALL ACCEPT LIABILITY FOR ANY LOSS
OR DAMAGE, INCLUDING WITHOUT LIMITATION, ANY LOSS OF PROFIT,
WHICH MAY ARISE DIRECTLY OR INDIRECTLY FROM USE OF OR RELIANCE ON
SUCH INFORMATION. THERE IS NO WARRANTY OF ANY KIND.
Required Risk Disclosure—the term “securities” shall apply to all financial instruments.
SECURITIES TRADING OR INVESTING CARRIES SIGNIFICANT RISK AND MAY
NOT BE SUITABLE FOR EVERYONE. THE POSSIBILITY EXISTS THAT YOU
COULD SUSTAIN A LOSS OF SOME OR ALL OF YOUR INITIAL INVESTMENT;
THEREFORE YOU SHOULD NOT INVEST MONEY THAT YOU CANNOT AFFORD
TO LOSE. THE TRADING STRATEGIES DISCUSSED MAY NOT BE SUITABLE FOR
ALL INVESTORS DEPENDING UPON THEIR SPECIFIC INVESTMENT OBJECTIVES
AND FINANCIAL POSITION. INVESTORS MUST MAKE THEIR OWN
INVESTMENT DECISIONS IN LIGHT OF THEIR OWN INVESTMENT OBJECTIVES,
RISK PROFILE, AND CIRCUMSTANCES AND USING SUCH INDEPENDENT
ADVISORS AS THEY BELIEVE NECESSARY. THEREFORE, THE INFORMATION
PROVIDED HEREIN IS NOT INTENDED TO GIVE INVESTORS SPECIFIC ADVICE
AS TO WHETHER THEY SHOULD ENGAGE IN A PARTICULAR TRADING
STRATEGY. IN ADDITION, THE INFORMATION PROVIDED HEREIN HAS BEEN
PREPARED FOR INFORMATION PURPOSES ONLY AND IS NOT AN OFFER TO
BUY OR SELL, OR A SOLICITATION OF AN OFFER TO BUY OR SELL THE
SECURITIES MENTIONED OR PARTICIPATE IN ANY PARTICULAR TRADING
STRATEGY. MARGIN REQUIREMENTS, TAX CONSIDERATIONS, COMMISSIONS,
AND OTHER TRANSACTION COSTS MAY SIGNIFICANTLY AFFECT THE
ECONOMIC CONSEQUENCES OF THE TRADING STRATEGIES DISCUSSED AND
INVESTORS SHOULD REVIEW SUCH REQUIREMENTS WITH THEIR LEGAL, TAX
AND FINANCIAL ADVISORS. FURTHERMORE, SECURITIES TRADING ENTAILS A
NUMBER OF INHERENT RISKS; BEFORE ENGAGING IN SUCH TRADING
ACTIVITIES, INVESTORS SHOULD UNDERSTAND THE NATURE AND EXTENT OF
THEIR RIGHTS AND OBLIGATIONS AND BE AWARE OF THE RISKS INVOLVED.
THE INFORMATION OR DATA PROVIDED HEREIN IS BASED ON INFORMATION
GENERALLY AVAILABLE TO THE PUBLIC FROM SOURCES BELIEVED TO BE
- 12. What’s in it for you?
The question may appear to be selfish, but when your money is on the line, it is a question that is
important. The answer is very simple and straight forward. By having a profitable method for determining
when to be long, short, or out, one can take advantage of the up and down swings.
For a long only account, going short is now possible on a limited basis by trading select ETFS. Even
though this method of investing will result in many fast, furious, and profitable trades, much of the time it
will also not have a long or short position. This is due to the fact that it relies upon specific patterns to be
in place in order to consider putting on a trade.
A benefit of this approach is that it tends to be out of a long or short position during times when the market
appears to be going mostly sideways.
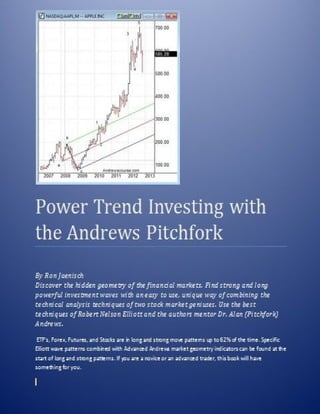
In the above chart, a long position at the #2 and an exit at the #5 would have yielded over 30% in about
six months. However, according to the concepts suggested in this book, during the time prior, and most the
time thereafter, there is no reason to be long or short. The exception being when the trader is using time
- 14. The Basis of Elliott Wave and Andrews Pivot Theory
R. N Elliott developed a unique way of looking at charts of ETF’s, Stocks, Forex, and Commodities. It is
a method of predicting the future based on what occurred in the past. He accomplished this by first having
a mental picture of what the ideal price chart looks like, then labeling the actual charts up to that point, as
if they fit the ideal pattern. He believed that when the investor correctly interpreted the prior price chart
then he was able to forecast the future with greater ease. Today, there are many books that cover Elliott
Wave Theory.
One of the concepts from Elliott Wave is that the end of wave two is an important psychological point.
This is a point when many investors are convinced that the move will go a lot further, but it doesn’t.
As a result, they throw in the towel and miss out on huge profits. This is because they are convinced at the
end of wave two that prices will not reverse but keep on going. It is the end of wave two and the start of
wave three that is the focus of this book.
As you will see in this book and in other publications, the use of Andrews and Babson techniques in
conjunction with Elliott Wave Theory makes forecasting much easier. When Dr. Alan Andrews gave
seminars, he discussed how to utilize his pivot theory, which is much less complicated than Elliott Wave.
He encouraged students to avoid the many complicated levels of other techniques, including Elliott Wave
Theory.
Still, there are many that have taken the Advanced Andrews Course who are wave theory enthusiasts.
With their understanding of both, they combine them and do extremely well in their forecasts and
investing.
An important difference between Andrews and Elliott Wave is the basis of the underlying theory. Elliott
Wave is based upon market psychology and specific, reoccurring natural patterns. Andrews’s theory and
techniques are based upon the laws of motion and the theory that energy is produced during trading. The
energy patterns can be recognized and used by a chartist to generate profits. It is these chart patterns that
provide the foundation to apply Andrews’ concepts and forecast the future.
Andrews wanted to know how the market behaves at specific pivot points to be able to forecast future
price movement. With Elliott Wave Theory alone, it is not possible to determine the probable location of
future pivot points. Elliott Wave theorists typically come up with three to five possible projected
outcomes for a chart pattern. This is because of the variability of the many corrective and thrust patterns.
With Andrews and Babson tools and techniques, this is not the case. The location of future pivots is easier
to forecast. With sophisticated software, one can predict the time and location of most pivots using three
to five prior pivot points. The ES 60 minute chart below illustrates this concept.
- 16. The silver chart labeled Figure #1 is a perfect example of what a perfect Elliott Wave might look like. In
Figure #1 there is the standard five wave thrust pattern and the correction pattern of 3 waves, which are
labeled ABC. The waves 1, 3, and 5 are called impulse waves (in this case, upward movements), waves
2 and 4 are corrective waves (in this case, downwards movement).
An important part of Elliott Wave Theory is that after a five wave thrust pattern, it is followed by a
corrective pattern. In certain cases, the corrective pattern is a simple zigzag, three wave ABC pattern. In
others, it is a different pattern.
As will be seen in the next illustration, when looking at the bigger picture from the start, one could say
that the wave that went from the low to 5 is corrected by the a-b-c pattern. Then, by looking at a more
detailed bigger theoretical picture, we can see that the shorter waves are used as part of a pattern of
similar bigger waves.
- 17. It is the small wave movements that combine to create a big wave, which has the overall appearance of
the basic theoretical Elliott Wave structure. Even though the small waves combine, a big wave chart is
universally used to teach wave theory.
Waves on market charts are typically not as perfect as seen in the sample Elliott Wave chart and tend to be
very different in appearance. This is due to various factors, including the rule of alternation and the fact
that there are over five very different corrective patterns. It is for this reason that Andrews’ techniques are
sought after by traders for making Elliott Wave a viable theory.
The Andrews pivot theory acknowledges that some corrections are simple three pivot waves, as the
Elliott Wave suggests. It is these corrections that are significant in the power wave three step method.
The types of correction waves that apply in looking for what happens prior to long and powerful waves
are often zigzag, double zigzag, and flat. The other corrective patterns are irregular, running, double three,
triple three, and triangles. Some of the types of triangles are ascending, descending, contracting,
symmetrical, expanding, and reverse symmetrical. When considered as a whole, it is enough to make your
head spin.
It is this incredible complexity that Alan Andrews sought to have his students avoid. After all, if he can
make millions with his much less complicated techniques, then others can too.
Typically, there is an extended wave in a five wave pattern. Extensions come in various locations. In the
perfect wave charts previously shown here, they were the longer waves that went from the wave point
marked 2 to the wave point marked 3. Fact is, these extended wave patterns occur in all three of the thrust
waves and also have a tendency to alternate.
It is very common for one of the three thrust waves to be much longer than the other two thrust waves. It is
the longer one that is considered the extended wave, and in the previous chart labeled figure #1 you can
see the sub waves labeled as (1), (2), (3) etc. Many believe that the third wave is most often the longest
of the three thrust waves and that it is also the most likely to be the extended wave of the three thrust
waves. The power trend investing three step technique is designed to take advantage of the third wave
being the longest.
- 23. Another thrust pattern rule is when pivot 4 occurs at the end of the 4th
wave and is not lower than the end
of wave 2, except within a diagonal triangle. This can be seen clearly in every example posted so far.
What can also be seen in every thrust wave example so far is that pivot #2 is not beyond the low pivot if,
as in figure #9, a low is being made or beyond the prior high pivot when pivot #2 is a high pivot.
Wave equality is sort of a rule in that the two non-extended waves are close to equal either in time and/or
distance or have .618 relationships to each other.
Original Elliott Wave Theory has many more concepts that are not hard and fast rules, such as wave
equality, volume, and the “right look.” These concepts are covered in detail by experts in wave theory in
other books.
In this book, the focus will be primarily on one setup that is easy for the novice to Andrews or Elliott
Wave to grasp and apply. This one setup is to find the ABC correction pattern. In order for it to be valid,
the pivot C may not be exceeded by price. If the ABC pattern is valid, it will be followed by a five or
more thrust wave pattern. In many cases, an extended wave occurs after the ABC pattern.
- 24. The Andrews Median Line
My friend, Alan Andrews, told me that the median line came from a student in one of his civil engineering
classes. The class was discussing what Professor Andrews did after he graduated from M.I.T. and
Harvard.
Andrews worked for his father in the Investment business. During this time, he learned a technique from
Roger Babson. It was called the Action-Reaction Method. The Action-Reaction Method is based upon the
idea that prior market action forecasts future market turning points. With clear 20/20 hindsight on old
charts, this was relatively easy, but when forecasting future swing reversal points, this was difficult at
best. Three lines were necessary for this technique and the most critical one is known as the center line.
The center line is most critical because it determines the angles of the lines to be used for determining
future reversal points.
A student in Professor Andrew’s civil engineering class suggested that a median line be used. In the chart
they were studying, the median line proved to be the optimal center line.
Andrews did a lot of research with median lines and found that they were extremely useful for
determining the trend that prices will move in.
The median line is very easy to calculate. Take three consecutive pivot points, in figure #10 they are
labeled A, B, and C.
The median line is drawn from the first point A through the midpoint of the distance between points B and
C. What makes the median line so useful in price forecasting is that, according to Dr. Andrews and other
studies, prices make it to the median line in 80% of the cases.
- 28. Figure abc2 shows the length of the wave that ended at point c was a bit over 100% of the wave that
ended at point a. Having an understanding of this can be handy for applying the Andrews rules the reader
is learning here. The 100% area is used by many novices as a target to take profits. As will be learned in
later chapters, there are far better ways to determine when to take a profit because the market will often
move to a point that is far beyond the 100% point.
Probably the most important rule to remember for selecting the abc pivot points is that they are at alternate
points. Therefore, if the A is a low pivot, the B will be a high pivot, and the C will be a low pivot at a
later point in time. If the A is a high pivot, then the B must be a low pivot, and the C pivot will be a high
pivot.
Labeling the wave points with the proper numbers and letters seems to be a problem many chartists have
when applying Elliott Wave Theory. With the addition of only two of the Advanced Andrews Rules, the
reader will find identifying wave points much easier.
If a chartist can identify a five-wave sequence, followed by an ABC correction of some sort, and then the
possible end of waves one and two, he is well on his way to being able to forecast the remainder of the
five-wave sequence in progress. Since most extended waves are the 2-3 wave, the chartist should accept
the fact that he no longer needs to deal with the complexity of correctly and precisely identifying each and
every wave. If the chartist can identify the start of a third wave that leads to a five-wave sequence, then
his abilities will be significant.
Elliott Wave has lots of flexibility in the relationship of wave lengths to each other. It also has a rule that
wave four does not overlap wave one, which we tend to ignore, with Andrews style pivot labeling.
- 30. Andrews Rules
After identifying a possible pivot #2 that is about to go into a third wave, there are two tests that are given
to the pattern utilizing the median line.
First, determine if prices zoomed through the median line as they made pivot #1. An example of this is
seen in figure #13 and figure #14.
Another example of “only the zoom” is seen in figure #14. In most cases, when prices make pivot #1, they
zoom the median line. Andrews taught that prices made the median line 80% of the time. If prices make it
to the median line in 80% of the cases, it would make sense that, in most cases, they are making it when at
pivot #1. If pivot #1 is a reversal of trend, then prices will be more likely to close beyond the median
line. In an Elliott Wave context, they are zooming the median line at the end of wave #1 by spending one
or move closes beyond it. Examples of this zoom are seen in figures #14 and #15. After zooming to pivot
#1, the price goes to a possible pivot #2. According to Elliott Wave rules, in order to qualify as a pivot
#2, the pivot cannot be past the prior extreme of a possible five-wave movement, with the third wave
often being the strongest and longest wave. Andrews considered price patterns to be a demonstration of
the movement of energy. If a pivot #2 is not beyond the start of wave #1, then it is very logical that the
price will not be able to make it to the median line because a change in trend is taking place.
Elliott Wave Theory allows a wide variety of patterns for the end of a multiple pivot swing. Andrews has
various tools and rules for determining the probable location of the pivot. With the Advanced Andrews
- 31. Techniques, these are pattern-dependent and an ABC, followed by the two tests using Andrews’s lines, is
one of them.
In the particular pattern discussed here, the first step with Andrews’s lines is to determine if there is a
Zoom of the median line at pivot #1 or, in wave theory, the end of wave #1.
After this comes the second step, which is to look for prices failing to make it to the median line as they
make pivot #2. Since prices make it to the median line in 80% of the cases, they also will, on occasion,
make the ML at pivot #2. Andrews held that when prices were unable to make it to the median line, they
would make it up after they reversed and go past the next median line. If the third wave is to be the most
powerful, as it is in many cases, then this is likely to occur when they do not make it to the median line at
pivot #2 and leave a space between the end of the move and the median line.
Figure #15 clearly shows that there is a space between pivot #2 and the relevant median line.
Both Andrews and Babson lines may be combined with the Elliott Wave and other technical analysis
techniques. During discussions with Alan Andrews in 1982, he hinted that the end of the Elliott Wave “C”
point can be found, or verified, with something called an “Ore indicator.” After Dr. Andrews passed on, I
came across some of his writings from 1974 regarding the “ORE” technique. Andrews’ writing showed
that he liked using the ore technique to find the end of corrections. From the studies he showed in his
writings, this was used to find the extremes of corrections, especially where pivot #2 is likely to occur or
at the Elliott C point.
- 42. Using Software that Combines Andrews and Elliott
Over the years, the writer has examined various software products. Many have loads of impressive
features and even attempt to forecast future wave patterns based upon various wave theories.
The first software that contained Andrews’ lines was “Orion,” build by Paul Rabrich for the Apple 2+
computer. The first versions of Precision Trader were built by Loren Page. The most popular is Precision
Trader version 3.0, which was designed and built by Michael and Pavel Rada. They were motivated to go
into software development by the results of Michael’s master’s thesis.
Michael Rada conducted a University of Vienna study in the 1990’s, in which he polled successful fund
managers in Vienna. He asked them about their training and to what they attribute their success. Being
good money managers, they all had good stories. However, the one common factor they all shared was
having taken the Advanced Andrews Course through live seminars conducted by the author of this book.
Michal and Pavel built a sophisticated computer program said to rival trade station in some of its
capabilities. They made an arrangement with the writer, whereby they would distribute the graphics
charting portion of their software.
The software they built has various, unique capabilities. The capabilities included being able to train the
user, a unique pivot labeling method, and a trend forecasting model. All of these were capabilities beyond
those requested by the writer. Michael went on to be the vice president of r&d for a major London-based
hedge fund.
A product is under development that will have features that take advantage of the changes in
computer technology and the many insights that originate from the hundreds of pages of the original course
material that we have been researching. A you tube video shows the writings of Dr. Andrews.
To see the massive collection of original Andrews papers, go to https://www.youtube.com/watch?
v=MnrxXMCwhOI
- 53. Keeping Profits from Vanishing
After riding the third wave, many analysts recognize the notion of taking profits because the third
wave may turn out to be a C wave of an ABC. This is an effective way of keeping a substantial portion of
profits even if prices go up for a fifth wave. When the third wave is an extended wave, it is often the case
that after a fourth wave correction the market will go into the fifth wave, which is typically beyond the
end of the third wave, but not necessarily by much.
We found that when trading stocks with a single method, it is useful to use the free service noted
in the next chapter. As a result of doing that we found with some systems after a month or two you can
look back at your trades and see an 80/20 relationship factor in terms of your most profitable trades. In
addition it becomes very easy to determine how much capital is needed to work a system.
For example after a long real time parallel test we found that one particular system only needed a
maximum of 1/3 of the capital we set up for it. The first system made an average of about 3.3% a month
with a max draw down of 1.5%. After adjusting for the 80/20 relationship, we are looking forward to the
next real time parallel test yielding a higher percentage, with an even smaller amount of capital needed.
When trading there are various costs involved including commissions, chart services and
equipment. To keep trading costs manageable charting services and commissions are two important
variables. Be sure to compare the commissions and services provided by at least three brokerage firms.
When it comes to chart services we use eSignal. We utilize eSignal data for out charts.
All charts on our website and this book are courtesy of eSignal. This firm has an interesting
service that comes with their data feed, it can save you hundreds in monthly exchange fees for data for the
asking. This is covered in greater detail later.
Hint: You do not need to actively trade to take advantage of this, just have an account with one of
many deep discount firm like interactive brokers.
However it is probably available with the broker you already have an account with.
- 54. Getting started with minimal risk
According to the Author of the best seller “The Black Swan”, when it appears that there is no
risk, is when risk is greatest. This is the point where what the trader or investor perceives to be a white
swan is really a black swan. He suggests that it is more productive to handle various risks in innovative
ways that lead to better long term results, than to look only for situations that have no risk. Even putting
assets in cash has risk. In this case it is inflation risk, where the use of the money will turn less valuable
over time.
Perhaps this is why strong markets are known to climb a wall of worry. They go up for reasons
unknown to most investors, in spite of the risks known by many. In this chapter there will be a discussion
of ways to eliminate various risks in trading and the investor will be shown and encouraged to utilize
tools that result in no risk to their trading capital, initially.
There are various strategies that the investor or trader can use to deal with the various risk
factors. For example, after developing a trading strategy, it’s time to trade without capital risk by using a
trading simulator. The obvious benefit is not risking your capital, only your time. Probably the most
important reason is that it gives you the opportunity to test various strategies and learn what the
weaknesses are. Performing tests on historical data by developing the method on an early time period and
then testing it on a later time period is useful to see what might have occurred in the later time period.
When that system development stage is completed it is vital to do what is often referred to as real time
paper trading.
With the advent of the internet the paper trading has turned into using parallel trading simulators.
Investopedia.com is one of many free services that gives traders the opportunity to invest parallel to the
actual market in a manner that requires the trader to do everything that would normally be done, in a zero
capital risk environment. There are other free services that permit parallel trading so that the trader can
properly prepare and have a clearer sense as to when it is proper for him to use risk capital in trading.
How long should one trade as part of proper preparation with a simulator trading parallel to
actual market activity? The amount of time and trades will vary depending upon a variety of factors the
first of which is the frequency of trades, but in any case it would take a minimum of six month for a new
trader and a bare minimum of fifty buy and sell transactions.
During that period it is common for the trader to find good reasons to modify something that is
involved with trading. At that point, the clock and number of trades needs to start all over again. For some
traders it means back to the original testing time period to see how the trading method would have worked
out years ago. Some investors find that they need to do this a few times in order to have a model that fits
their preferences and style. This makes perfect sense because if one puts capital at risk during this time
period it is most likely lost.
Even with a rare white swan trading system that has nothing but winning trades, weaknesses such
as distractions or other events that cause improper action can hinder the trader and cause losses. Events
that cause improper action can be anything from bad price data to spilling coffee on a keyboard. To
prevent market moves surprising you and destroying excessive capital, place a stop order.
- 64. View on Risk Management
Trading is somewhat like walking in deep grass carrying eggs in your hands in that you need to
pay attention to several things at once, since there are risks.
Know how deep the risk for each trade you take is and keep it under a small percentage so that if
you drop an egg or two, you will not be wiped out.
The methods we teach will give you more opportunities to have golden egg trades and keep the
risk low . . . be patient, the market will provide more trades soon enough.
If you need more opportunities, you can expand the number of instruments you are monitoring
rather than increase the risk per trade.
Keep the maximum at risk at any moment to a reasonable number. Limit risk to one that will not
require a change in lifestyle.
An example of risk management from a great trader:
If you intend to trade leveraged ETF’s, know that they are very different from futures contracts and non-
leveraged ETFS in many ways. On an outright purchase, the risk appears limited; however, they do not
always follow the market like the futures or the underlying typically do. During the market down move of
2008 there were many investors who had long positions in “3x short index ETF.” This was during a
period when the market went down considerably, which, in theory, would be a profitable trade. For some
reason it wasn’t for them. It appears that this is not uncommon during periods of wild market movements.