SlideShare una empresa de Scribd logo
1 de 15
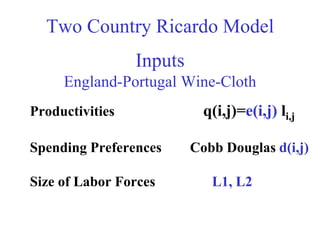
Two Country Ricardo Model
                 Inputs
     England-Portugal Wine-Cloth
Productivities              q(i,j)=e(i,j) li,j

Spending Preferences      Cobb Douglas d(i,j)

Size of Labor Forces         L1, L2
Outputs
•   Which goods are made in which Countries
•   Quantities Consumed
•   Prices
•   National Incomes
•   Utilities (weighted measure of consumption)
Three Different Equilibria as
        Portugal Develops

• Demand (Cloth, Wine) = (2/3,1/3)
• Starting Productivities (Cloth , Wine):
  England (1.0, 0.4) Portugal (0.4, 1.0)

• Then Portugal Improves in Cloth,
  increasing from 0.4 to 0.7 to 1.0
Portugal Cloth Productivity = 0.4


               1.000
               0.900
               0.800


 Portugal’s
               0.700
               0.600
               0.500
               0.400
               0.300
               0.200


Productivity   0.100
               0.000
                       Utility        Income         Cloth           Wine


  in Cloth     1.000
               0.900
                                 Portugal Cloth Productivity = 0.7


               0.800


 Improves      0.700
               0.600
               0.500
               0.400
               0.300
               0.200
               0.100
               0.000
                       Utility        Income         Cloth            Wine


 Effect on                        Portugal Cloth Productivity = 1.0


               1.000


 Portugal      0.900
               0.800
               0.700
               0.600
               0.500
               0.400
               0.300
               0.200
               0.100
               0.000
                       Utility        Income        Cloth            Wine
1.000
               0.900
               0.800


 Portugal’s
               0.700
               0.600
               0.500
               0.400
               0.300
               0.200


Productivity   0.100
               0.000
                          Utility      Income     Cloth     Wine


  in Cloth      1.000
                0.900


 Improves       0.800
                0.700
                0.600
                0.500
                0.400
                0.300
                0.200
                0.100
                0.000
                           Utility      Income     Cloth     Wine


 Effect on        1.000


 England          0.900
                  0.800
                  0.700
                  0.600
                  0.500
                  0.400
                  0.300
                  0.200
                  0.100
                  0.000
                             Utility     Income     Cloth     Wine
Three More Equilibria -England

                  England Consumption                                    England Consumption

1.000                                                  1.000
0.800                                                  0.800
0.600                                                  0.600
                                               Trade                                                  Trade
0.400                                                  0.400
0.200                                                  0.200
0.000                                                  0.000
        Utility   Income      Cloth     Wine                   Utility   Income    Cloth       Wine

                  England Consumption

1.000
0.800
0.600
                                               Trade
0.400
0.200
0.000
        Utility    Income     Cloth     Wine
Three More Equilibria - Portugal
                  Portugal Consumption                                                     Portugal Consumption

1.000                                                                    1.000
0.900                                                                    0.900
0.800                                                                    0.800
0.700                                                                    0.700
0.600                                                                    0.600
0.500                                                       Trade        0.500                                           Trade
0.400                                                                    0.400
0.300                                                                    0.300
0.200                                                                    0.200
0.100                                                                    0.100
0.000                                                                    0.000
        Utility     Income     Cloth           Wine                              Utility    Income     Cloth      Wine


                                                          Portugal Consumption

                                       1.000
                                       0.900
                                       0.800
                                       0.700
                                       0.600
                                       0.500                                                 Trade
                                       0.400
                                       0.300
                                       0.200
                                       0.100
                                       0.000
                                                Utility    Income     Cloth      Wine
Point Pair Shows Equilibrium
     Income Share, and Utilities of Country 1 and Country 2
                              Utility  Income   Diagram


                U   2
                                                                  U   1


                    1                                             1


                        0   .2      .4      .6       .8       1   Z   1
Z1 is Country 1 Income
Previous Equilibria
             Income  Utility    Diagram


U   2
                                               U   1


    1                                          1


        0   .2     .4       .6        .8   1   Z   1
More Equilibria
             Income  Utility      Diagram


U   2
                                                 U   1


    1                                            1


                          Z   C


        0   .2     .4         .6        .8   1   Z   1
Regions of Equilibria and Their
          Boundaries
                        Income  Utility           Diagram


    U   2
                                                                           U   1

                                              England Equilibia Boundary
                Portugal Equilibia Boundary


        1                                                                  1


                                          Z   C


            0         .2          .4          .6         .8           1    Z   1
World Equilibria Boundary
                    World     Equilibia

  U   2                                                U   1
                   World Equilibia Boundary


      1                                                1


                               Z   C

          0   .2       .4          .6         .8   1   Z   1
Three Important Points
             Wine   Cloth   All Equilibria

 U   2                                           U   1


     1                                           1


                             Z   C

         0   .2       .4         .6    .8    1   Z   1
6 Good Model
11 Good Model
                 11 Industries

U   2                                     U   1


    1                                     1


                        Z   C

        0   .2    .4        .6   .8   1   Z   1

Más contenido relacionado

La actualidad más candente

Northern Virginia Fairfax County Housing Market
Northern Virginia Fairfax County Housing MarketNorthern Virginia Fairfax County Housing Market
Northern Virginia Fairfax County Housing MarketBetty Plashal
 
Cumberland-Atlantic-counties-data-demographics-uez
Cumberland-Atlantic-counties-data-demographics-uezCumberland-Atlantic-counties-data-demographics-uez
Cumberland-Atlantic-counties-data-demographics-uezfianacone
 
Trends of Formal and Informal Livestock Marketing in Ethiopia
Trends of Formal and Informal Livestock Marketing in EthiopiaTrends of Formal and Informal Livestock Marketing in Ethiopia
Trends of Formal and Informal Livestock Marketing in Ethiopiaessp2
 
Enterprise and Government Mobility Solutions - Market Update & Outlook 2010
Enterprise and Government Mobility Solutions - Market Update & Outlook 2010Enterprise and Government Mobility Solutions - Market Update & Outlook 2010
Enterprise and Government Mobility Solutions - Market Update & Outlook 2010VDC Research Group
 
מצגת ניהול תיקי השקעות מוקד סלע
מצגת ניהול תיקי השקעות   מוקד סלעמצגת ניהול תיקי השקעות   מוקד סלע
מצגת ניהול תיקי השקעות מוקד סלעmayavital13
 

La actualidad más candente (8)

Cash Flow Projection
Cash Flow ProjectionCash Flow Projection
Cash Flow Projection
 
Cost accounting
Cost accountingCost accounting
Cost accounting
 
Northern Virginia Fairfax County Housing Market
Northern Virginia Fairfax County Housing MarketNorthern Virginia Fairfax County Housing Market
Northern Virginia Fairfax County Housing Market
 
Cumberland-Atlantic-counties-data-demographics-uez
Cumberland-Atlantic-counties-data-demographics-uezCumberland-Atlantic-counties-data-demographics-uez
Cumberland-Atlantic-counties-data-demographics-uez
 
Utah Adult Education Report Card (2008-2009)
Utah Adult Education Report Card (2008-2009)Utah Adult Education Report Card (2008-2009)
Utah Adult Education Report Card (2008-2009)
 
Trends of Formal and Informal Livestock Marketing in Ethiopia
Trends of Formal and Informal Livestock Marketing in EthiopiaTrends of Formal and Informal Livestock Marketing in Ethiopia
Trends of Formal and Informal Livestock Marketing in Ethiopia
 
Enterprise and Government Mobility Solutions - Market Update & Outlook 2010
Enterprise and Government Mobility Solutions - Market Update & Outlook 2010Enterprise and Government Mobility Solutions - Market Update & Outlook 2010
Enterprise and Government Mobility Solutions - Market Update & Outlook 2010
 
מצגת ניהול תיקי השקעות מוקד סלע
מצגת ניהול תיקי השקעות   מוקד סלעמצגת ניהול תיקי השקעות   מוקד סלע
מצגת ניהול תיקי השקעות מוקד סלע
 

Similar a Gomory baumol ricardo_china

Trading summary template
Trading summary templateTrading summary template
Trading summary templatephanquoccuong
 
Presupuesto Personal
Presupuesto PersonalPresupuesto Personal
Presupuesto PersonalVero
 
Comparison wz peer grps
Comparison wz peer grpsComparison wz peer grps
Comparison wz peer grpsArpita Shah
 
Line by environment interaction, yield stability and grouping of test locatio...
Line by environment interaction, yield stability and grouping of test locatio...Line by environment interaction, yield stability and grouping of test locatio...
Line by environment interaction, yield stability and grouping of test locatio...ILRI
 
Gisborne and the global economy
Gisborne and the global economyGisborne and the global economy
Gisborne and the global economyKaramea Insley
 
ACG European Capital Tour: Investing pitfalls / lessons learned and big succe...
ACG European Capital Tour: Investing pitfalls / lessons learned and big succe...ACG European Capital Tour: Investing pitfalls / lessons learned and big succe...
ACG European Capital Tour: Investing pitfalls / lessons learned and big succe...ACGEU
 
Presupuesto Personal
Presupuesto PersonalPresupuesto Personal
Presupuesto PersonalKevin
 
Presupuesto Paula Garro
Presupuesto Paula GarroPresupuesto Paula Garro
Presupuesto Paula GarroPGarro
 
Presupuesto Personal
Presupuesto PersonalPresupuesto Personal
Presupuesto PersonalVeronica S
 
Jörg Mayer: Food price volatility - assessing potential market impacts
Jörg Mayer: Food price volatility - assessing potential market impactsJörg Mayer: Food price volatility - assessing potential market impacts
Jörg Mayer: Food price volatility - assessing potential market impactsfutureagricultures
 
What’s driving demand around the globe europe - richard genest
What’s driving demand around the globe   europe - richard genestWhat’s driving demand around the globe   europe - richard genest
What’s driving demand around the globe europe - richard genestMacadamiaSociety
 
Google analytics-seasonality
Google analytics-seasonalityGoogle analytics-seasonality
Google analytics-seasonalitySemetis
 
Wilkins Kennedy - Business Recovery: Early signs a business is in financial t...
Wilkins Kennedy - Business Recovery: Early signs a business is in financial t...Wilkins Kennedy - Business Recovery: Early signs a business is in financial t...
Wilkins Kennedy - Business Recovery: Early signs a business is in financial t...misssarahj
 
Cotizacion computadora Puebla
Cotizacion computadora PueblaCotizacion computadora Puebla
Cotizacion computadora PueblaBen R
 
Profit And Loss Account
Profit And Loss AccountProfit And Loss Account
Profit And Loss AccountJohn Toon
 

Similar a Gomory baumol ricardo_china (20)

Trading summary template
Trading summary templateTrading summary template
Trading summary template
 
Personal Budge
Personal BudgePersonal Budge
Personal Budge
 
Lembaran kerja
Lembaran kerjaLembaran kerja
Lembaran kerja
 
Presupuesto Personal
Presupuesto PersonalPresupuesto Personal
Presupuesto Personal
 
Comparison wz peer grps
Comparison wz peer grpsComparison wz peer grps
Comparison wz peer grps
 
Line by environment interaction, yield stability and grouping of test locatio...
Line by environment interaction, yield stability and grouping of test locatio...Line by environment interaction, yield stability and grouping of test locatio...
Line by environment interaction, yield stability and grouping of test locatio...
 
Gisborne and the global economy
Gisborne and the global economyGisborne and the global economy
Gisborne and the global economy
 
Personal Budged Lm
Personal Budged LmPersonal Budged Lm
Personal Budged Lm
 
ACG European Capital Tour: Investing pitfalls / lessons learned and big succe...
ACG European Capital Tour: Investing pitfalls / lessons learned and big succe...ACG European Capital Tour: Investing pitfalls / lessons learned and big succe...
ACG European Capital Tour: Investing pitfalls / lessons learned and big succe...
 
Presupuesto Personal
Presupuesto PersonalPresupuesto Personal
Presupuesto Personal
 
Presupuesto Paula Garro
Presupuesto Paula GarroPresupuesto Paula Garro
Presupuesto Paula Garro
 
Personal budge portafolio
Personal budge portafolioPersonal budge portafolio
Personal budge portafolio
 
Personal Budge
Personal BudgePersonal Budge
Personal Budge
 
Presupuesto Personal
Presupuesto PersonalPresupuesto Personal
Presupuesto Personal
 
Jörg Mayer: Food price volatility - assessing potential market impacts
Jörg Mayer: Food price volatility - assessing potential market impactsJörg Mayer: Food price volatility - assessing potential market impacts
Jörg Mayer: Food price volatility - assessing potential market impacts
 
What’s driving demand around the globe europe - richard genest
What’s driving demand around the globe   europe - richard genestWhat’s driving demand around the globe   europe - richard genest
What’s driving demand around the globe europe - richard genest
 
Google analytics-seasonality
Google analytics-seasonalityGoogle analytics-seasonality
Google analytics-seasonality
 
Wilkins Kennedy - Business Recovery: Early signs a business is in financial t...
Wilkins Kennedy - Business Recovery: Early signs a business is in financial t...Wilkins Kennedy - Business Recovery: Early signs a business is in financial t...
Wilkins Kennedy - Business Recovery: Early signs a business is in financial t...
 
Cotizacion computadora Puebla
Cotizacion computadora PueblaCotizacion computadora Puebla
Cotizacion computadora Puebla
 
Profit And Loss Account
Profit And Loss AccountProfit And Loss Account
Profit And Loss Account
 

Más de Ian Hamish Fletcher

Más de Ian Hamish Fletcher (6)

Richard baldwin new_tradetheorylecture
Richard baldwin new_tradetheorylectureRichard baldwin new_tradetheorylecture
Richard baldwin new_tradetheorylecture
 
Helper renewing us-manufacturing
Helper renewing us-manufacturingHelper renewing us-manufacturing
Helper renewing us-manufacturing
 
110314 nfu slideshow
110314 nfu slideshow110314 nfu slideshow
110314 nfu slideshow
 
Long beach d2 p returning manufacturing to america
Long beach d2 p returning manufacturing to americaLong beach d2 p returning manufacturing to america
Long beach d2 p returning manufacturing to america
 
121128 mcs slideshow2
121128 mcs slideshow2121128 mcs slideshow2
121128 mcs slideshow2
 
121128 cpa slideshow
121128 cpa slideshow121128 cpa slideshow
121128 cpa slideshow
 

Gomory baumol ricardo_china

  • 1. Two Country Ricardo Model Inputs England-Portugal Wine-Cloth Productivities q(i,j)=e(i,j) li,j Spending Preferences Cobb Douglas d(i,j) Size of Labor Forces L1, L2
  • 2. Outputs • Which goods are made in which Countries • Quantities Consumed • Prices • National Incomes • Utilities (weighted measure of consumption)
  • 3. Three Different Equilibria as Portugal Develops • Demand (Cloth, Wine) = (2/3,1/3) • Starting Productivities (Cloth , Wine): England (1.0, 0.4) Portugal (0.4, 1.0) • Then Portugal Improves in Cloth, increasing from 0.4 to 0.7 to 1.0
  • 4. Portugal Cloth Productivity = 0.4 1.000 0.900 0.800 Portugal’s 0.700 0.600 0.500 0.400 0.300 0.200 Productivity 0.100 0.000 Utility Income Cloth Wine in Cloth 1.000 0.900 Portugal Cloth Productivity = 0.7 0.800 Improves 0.700 0.600 0.500 0.400 0.300 0.200 0.100 0.000 Utility Income Cloth Wine Effect on Portugal Cloth Productivity = 1.0 1.000 Portugal 0.900 0.800 0.700 0.600 0.500 0.400 0.300 0.200 0.100 0.000 Utility Income Cloth Wine
  • 5. 1.000 0.900 0.800 Portugal’s 0.700 0.600 0.500 0.400 0.300 0.200 Productivity 0.100 0.000 Utility Income Cloth Wine in Cloth 1.000 0.900 Improves 0.800 0.700 0.600 0.500 0.400 0.300 0.200 0.100 0.000 Utility Income Cloth Wine Effect on 1.000 England 0.900 0.800 0.700 0.600 0.500 0.400 0.300 0.200 0.100 0.000 Utility Income Cloth Wine
  • 6. Three More Equilibria -England England Consumption England Consumption 1.000 1.000 0.800 0.800 0.600 0.600 Trade Trade 0.400 0.400 0.200 0.200 0.000 0.000 Utility Income Cloth Wine Utility Income Cloth Wine England Consumption 1.000 0.800 0.600 Trade 0.400 0.200 0.000 Utility Income Cloth Wine
  • 7. Three More Equilibria - Portugal Portugal Consumption Portugal Consumption 1.000 1.000 0.900 0.900 0.800 0.800 0.700 0.700 0.600 0.600 0.500 Trade 0.500 Trade 0.400 0.400 0.300 0.300 0.200 0.200 0.100 0.100 0.000 0.000 Utility Income Cloth Wine Utility Income Cloth Wine Portugal Consumption 1.000 0.900 0.800 0.700 0.600 0.500 Trade 0.400 0.300 0.200 0.100 0.000 Utility Income Cloth Wine
  • 8. Point Pair Shows Equilibrium Income Share, and Utilities of Country 1 and Country 2 Utility  Income Diagram U 2 U 1 1 1 0 .2 .4 .6 .8 1 Z 1 Z1 is Country 1 Income
  • 9. Previous Equilibria Income  Utility Diagram U 2 U 1 1 1 0 .2 .4 .6 .8 1 Z 1
  • 10. More Equilibria Income  Utility Diagram U 2 U 1 1 1 Z C 0 .2 .4 .6 .8 1 Z 1
  • 11. Regions of Equilibria and Their Boundaries Income  Utility Diagram U 2 U 1 England Equilibia Boundary Portugal Equilibia Boundary 1 1 Z C 0 .2 .4 .6 .8 1 Z 1
  • 12. World Equilibria Boundary World Equilibia U 2 U 1 World Equilibia Boundary 1 1 Z C 0 .2 .4 .6 .8 1 Z 1
  • 13. Three Important Points Wine Cloth All Equilibria U 2 U 1 1 1 Z C 0 .2 .4 .6 .8 1 Z 1
  • 15. 11 Good Model 11 Industries U 2 U 1 1 1 Z C 0 .2 .4 .6 .8 1 Z 1