SlideShare una empresa de Scribd logo
1 de 5
MCKAY VALUATION BY FREE CASH FLOW AND ABNORMAL EARNINGS MODELS (FILE MCK.XLS)

                    A              B         C       D      E      F                           G           H             I        J      K       L      M                                N           O            P            Q            R            S             T
1                               TABLE 1. HISTORICAL INCOME STATEMENTS                                                 TABLE 5. FORECASTED INCOME STATEMENTS
2
3    Income statement                   -6          -5          -4          -3          -2          -1           0             1               2           3           4           5           6            7            8            9          10           11            12
4
5    Revenues                       197.6       222.3       272.3       299.5       350.0       418.9       505.4         598.6           690.6       768.2       846.7       924.4       999.7      1070.9       1136.1       1193.6       1229.4       1266.3       1304.3
6    Operating expenses            -175.4      -205.8      -249.6      -274.7      -320.5      -383.6      -467.4        -538.8          -621.5      -691.4      -762.0      -831.9      -899.7      -963.8      -1022.5      -1074.2      -1106.5      -1139.7      -1173.9
7    Depreciation                   -12.8         -9.3      -11.2       -13.0       -15.0       -17.7       -26.4         -28.7           -32.0       -36.6       -40.2       -43.8       -47.2        -50.4        -54.3        -57.9        -61.2        -63.3        -64.5
8                                    ------      ------      ------      ------      ------      ------      ------        ------          ------      ------      ------      ------      ------     -------      -------      -------      -------      -------      -------
9    Operating income                  9.4         7.2        11.5        11.8        14.5        17.6        11.6          31.1            37.1        40.3        44.4        48.6        52.7        56.7         59.3         61.5         61.8         63.3         65.9
10   Interest income                   0.0         0.0         0.0         0.0         0.9         0.7         0.6           0.0             0.0         0.0         0.0         0.0         0.0         0.0          0.0          0.0          0.0          0.0          0.0
11   Interest expense                 -0.1        -0.4        -0.8        -1.0        -3.4        -4.1      -10.1         -10.1           -10.2       -11.2       -11.9       -12.8       -13.7        -14.4        -15.3        -16.1        -16.8        -17.2        -17.5
12                                   ------      ------      ------      ------      ------      ------      ------        ------          ------      ------      ------      ------      ------     -------      -------      -------      -------      -------      -------
13   Earnings before taxes             9.3         6.8        10.7        10.8        12.0        14.2         2.1          21.0            26.9        29.0        32.5        35.8        39.1        42.3         44.0         45.3         45.0         46.2         48.4
14   Revaluation of deferred
15     income taxes                                                                                                        0.0              0.0         0.0         0.0         0.0         0.0          0.0          0.0          0.0          0.0          0.0          0.0
16   Income taxes                    -3.3        -2.4        -3.8        -4.2        -5.0        -6.1        -0.7         -8.2            -10.5       -11.3       -12.7       -14.0       -15.2        -16.5        -17.2        -17.7        -17.5        -18.0        -18.9
17                                  ------      ------      ------      ------      ------      ------      ------       ------           ------      ------      ------      ------      ------      -------      -------      -------      -------      -------      -------
18   Net income                       6.0         4.4         6.9         6.6         7.0         8.1         1.4         12.8             16.4        17.7        19.8        21.8        23.8         25.8         26.8         27.6         27.4         28.2         29.5
19                                ======      ======      ======      ======      ======      ======      ======       ======           ======      ======      ======      ======      ======      ======       ======       ======       ======       ======       ======
20
21   Statement of retained
22   earnings                           -6          -5          -4          -3          -2          -1           0             1               2           3           4           5           6            7            8            9          10           11            12
23
24   Beginning retained
25    earnings                                    62.5        63.7        65.8        68.6        69.8        74.0         72.5             85.3      101.7       115.7       126.0       135.5       143.9        153.7        162.4        169.5        173.0        176.5
26   Net income                                    4.4         6.9         6.6         7.0         8.1         1.4         12.8             16.4        17.7        19.8        21.8        23.8        25.8         26.8         27.6         27.4         28.2         29.5
27   Common dividends                             -3.2        -4.8        -3.8        -5.8        -3.9        -2.9          0.0              0.0        -3.7        -9.6      -12.4       -15.4        -15.9        -18.2        -20.5        -24.0        -24.6        -23.5
28                                               ------      ------      ------      ------      ------      ------       ------           ------      ------      ------      ------      ------     -------      -------      -------      -------      -------      -------
29   Ending retained earnings        62.5         63.7        65.8        68.6        69.8        74.0        72.5         85.3           101.7       115.7       126.0       135.5       143.9       153.7        162.4        169.5        173.0        176.5        182.5
30
31                              TABLE 2. HISTORICAL BALANCE SHEETS                                                    TABLE 6. FORECASTED BALANCE SHEETS
32
33                                      -6          -5          -4          -3          -2          -1           0             1               2           3           4           5           6            7            8            9          10           11            12
34
35   Operating cash                    4.0         4.4         5.4         6.0         6.0         8.4         10.1        11.7            13.5        15.0        16.6        18.1          19.6        21.0         22.2         23.4         24.1         24.8          25.5
36   Excess marketable
37     securities *                   10.9         3.0        20.5        10.3         0.0         5.8         0.0           0.0             0.0         0.0         0.0         0.0         0.0         0.0          0.0          0.0          0.0          0.0          0.0
38   Trade receivables                17.9        24.4        33.0        33.3        43.9        49.8        57.7          67.7            78.1        86.8        95.7      104.5       113.0       121.0        128.4        134.9        139.0        143.1        147.4
39   Other receivables                 1.5         2.0         2.7         2.7         6.2         4.9         5.7           6.5             7.5         8.4         9.2        10.1        10.9        11.7         12.4         13.0         13.4         13.8         14.2
40   Inventories                       1.9         2.1         2.8         2.5         9.0        10.9        11.9           9.5            10.9        12.2        13.4        14.7        15.8        17.0         18.0         18.9         19.5         20.1         20.7
41   Prepaid expenses                  4.3         5.1         5.3         6.0         2.4         4.4         5.0           9.5            11.0        12.2        13.5        14.7        15.9        17.1         18.1         19.0         19.6         20.2         20.8
42                                   ------      ------      ------      ------      ------      ------      ------        ------          ------      ------      ------      ------      ------     -------      -------      -------      -------      -------      -------
43   Current assets                   40.5        41.0        69.7        60.8        67.5        84.2        90.4        104.9           121.0       134.7       148.4       162.0       175.2       187.7        199.1        209.2        215.5        221.9        228.6
44
45   Gross property,
46    plant and equipment           100.0       117.7       128.2       155.6       204.7       272.5       297.6         334.2           378.9       417.7       454.9       489.8       521.4        555.8        586.6        613.0        630.4        645.6        664.9
47   Accumulated depreciation       -37.7       -42.3       -48.7       -56.5       -71.9       -86.9      -103.4        -121.8          -140.4      -159.5      -178.3      -196.5      -213.7       -229.4       -243.8       -256.4       -266.9       -275.0       -283.2
48                                   ------      ------      ------      ------      ------      ------      ------        ------          ------      ------      ------      ------      ------      -------      -------      -------      -------      -------      -------
49   Net property, plant
50    and equipment                   62.3        75.4        79.5        99.1      132.8       185.6       194.2         212.4           238.6       258.2       276.6       293.3       307.8       326.4        342.9        356.6        363.6        370.6        381.7
51                                   ------      ------      ------      ------      ------      ------      ------        ------          ------      ------      ------      ------      ------     -------      -------      -------      -------      -------      -------
52   Total assets                   102.8       116.4       149.2       159.9       200.3       269.8       284.6         317.4           359.6       392.8       425.0       455.3       483.0       514.1        542.0        565.8        579.0        592.6        610.4


                                                                                                                                    1
MCKAY VALUATION BY FREE CASH FLOW AND ABNORMAL EARNINGS MODELS (FILE MCK.XLS)

                    A                   B           C            D            E            F            G            H              I               J            K            L            M            N            O           P           Q           R           S           T
53                                     ======      ======       ======       ======       ======       ======       ======        ======           ======       ======       ======       ======       ======       ======      ======      ======      ======      ======      ======
54
55    Short-term debt                       0.3         0.8          0.9          1.5         11.5         12.5         20.7          19.0             19.4          21.7         22.8        24.7          26.2        27.7        29.4        30.9        32.2        32.7        33.5
56    Accounts payable                      7.3        11.0         11.9         10.5         14.2         16.2         18.9          23.7             27.3          30.4         33.5        36.6          39.6        42.4        45.0        47.3        48.7        50.1        51.6
57    Other current liabilities            13.9        13.5         18.2         18.5         21.4         27.8         28.8          38.0             43.8          48.7         53.7        58.7          63.4        68.0        72.1        75.7        78.0        80.4        82.8
58                                        ------      ------       ------       ------       ------       ------       ------        ------           ------        ------       ------      ------        ------     -------     -------     -------     -------     -------     -------
59    Total current liabilities            21.5        25.3         31.0         30.5         47.1         56.5         68.4          80.6             90.6        100.9        110.1       119.9         129.3       138.0       146.5       153.9       158.8       163.2       167.9
60
61    Long-term debt                        5.5        11.5         16.2         21.7         40.2         90.6         94.8          97.1            108.7        114.1        123.4       131.2         138.3       147.2       154.5       160.8       163.7       167.3       172.6
62
63    Deferred income taxes                 8.7        11.0         12.6         15.5         19.6         25.1         25.3          30.8             35.1         38.5         41.9         45.1         48.0         51.6        55.0        58.0        59.9        61.9        63.7
64
65    Common stock *                        4.6         4.9         23.6         23.6         23.6         23.6         23.6          23.6             23.6         23.6         23.6         23.6         23.6         23.6        23.6        23.6        23.6        23.6        23.6
66    Retained earnings                    62.5        63.7         65.8         68.6         69.8         74.0         72.5          85.3           101.7        115.7        126.0        135.5        143.9        153.7       162.4       169.5       173.0       176.5       182.5
67                                        ------      ------       ------       ------       ------       ------       ------        ------           ------       ------       ------       ------       ------      -------     -------     -------     -------     -------     -------
68    Total common equity                  67.1        68.6         89.4         92.2         93.4         97.6         96.1        108.9            125.3        139.3        149.6        159.1        167.5        177.3       186.0       193.1       196.6       200.1       206.1
69                                        ------      ------       ------       ------       ------       ------       ------        ------           ------       ------       ------       ------       ------      -------     -------     -------     -------     -------     -------
70    Total liabilities and equity       102.8       116.4        149.2        159.9        200.3        269.8        284.6         317.4            359.6        392.8        425.0        455.3        483.0        514.1       542.0       565.8       579.0       592.6       610.4
71                                     ======      ======       ======       ======       ======       ======       ======        ======           ======       ======       ======       ======       ======       ======      ======      ======      ======      ======      ======
72
73    Invested capital                     70.7        88.9         98.6        120.6        164.7        220.0        236.9         255.7            288.5        313.7        337.7        360.0        380.0        403.8       424.9       442.8       452.4       462.1       476.0
74    Debt/invested capital               8.2%       13.8%        17.3%        19.2%        31.4%        46.9%        48.8%         45.4%            44.4%        43.3%        43.3%        43.3%        43.3%        43.3%       43.3%       43.3%       43.3%       43.3%       43.3%
75    NOPLAT/invested capital
76      (ROIC)                                        8.7%         9.6%         9.2%         8.9%         8.1%         3.2%          9.9%             9.9%         9.3%         9.4%         9.4%         9.5%         9.8%        9.5%        9.3%        8.9%        8.9%        9.0%
77
78    * direct forecast
79
80                                   TABLE 3. HISTORICAL FREE CASH FLOW                                                          TABLE 7. FORECASTED FREE CASH FLOW
81
82    Free cash flow                                      -5           -4           -3           -2           -1            0             1                2            3            4            5            6           7           8           9          10          11          12
83
84    Revenues                                        222.3        272.3        299.5        350.0        418.9        505.4         598.6            690.6        768.2        846.7        924.4        999.7      1070.9      1136.1      1193.6      1229.4      1266.3      1304.3
85    Operating expenses                             -205.8       -249.6       -274.7       -320.5       -383.6       -467.4        -538.8           -621.5       -691.4       -762.0       -831.9       -899.7      -963.8     -1022.5     -1074.2     -1106.5     -1139.7     -1173.9
86    Depreciation                                      -9.3       -11.2        -13.0        -15.0        -17.7        -26.4         -28.7            -32.0        -36.6        -40.2        -43.8        -47.2        -50.4       -54.3       -57.9       -61.2       -63.3       -64.5
87                                                     ------       ------       ------       ------       ------       ------        ------           ------       ------       ------       ------       ------     -------     -------     -------     -------     -------     -------
88    EBIT                                               7.2         11.5         11.8         14.5         17.6         11.6          31.1             37.1         40.3         44.4         48.6         52.7        56.7        59.3        61.5        61.8        63.3        65.9
89    Taxes on EBIT                                     -2.6         -4.1         -4.6         -6.0         -7.4         -4.4        -12.1            -14.5        -15.7        -17.3        -19.0        -20.6        -22.1       -23.1       -24.0       -24.1       -24.7       -25.7
90    Revaluation of deferred
91     income taxes                                                                                                                     0.0              0.0          0.0          0.0          0.0          0.0         0.0         0.0         0.0         0.0         0.0         0.0
92    Change in deferred
93     income taxes                                     2.3          1.6          2.9          4.1          5.5          0.2           5.5              4.3          3.5          3.4          3.2          2.9          3.6         3.4         3.0         1.9         2.0         1.9
94                                                    ------       ------       ------       ------       ------       ------        ------           ------       ------       ------       ------       ------      -------     -------     -------     -------     -------     -------
95    NOPLAT                                            6.9          9.0         10.1         12.6         15.7          7.4          24.4             26.9         28.0         30.5         32.8         35.1         38.2        39.6        40.5        39.6        40.6        42.1
96    Add back depreciation                             9.3         11.2         13.0         15.0         17.7         26.4          28.7             32.0         36.6         40.2         43.8         47.2         50.4        54.3        57.9        61.2        63.3        64.5
97                                                    ------       ------       ------       ------       ------       ------        ------           ------       ------       ------       ------       ------      -------     -------     -------     -------     -------     -------
98    Gross cash flow                                  16.2         20.2         23.1         27.6         33.4         33.8          53.2             58.9         64.6         70.7         76.7         82.3         88.6        93.8        98.4      100.8       103.9       106.6
99
100   Change in working
101    capital (+ if increase)                           5.1          5.6          2.4        10.4           2.5          8.3           0.5              6.6          5.6          5.7          5.6          5.4         5.1         4.7         4.2         2.6         2.7         2.7
102   Capital expenditures
103    (+ if positive)                                 22.4         15.3         32.6         48.7         70.5         35.0          47.0             58.1         56.2         58.6         60.5         61.7         69.0        70.7        71.6        68.1        70.4        75.6
104                                                   ------       ------       ------       ------       ------       ------        ------           ------       ------       ------       ------       ------      -------     -------     -------     -------     -------     -------


                                                                                                                                               2
MCKAY VALUATION BY FREE CASH FLOW AND ABNORMAL EARNINGS MODELS (FILE MCK.XLS)

                  A                   B         C           D           E           F           G           H              I                 J             K           L             M           N           O           P           Q           R           S            T
105   Gross investment                            27.5        20.9        35.0        59.1        73.0        43.3          47.5               64.8          61.8        64.3          66.1        67.2         74.2        75.4        75.8        70.7        73.0        78.4
106                                              ------      ------      ------      ------      ------      ------        ------             ------        ------      ------        ------      ------      -------     -------     -------     -------     -------     -------
107   Free cash flow                             -11.3        -0.7       -11.9       -31.5       -39.6        -9.5           5.7               -5.9           2.8         6.4          10.5        15.1         14.4        18.4        22.6        30.1        30.9        28.2
108                                            ======      ======      ======      ======      ======      ======        ======             ======        ======      ======        ======      ======      ======      ======      ======      ======      ======      ======
109
110   Financial cash flow                            -5           -4         -3          -2          -1           0                1                 2           3             4           5           6           7           8           9          10          11           12
111
112   Incr(+)/Decr(-) in excess
113     marketable securities                       -7.9        17.5      -10.2       -10.3         5.8         -5.8             0.0               0.0         0.0           0.0          0.0         0.0         0.0         0.0         0.0         0.0         0.0          0.0
114   After-tax interest
115     income (-)                                  0.0          0.0        0.0         -0.5        -0.4        -0.4             0.0               0.0         0.0           0.0          0.0         0.0         0.0         0.0         0.0         0.0         0.0          0.0
116   Incr(-)/Decr(+) in short-
117     and long-term debt                          -6.5        -4.8        -6.1      -28.5       -51.4       -12.4             -0.5           -12.1           -7.7      -10.4           -9.7        -8.6      -10.3         -9.2        -7.7        -4.1        -4.2         -6.0
118   After-tax interest
119     expense (+)                                 0.2          0.5        0.6         2.1         2.5         6.2              6.2               6.2         6.9           7.3          7.8         8.3         8.8         9.4         9.8        10.3        10.5         10.7
120   Common dividends (+)                          3.2          4.8        3.8         5.8         3.9         2.9              0.0               0.0         3.7           9.6         12.4        15.4        15.9        18.2        20.5        24.0        24.6         23.5
121   Incr(-)/Decr(+) in
122     common stock                               -0.3       -18.7         0.0         0.0         0.0         0.0              0.0               0.0         0.0           0.0         0.0         0.0         0.0         0.0         0.0         0.0         0.0         0.0
123                                               ------      ------      ------      ------      ------      ------           ------            ------      ------        ------      ------      ------     -------     -------     -------     -------     -------     -------
124   Financial cash flow                         -11.3        -0.7       -11.9       -31.5       -39.6        -9.5              5.7              -5.9         2.8           6.4        10.5        15.1        14.4        18.4        22.6        30.1        30.9        28.2
125
126   Effective tax rate on EBIT                  3.6%      21.8%       14.3%       12.9%       10.9%       36.3%         21.5%              27.4%         30.4%       31.4%         32.5%       33.5%        32.6%       33.3%       34.1%       35.9%       35.9%       36.2%
127
128                                TABLE 4. HISTORICAL RATIOS FOR FORECAST ASSUMPTIONS                                 TABLE 8. FORECAST ASSUMPTIONS
129
130                                       -6         -5           -4         -3          -2          -1           0                1                 2           3             4           5           6           7           8           9          10          11           12
131
132   Operations
133    Real growth (g)                                                                                                    15.0%              12.0%          8.0%        7.0%           6.0%        5.0%        4.0%        3.0%        2.0%        0.0%        0.0%        0.0%
134    Inflation (i)                                                                                                       3.0%               3.0%          3.0%        3.0%           3.0%        3.0%        3.0%        3.0%        3.0%        3.0%        3.0%        3.0%
135    Revenue growth (c)                       12.5%       22.5%       10.0%       16.9%       19.7%       20.6%         18.5%              15.4%         11.2%       10.2%           9.2%        8.2%        7.1%        6.1%        5.1%        3.0%        3.0%        3.0%
136    Operating expenses/
137      revenues                     88.8%     92.6%       91.7%       91.7%       91.6%       91.6%       92.5%         90.0%              90.0%         90.0%       90.0%         90.0%       90.0%        90.0%       90.0%       90.0%       90.0%       90.0%       90.0%
138
139   Working capital
140    Operating cash/revenues         2.0%      2.0%        2.0%        2.0%        1.7%        2.0%        2.0%          2.0%               2.0%          2.0%        2.0%          2.0%        2.0%         2.0%        2.0%        2.0%        2.0%        2.0%        2.0%
141    Trade receiv's/revenues         9.1%     11.0%       12.1%       11.1%       12.5%       11.9%       11.4%         11.3%              11.3%         11.3%       11.3%         11.3%       11.3%        11.3%       11.3%       11.3%       11.3%       11.3%       11.3%
142    Other receiv's/revenues         0.8%      0.9%        1.0%        0.9%        1.8%        1.2%        1.1%          1.1%               1.1%          1.1%        1.1%          1.1%        1.1%         1.1%        1.1%        1.1%        1.1%        1.1%        1.1%
143    Invent's/operating exp's        1.1%      1.0%        1.1%        0.9%        2.8%        2.8%        2.5%          1.8%               1.8%          1.8%        1.8%          1.8%        1.8%         1.8%        1.8%        1.8%        1.8%        1.8%        1.8%
144    Prepaid exp's/revenues          2.2%      2.3%        1.9%        2.0%        0.7%        1.1%        1.0%          1.6%               1.6%          1.6%        1.6%          1.6%        1.6%         1.6%        1.6%        1.6%        1.6%        1.6%        1.6%
145    Accounts payable/
146      operating expenses            4.2%       5.3%        4.8%        3.8%        4.4%        4.2%        4.0%             4.4%            4.4%          4.4%        4.4%          4.4%        4.4%        4.4%        4.4%        4.4%        4.4%        4.4%        4.4%
147    Other curr liab's/rev's         7.0%       6.1%        6.7%        6.2%        6.1%        6.6%        5.7%             6.3%            6.3%          6.3%        6.3%          6.3%        6.3%        6.3%        6.3%        6.3%        6.3%        6.3%        6.3%
148
149   Property, Plant and
150   Equipment (PPE)
151     PPE economic life (n)                                                                                                                                                                                                                                    10
152     F_sub_g (see Sect 6)                                                                                                                                                                                                                                10.0000
153     F_sub_c (see Sect 6)                                                                                                                                                                                                                                 8.7861
154     Real PPE/rev's (K)                                                                                                                                                                                                                                    0.580
155     M (see Section 6)                                                                                                                                                                                                                                     0.510
156     H (see Section 6)                                                                                                                                                                                                                                     0.426


                                                                                                                                        3
MCKAY VALUATION BY FREE CASH FLOW AND ABNORMAL EARNINGS MODELS (FILE MCK.XLS)

                   A                 B       C       D       E       F       G       H          I             J         K            L          M           N         O          P        Q         R           S          T
157    Net PPE/revenues              31.5%   33.9%   29.2%   33.1%   37.9%   44.3%   38.4%      35.5%         34.5%     33.6%        32.7%      31.7%       30.8%     30.5%      30.2%    29.9%     29.6%       29.3%      29.3%
158    Depreciation/net PPE *                14.9%   14.9%   16.4%   15.1%   13.3%   14.2%      14.8%         15.1%     15.3%        15.6%      15.8%       16.1%     16.4%      16.6%    16.9%     17.2%       17.4%      17.4%
159    Retirements/net PPE *                  7.5%    6.4%    6.5%   -0.4%    2.0%    5.3%        5.3%         6.3%      7.3%         8.3%       9.3%       10.3%     11.2%      12.2%    13.2%     14.2%       15.2%      15.2%
160    Net PPE/revenues curve
161      parameter (α)                                                                                                                                                                                        -0.00319
162    Inflation factors                                                                        1.344         1.305     1.267         1.230      1.194      1.159      1.126     1.093     1.061     1.030        1.000
163    Resulting real gross PPE                                                                                                                                                                                Err:508
164    Required real gross PPE                                                                                                                                                                                    734.4
165    Drive to 0 by Goal Seek                                                                 Err:508
166      (vary S161)!
167
168   Taxes
169    Tax rate                      39.0%   39.0%   39.0%   39.0%   39.0%   39.0%   39.0%      39.0%         39.0%     39.0%        39.0%      39.0%       39.0%      39.0%     39.0%     39.0%     39.0%      39.0%      39.0%
170    PPE tax life (q)                                                                                                                                                                                              5
171    J (see Section 8)                                                                                                                                                                                         2.160
172    Timing diff's/net PPE         35.8%   37.4%   40.6%   40.1%   37.8%   34.7%   33.4%      37.1%         37.7%     38.3%        38.8%      39.4%       40.0%      40.5%     41.1%     41.7%     42.2%      42.8%      42.8%
173
174   Interest rate items
175     Real borrowing rate                                                                     5.60%         5.60%     5.60%        5.60%      5.60%       5.60%      5.60%     5.60%     5.60%     5.60%      5.60%      5.60%
176     Nominal borrowing rate                                                                  8.77%         8.77%     8.77%        8.77%      8.77%       8.77%      8.77%     8.77%     8.77%     8.77%      8.77%      8.77%
177     Real cost of equity                                                                    11.40%        11.40%    11.40%       11.40%     11.40%      11.40%     11.40%    11.40%    11.40%    11.40%     11.40%     11.40%
178     Nominal cost of equity                                                                 14.74%        14.74%    14.74%       14.74%     14.74%      14.74%     14.74%    14.74%    14.74%    14.74%     14.74%     14.74%
179
180   Book value target for
181    financial strength                                                                       56.7%         56.7%     56.7%        56.7%      56.7%       56.7%      56.7%     56.7%     56.7%     56.7%      56.7%      56.7%
182
183   This year's short-term/last
184    year's long-term debt                                                                    20.0%         20.0%     20.0%        20.0%      20.0%       20.0%      20.0%     20.0%     20.0%     20.0%      20.0%      20.0%
185
186   * last year's net PPE
187
188                                                                                          VALUE CALCULATIONS                  Macro shortcut: Ctrl+Shift+G
189
190                                                                                                 1             2         3             4          5           6         7         8         9        10          11        12
191
192   1. Free Cash Flow
193
194   Excess marketable
195     securities (at year start)                                                                 0.0           0.0       0.0          0.0         0.0         0.0       0.0       0.0       0.0       0.0        0.0        0.0
196   Interest-bearing debt
197     (at year start)                                                                          115.5         116.0     128.1        135.8      146.2       155.9      164.5     174.8     184.0     191.7      195.9      200.1
198   Free cash fl (at year end)                                                                   5.7          -5.9       2.8          6.4       10.5        15.1       14.4      18.4      22.6      30.1       30.9       28.2
199   WACC                                                                                     10.05%        10.05%    10.05%       10.05%     10.05%      10.05%     10.05%    10.05%    10.05%    10.05%     10.05%     10.05%
200   Computed value of oper
201     assets (at year start)                                                                  209.3         224.6     253.0         275.6      296.9      316.2      332.9     351.9     368.8     383.3       391.7     400.2
202   Computed equity value
203     (at year start)                                                                           93.8        108.6     124.9         139.8      150.7      160.3      168.3     177.0     184.8     191.5       195.8     200.1
204   Computed equity value at
205     the start of year 1 inclu-
206     ding dividends at the
207     end of year 0                                                                             96.7
208


                                                                                                         4
MCKAY VALUATION BY FREE CASH FLOW AND ABNORMAL EARNINGS MODELS (FILE MCK.XLS)

                    A             B   C    D     E     F     G    H      I             J           K           L          M         N         O          P          Q          R           S           T
209   Desired E/(D+E) year 12                                            50.0%
210   Result E/(D+E) year 12                                             50.0%
211   Result E/(D+E) all years                                           44.8%         48.3%       49.4%       50.7%       50.8%     50.7%     50.6%     50.3%       50.1%      50.0%      50.0%       50.0%
212   Drive to 0 by Goal Seek
213    (vary year 1 Book value
214    target for financial
215    strength I181)!
216
217   2. Abnormal Earnings
218
219   Interest-bearing debt
220     (at year start)                                                  115.5         116.0       128.1       135.8       146.2     155.9     164.5     174.8       184.0      191.7      195.9       200.1
221   Book equity value
222     (at year start)                                                    96.1         108.9       125.3       139.3       149.6     159.1     167.5     177.3       186.0      193.1      196.6       200.1
223   Net income (at year end)                                             12.8          16.4        17.7        19.8        21.8      23.8      25.8      26.8        27.6       27.4       28.2        29.5
224   Cost of equity                                                    14.74%        14.74%      14.74%      14.74%      14.74%    14.74%    14.74%    14.74%      14.74%     14.74%     14.74%      14.74%
225   Abnormal earnings                                                    -1.4           0.3        -0.8        -0.7        -0.2       0.4       1.1       0.7         0.2       -1.0       -0.8         0.0
226   Computed value of abn
227    earnings (at year start)                                            -1.5            -0.4        -0.8        -0.1       0.6       0.9       0.6        -0.4       -1.2       -1.6        -0.8        -0.1
228   Computed equity value
229     (at year start)                                                    94.6        108.5       124.5       139.2       150.2     159.9     168.1     176.9       184.8      191.5      195.8       200.1
230
231   Desired E/(D+E) year 12                                            50.0%
232   Result E/(D+E) year 12                                             50.0%
233   Result E/(D+E) all years                                           45.0%         48.3%       49.3%       50.6%       50.7%     50.6%     50.5%     50.3%       50.1%      50.0%      50.0%       50.0%
234   Drive to 0 by Goal Seek
235    (vary year 1 Book value
236    target for financial
237    strength I181)!


                                                                                  5

Más contenido relacionado

La actualidad más candente

Meridian golden heartland-ks
Meridian   golden heartland-ksMeridian   golden heartland-ks
Meridian golden heartland-kskrgc
 
qwest communications Historical Quarterly Results1Q 06_3Q08
qwest communications Historical Quarterly Results1Q 06_3Q08qwest communications Historical Quarterly Results1Q 06_3Q08
qwest communications Historical Quarterly Results1Q 06_3Q08finance19
 
dominion resources GAAP Reconciliations and Footnotes
dominion resources GAAP Reconciliations and Footnotesdominion resources GAAP Reconciliations and Footnotes
dominion resources GAAP Reconciliations and Footnotesfinance17
 
yrc worldwide4Q07_Release
yrc worldwide4Q07_Releaseyrc worldwide4Q07_Release
yrc worldwide4Q07_Releasefinance41
 
Muthengi mike bamburi financial model - enhancement
Muthengi mike   bamburi financial model - enhancementMuthengi mike   bamburi financial model - enhancement
Muthengi mike bamburi financial model - enhancementMike Muthengi
 
itw confrencecall-Q12006 Original
itw confrencecall-Q12006 Originalitw confrencecall-Q12006 Original
itw confrencecall-Q12006 Originalfinance16
 
qwest communications Q_1q08_profile_v2
qwest communications Q_1q08_profile_v2qwest communications Q_1q08_profile_v2
qwest communications Q_1q08_profile_v2finance19
 
Gastos personal y administrativo de Comisión Interventora en Banco Nuevo Mund...
Gastos personal y administrativo de Comisión Interventora en Banco Nuevo Mund...Gastos personal y administrativo de Comisión Interventora en Banco Nuevo Mund...
Gastos personal y administrativo de Comisión Interventora en Banco Nuevo Mund...gonzaloromani
 
Sales and Marketing Executive Dashboard
Sales and Marketing Executive DashboardSales and Marketing Executive Dashboard
Sales and Marketing Executive DashboardDemand Metric
 
qwest communications Q_2Q07_histres
qwest communications Q_2Q07_histresqwest communications Q_2Q07_histres
qwest communications Q_2Q07_histresfinance19
 

La actualidad más candente (15)

Financial Statements
Financial StatementsFinancial Statements
Financial Statements
 
Meridian golden heartland-ks
Meridian   golden heartland-ksMeridian   golden heartland-ks
Meridian golden heartland-ks
 
qwest communications Historical Quarterly Results1Q 06_3Q08
qwest communications Historical Quarterly Results1Q 06_3Q08qwest communications Historical Quarterly Results1Q 06_3Q08
qwest communications Historical Quarterly Results1Q 06_3Q08
 
dominion resources GAAP Reconciliations and Footnotes
dominion resources GAAP Reconciliations and Footnotesdominion resources GAAP Reconciliations and Footnotes
dominion resources GAAP Reconciliations and Footnotes
 
yrc worldwide4Q07_Release
yrc worldwide4Q07_Releaseyrc worldwide4Q07_Release
yrc worldwide4Q07_Release
 
Muthengi mike bamburi financial model - enhancement
Muthengi mike   bamburi financial model - enhancementMuthengi mike   bamburi financial model - enhancement
Muthengi mike bamburi financial model - enhancement
 
itw confrencecall-Q12006 Original
itw confrencecall-Q12006 Originalitw confrencecall-Q12006 Original
itw confrencecall-Q12006 Original
 
qwest communications Q_1q08_profile_v2
qwest communications Q_1q08_profile_v2qwest communications Q_1q08_profile_v2
qwest communications Q_1q08_profile_v2
 
Telenor Financial statment
Telenor Financial statmentTelenor Financial statment
Telenor Financial statment
 
Gastos personal y administrativo de Comisión Interventora en Banco Nuevo Mund...
Gastos personal y administrativo de Comisión Interventora en Banco Nuevo Mund...Gastos personal y administrativo de Comisión Interventora en Banco Nuevo Mund...
Gastos personal y administrativo de Comisión Interventora en Banco Nuevo Mund...
 
credit-suisse Supplements
credit-suisse  Supplementscredit-suisse  Supplements
credit-suisse Supplements
 
Sales and Marketing Executive Dashboard
Sales and Marketing Executive DashboardSales and Marketing Executive Dashboard
Sales and Marketing Executive Dashboard
 
ITW_Q306
ITW_Q306ITW_Q306
ITW_Q306
 
qwest communications Q_2Q07_histres
qwest communications Q_2Q07_histresqwest communications Q_2Q07_histres
qwest communications Q_2Q07_histres
 
proforma sample
proforma sampleproforma sample
proforma sample
 

Similar a Mck valuation sprdsheet

Shankaraiah N: Project Doc
Shankaraiah N: Project  DocShankaraiah N: Project  Doc
Shankaraiah N: Project Docshankaraiah, N
 
thermo fisher ReconciliationFinancialInfoQ32008
thermo fisher ReconciliationFinancialInfoQ32008thermo fisher ReconciliationFinancialInfoQ32008
thermo fisher ReconciliationFinancialInfoQ32008finance40
 
thermo fisher 02CD4A18-7BC2-44BB-869A-463BE382B07C_ReconciliationofFinancial...
thermo fisher  02CD4A18-7BC2-44BB-869A-463BE382B07C_ReconciliationofFinancial...thermo fisher  02CD4A18-7BC2-44BB-869A-463BE382B07C_ReconciliationofFinancial...
thermo fisher 02CD4A18-7BC2-44BB-869A-463BE382B07C_ReconciliationofFinancial...finance40
 
thermo fisher 02CD4A18-7BC2-44BB-869A-463BE382B07C_ReconciliationofFinancialI...
thermo fisher 02CD4A18-7BC2-44BB-869A-463BE382B07C_ReconciliationofFinancialI...thermo fisher 02CD4A18-7BC2-44BB-869A-463BE382B07C_ReconciliationofFinancialI...
thermo fisher 02CD4A18-7BC2-44BB-869A-463BE382B07C_ReconciliationofFinancialI...finance40
 
Financial_analysis_CTc
Financial_analysis_CTcFinancial_analysis_CTc
Financial_analysis_CTcJan Zika
 
Anthem Southeast Historical Data
Anthem Southeast Historical DataAnthem Southeast Historical Data
Anthem Southeast Historical Datafinance4
 
AXA Poland non life insurance companies
AXA Poland non life insurance companiesAXA Poland non life insurance companies
AXA Poland non life insurance companiesZbigniew Borys
 
Axa poland non life insurance
Axa poland non life insuranceAxa poland non life insurance
Axa poland non life insuranceZbigniew Borys
 
AXA Poland non life insurance companies
AXA Poland non life insurance companiesAXA Poland non life insurance companies
AXA Poland non life insurance companiesZbigniew Borys
 
Netscape IPO - Harvard Business Case
Netscape IPO - Harvard Business CaseNetscape IPO - Harvard Business Case
Netscape IPO - Harvard Business CaseKivanc Ozuolmez
 
bed bath&beyond AnnualReport2006
bed bath&beyond AnnualReport2006bed bath&beyond AnnualReport2006
bed bath&beyond AnnualReport2006finance44
 
bed bath&beyond AnnualReport2006
bed bath&beyond AnnualReport2006bed bath&beyond AnnualReport2006
bed bath&beyond AnnualReport2006finance44
 
(External ) macro economics(me 2)
(External ) macro economics(me 2)(External ) macro economics(me 2)
(External ) macro economics(me 2)kumarparouha
 

Similar a Mck valuation sprdsheet (20)

Shankaraiah N: Project Doc
Shankaraiah N: Project  DocShankaraiah N: Project  Doc
Shankaraiah N: Project Doc
 
thermo fisher ReconciliationFinancialInfoQ32008
thermo fisher ReconciliationFinancialInfoQ32008thermo fisher ReconciliationFinancialInfoQ32008
thermo fisher ReconciliationFinancialInfoQ32008
 
thermo fisher 02CD4A18-7BC2-44BB-869A-463BE382B07C_ReconciliationofFinancial...
thermo fisher  02CD4A18-7BC2-44BB-869A-463BE382B07C_ReconciliationofFinancial...thermo fisher  02CD4A18-7BC2-44BB-869A-463BE382B07C_ReconciliationofFinancial...
thermo fisher 02CD4A18-7BC2-44BB-869A-463BE382B07C_ReconciliationofFinancial...
 
thermo fisher 02CD4A18-7BC2-44BB-869A-463BE382B07C_ReconciliationofFinancialI...
thermo fisher 02CD4A18-7BC2-44BB-869A-463BE382B07C_ReconciliationofFinancialI...thermo fisher 02CD4A18-7BC2-44BB-869A-463BE382B07C_ReconciliationofFinancialI...
thermo fisher 02CD4A18-7BC2-44BB-869A-463BE382B07C_ReconciliationofFinancialI...
 
thermo fisher 02CD4A18-7BC2-44BB-869A-463BE382B07C_ReconciliationofFinancialI...
thermo fisher 02CD4A18-7BC2-44BB-869A-463BE382B07C_ReconciliationofFinancialI...thermo fisher 02CD4A18-7BC2-44BB-869A-463BE382B07C_ReconciliationofFinancialI...
thermo fisher 02CD4A18-7BC2-44BB-869A-463BE382B07C_ReconciliationofFinancialI...
 
Financial_analysis_CTc
Financial_analysis_CTcFinancial_analysis_CTc
Financial_analysis_CTc
 
2Q11 Earnings Release
2Q11 Earnings Release2Q11 Earnings Release
2Q11 Earnings Release
 
Anthem Southeast Historical Data
Anthem Southeast Historical DataAnthem Southeast Historical Data
Anthem Southeast Historical Data
 
Presentation 2Q12
Presentation 2Q12Presentation 2Q12
Presentation 2Q12
 
AXA Poland non life insurance companies
AXA Poland non life insurance companiesAXA Poland non life insurance companies
AXA Poland non life insurance companies
 
Axa poland non life insurance
Axa poland non life insuranceAxa poland non life insurance
Axa poland non life insurance
 
AXA Poland non life insurance companies
AXA Poland non life insurance companiesAXA Poland non life insurance companies
AXA Poland non life insurance companies
 
Anu Pinkerton
Anu PinkertonAnu Pinkerton
Anu Pinkerton
 
Netscape IPO - Harvard Business Case
Netscape IPO - Harvard Business CaseNetscape IPO - Harvard Business Case
Netscape IPO - Harvard Business Case
 
Presentation 3Q12
Presentation 3Q12Presentation 3Q12
Presentation 3Q12
 
Wmt Model Template
Wmt Model TemplateWmt Model Template
Wmt Model Template
 
bed bath&beyond AnnualReport2006
bed bath&beyond AnnualReport2006bed bath&beyond AnnualReport2006
bed bath&beyond AnnualReport2006
 
bed bath&beyond AnnualReport2006
bed bath&beyond AnnualReport2006bed bath&beyond AnnualReport2006
bed bath&beyond AnnualReport2006
 
(External ) macro economics(me 2)
(External ) macro economics(me 2)(External ) macro economics(me 2)
(External ) macro economics(me 2)
 

Más de iipmff2

Stocks price
Stocks priceStocks price
Stocks priceiipmff2
 
Statistics
StatisticsStatistics
Statisticsiipmff2
 
Statistical calculation sample
Statistical calculation   sampleStatistical calculation   sample
Statistical calculation sampleiipmff2
 
Solver 1
Solver 1Solver 1
Solver 1iipmff2
 
Sharp portfolio optimiser
Sharp portfolio optimiserSharp portfolio optimiser
Sharp portfolio optimiseriipmff2
 
Riskfree lending and borrowing
Riskfree lending and borrowingRiskfree lending and borrowing
Riskfree lending and borrowingiipmff2
 
Residual
ResidualResidual
Residualiipmff2
 
Portfolio evaluation
Portfolio evaluationPortfolio evaluation
Portfolio evaluationiipmff2
 
Mckinsey tutorial on valuations
Mckinsey tutorial on valuationsMckinsey tutorial on valuations
Mckinsey tutorial on valuationsiipmff2
 
Market model calculation
Market model calculationMarket model calculation
Market model calculationiipmff2
 
Calculation of beta
Calculation of betaCalculation of beta
Calculation of betaiipmff2
 
Iipm chapter 1
Iipm chapter 1Iipm chapter 1
Iipm chapter 1iipmff2
 
Iipm chapter 3
Iipm chapter 3Iipm chapter 3
Iipm chapter 3iipmff2
 
Iipm chapter 1
Iipm chapter 1Iipm chapter 1
Iipm chapter 1iipmff2
 
Financial functions
Financial functionsFinancial functions
Financial functionsiipmff2
 
Financial functions
Financial functionsFinancial functions
Financial functionsiipmff2
 
Advanced functions
Advanced functionsAdvanced functions
Advanced functionsiipmff2
 
Sustainable competitive advantage cs & notes toyota cs
Sustainable competitive advantage cs & notes toyota csSustainable competitive advantage cs & notes toyota cs
Sustainable competitive advantage cs & notes toyota csiipmff2
 
Small business comp adv
Small business comp advSmall business comp adv
Small business comp adviipmff2
 

Más de iipmff2 (20)

Stocks price
Stocks priceStocks price
Stocks price
 
Statistics
StatisticsStatistics
Statistics
 
Statistical calculation sample
Statistical calculation   sampleStatistical calculation   sample
Statistical calculation sample
 
Solver 1
Solver 1Solver 1
Solver 1
 
Sharp portfolio optimiser
Sharp portfolio optimiserSharp portfolio optimiser
Sharp portfolio optimiser
 
Riskfree lending and borrowing
Riskfree lending and borrowingRiskfree lending and borrowing
Riskfree lending and borrowing
 
Residual
ResidualResidual
Residual
 
Portfolio evaluation
Portfolio evaluationPortfolio evaluation
Portfolio evaluation
 
Pm
PmPm
Pm
 
Mckinsey tutorial on valuations
Mckinsey tutorial on valuationsMckinsey tutorial on valuations
Mckinsey tutorial on valuations
 
Market model calculation
Market model calculationMarket model calculation
Market model calculation
 
Calculation of beta
Calculation of betaCalculation of beta
Calculation of beta
 
Iipm chapter 1
Iipm chapter 1Iipm chapter 1
Iipm chapter 1
 
Iipm chapter 3
Iipm chapter 3Iipm chapter 3
Iipm chapter 3
 
Iipm chapter 1
Iipm chapter 1Iipm chapter 1
Iipm chapter 1
 
Financial functions
Financial functionsFinancial functions
Financial functions
 
Financial functions
Financial functionsFinancial functions
Financial functions
 
Advanced functions
Advanced functionsAdvanced functions
Advanced functions
 
Sustainable competitive advantage cs & notes toyota cs
Sustainable competitive advantage cs & notes toyota csSustainable competitive advantage cs & notes toyota cs
Sustainable competitive advantage cs & notes toyota cs
 
Small business comp adv
Small business comp advSmall business comp adv
Small business comp adv
 

Mck valuation sprdsheet

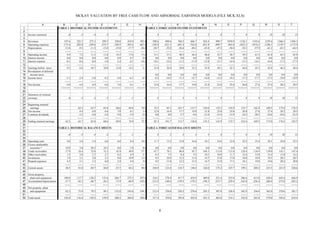
  • 1. MCKAY VALUATION BY FREE CASH FLOW AND ABNORMAL EARNINGS MODELS (FILE MCK.XLS) A B C D E F G H I J K L M N O P Q R S T 1 TABLE 1. HISTORICAL INCOME STATEMENTS TABLE 5. FORECASTED INCOME STATEMENTS 2 3 Income statement -6 -5 -4 -3 -2 -1 0 1 2 3 4 5 6 7 8 9 10 11 12 4 5 Revenues 197.6 222.3 272.3 299.5 350.0 418.9 505.4 598.6 690.6 768.2 846.7 924.4 999.7 1070.9 1136.1 1193.6 1229.4 1266.3 1304.3 6 Operating expenses -175.4 -205.8 -249.6 -274.7 -320.5 -383.6 -467.4 -538.8 -621.5 -691.4 -762.0 -831.9 -899.7 -963.8 -1022.5 -1074.2 -1106.5 -1139.7 -1173.9 7 Depreciation -12.8 -9.3 -11.2 -13.0 -15.0 -17.7 -26.4 -28.7 -32.0 -36.6 -40.2 -43.8 -47.2 -50.4 -54.3 -57.9 -61.2 -63.3 -64.5 8 ------ ------ ------ ------ ------ ------ ------ ------ ------ ------ ------ ------ ------ ------- ------- ------- ------- ------- ------- 9 Operating income 9.4 7.2 11.5 11.8 14.5 17.6 11.6 31.1 37.1 40.3 44.4 48.6 52.7 56.7 59.3 61.5 61.8 63.3 65.9 10 Interest income 0.0 0.0 0.0 0.0 0.9 0.7 0.6 0.0 0.0 0.0 0.0 0.0 0.0 0.0 0.0 0.0 0.0 0.0 0.0 11 Interest expense -0.1 -0.4 -0.8 -1.0 -3.4 -4.1 -10.1 -10.1 -10.2 -11.2 -11.9 -12.8 -13.7 -14.4 -15.3 -16.1 -16.8 -17.2 -17.5 12 ------ ------ ------ ------ ------ ------ ------ ------ ------ ------ ------ ------ ------ ------- ------- ------- ------- ------- ------- 13 Earnings before taxes 9.3 6.8 10.7 10.8 12.0 14.2 2.1 21.0 26.9 29.0 32.5 35.8 39.1 42.3 44.0 45.3 45.0 46.2 48.4 14 Revaluation of deferred 15 income taxes 0.0 0.0 0.0 0.0 0.0 0.0 0.0 0.0 0.0 0.0 0.0 0.0 16 Income taxes -3.3 -2.4 -3.8 -4.2 -5.0 -6.1 -0.7 -8.2 -10.5 -11.3 -12.7 -14.0 -15.2 -16.5 -17.2 -17.7 -17.5 -18.0 -18.9 17 ------ ------ ------ ------ ------ ------ ------ ------ ------ ------ ------ ------ ------ ------- ------- ------- ------- ------- ------- 18 Net income 6.0 4.4 6.9 6.6 7.0 8.1 1.4 12.8 16.4 17.7 19.8 21.8 23.8 25.8 26.8 27.6 27.4 28.2 29.5 19 ====== ====== ====== ====== ====== ====== ====== ====== ====== ====== ====== ====== ====== ====== ====== ====== ====== ====== ====== 20 21 Statement of retained 22 earnings -6 -5 -4 -3 -2 -1 0 1 2 3 4 5 6 7 8 9 10 11 12 23 24 Beginning retained 25 earnings 62.5 63.7 65.8 68.6 69.8 74.0 72.5 85.3 101.7 115.7 126.0 135.5 143.9 153.7 162.4 169.5 173.0 176.5 26 Net income 4.4 6.9 6.6 7.0 8.1 1.4 12.8 16.4 17.7 19.8 21.8 23.8 25.8 26.8 27.6 27.4 28.2 29.5 27 Common dividends -3.2 -4.8 -3.8 -5.8 -3.9 -2.9 0.0 0.0 -3.7 -9.6 -12.4 -15.4 -15.9 -18.2 -20.5 -24.0 -24.6 -23.5 28 ------ ------ ------ ------ ------ ------ ------ ------ ------ ------ ------ ------ ------- ------- ------- ------- ------- ------- 29 Ending retained earnings 62.5 63.7 65.8 68.6 69.8 74.0 72.5 85.3 101.7 115.7 126.0 135.5 143.9 153.7 162.4 169.5 173.0 176.5 182.5 30 31 TABLE 2. HISTORICAL BALANCE SHEETS TABLE 6. FORECASTED BALANCE SHEETS 32 33 -6 -5 -4 -3 -2 -1 0 1 2 3 4 5 6 7 8 9 10 11 12 34 35 Operating cash 4.0 4.4 5.4 6.0 6.0 8.4 10.1 11.7 13.5 15.0 16.6 18.1 19.6 21.0 22.2 23.4 24.1 24.8 25.5 36 Excess marketable 37 securities * 10.9 3.0 20.5 10.3 0.0 5.8 0.0 0.0 0.0 0.0 0.0 0.0 0.0 0.0 0.0 0.0 0.0 0.0 0.0 38 Trade receivables 17.9 24.4 33.0 33.3 43.9 49.8 57.7 67.7 78.1 86.8 95.7 104.5 113.0 121.0 128.4 134.9 139.0 143.1 147.4 39 Other receivables 1.5 2.0 2.7 2.7 6.2 4.9 5.7 6.5 7.5 8.4 9.2 10.1 10.9 11.7 12.4 13.0 13.4 13.8 14.2 40 Inventories 1.9 2.1 2.8 2.5 9.0 10.9 11.9 9.5 10.9 12.2 13.4 14.7 15.8 17.0 18.0 18.9 19.5 20.1 20.7 41 Prepaid expenses 4.3 5.1 5.3 6.0 2.4 4.4 5.0 9.5 11.0 12.2 13.5 14.7 15.9 17.1 18.1 19.0 19.6 20.2 20.8 42 ------ ------ ------ ------ ------ ------ ------ ------ ------ ------ ------ ------ ------ ------- ------- ------- ------- ------- ------- 43 Current assets 40.5 41.0 69.7 60.8 67.5 84.2 90.4 104.9 121.0 134.7 148.4 162.0 175.2 187.7 199.1 209.2 215.5 221.9 228.6 44 45 Gross property, 46 plant and equipment 100.0 117.7 128.2 155.6 204.7 272.5 297.6 334.2 378.9 417.7 454.9 489.8 521.4 555.8 586.6 613.0 630.4 645.6 664.9 47 Accumulated depreciation -37.7 -42.3 -48.7 -56.5 -71.9 -86.9 -103.4 -121.8 -140.4 -159.5 -178.3 -196.5 -213.7 -229.4 -243.8 -256.4 -266.9 -275.0 -283.2 48 ------ ------ ------ ------ ------ ------ ------ ------ ------ ------ ------ ------ ------ ------- ------- ------- ------- ------- ------- 49 Net property, plant 50 and equipment 62.3 75.4 79.5 99.1 132.8 185.6 194.2 212.4 238.6 258.2 276.6 293.3 307.8 326.4 342.9 356.6 363.6 370.6 381.7 51 ------ ------ ------ ------ ------ ------ ------ ------ ------ ------ ------ ------ ------ ------- ------- ------- ------- ------- ------- 52 Total assets 102.8 116.4 149.2 159.9 200.3 269.8 284.6 317.4 359.6 392.8 425.0 455.3 483.0 514.1 542.0 565.8 579.0 592.6 610.4 1
  • 2. MCKAY VALUATION BY FREE CASH FLOW AND ABNORMAL EARNINGS MODELS (FILE MCK.XLS) A B C D E F G H I J K L M N O P Q R S T 53 ====== ====== ====== ====== ====== ====== ====== ====== ====== ====== ====== ====== ====== ====== ====== ====== ====== ====== ====== 54 55 Short-term debt 0.3 0.8 0.9 1.5 11.5 12.5 20.7 19.0 19.4 21.7 22.8 24.7 26.2 27.7 29.4 30.9 32.2 32.7 33.5 56 Accounts payable 7.3 11.0 11.9 10.5 14.2 16.2 18.9 23.7 27.3 30.4 33.5 36.6 39.6 42.4 45.0 47.3 48.7 50.1 51.6 57 Other current liabilities 13.9 13.5 18.2 18.5 21.4 27.8 28.8 38.0 43.8 48.7 53.7 58.7 63.4 68.0 72.1 75.7 78.0 80.4 82.8 58 ------ ------ ------ ------ ------ ------ ------ ------ ------ ------ ------ ------ ------ ------- ------- ------- ------- ------- ------- 59 Total current liabilities 21.5 25.3 31.0 30.5 47.1 56.5 68.4 80.6 90.6 100.9 110.1 119.9 129.3 138.0 146.5 153.9 158.8 163.2 167.9 60 61 Long-term debt 5.5 11.5 16.2 21.7 40.2 90.6 94.8 97.1 108.7 114.1 123.4 131.2 138.3 147.2 154.5 160.8 163.7 167.3 172.6 62 63 Deferred income taxes 8.7 11.0 12.6 15.5 19.6 25.1 25.3 30.8 35.1 38.5 41.9 45.1 48.0 51.6 55.0 58.0 59.9 61.9 63.7 64 65 Common stock * 4.6 4.9 23.6 23.6 23.6 23.6 23.6 23.6 23.6 23.6 23.6 23.6 23.6 23.6 23.6 23.6 23.6 23.6 23.6 66 Retained earnings 62.5 63.7 65.8 68.6 69.8 74.0 72.5 85.3 101.7 115.7 126.0 135.5 143.9 153.7 162.4 169.5 173.0 176.5 182.5 67 ------ ------ ------ ------ ------ ------ ------ ------ ------ ------ ------ ------ ------ ------- ------- ------- ------- ------- ------- 68 Total common equity 67.1 68.6 89.4 92.2 93.4 97.6 96.1 108.9 125.3 139.3 149.6 159.1 167.5 177.3 186.0 193.1 196.6 200.1 206.1 69 ------ ------ ------ ------ ------ ------ ------ ------ ------ ------ ------ ------ ------ ------- ------- ------- ------- ------- ------- 70 Total liabilities and equity 102.8 116.4 149.2 159.9 200.3 269.8 284.6 317.4 359.6 392.8 425.0 455.3 483.0 514.1 542.0 565.8 579.0 592.6 610.4 71 ====== ====== ====== ====== ====== ====== ====== ====== ====== ====== ====== ====== ====== ====== ====== ====== ====== ====== ====== 72 73 Invested capital 70.7 88.9 98.6 120.6 164.7 220.0 236.9 255.7 288.5 313.7 337.7 360.0 380.0 403.8 424.9 442.8 452.4 462.1 476.0 74 Debt/invested capital 8.2% 13.8% 17.3% 19.2% 31.4% 46.9% 48.8% 45.4% 44.4% 43.3% 43.3% 43.3% 43.3% 43.3% 43.3% 43.3% 43.3% 43.3% 43.3% 75 NOPLAT/invested capital 76 (ROIC) 8.7% 9.6% 9.2% 8.9% 8.1% 3.2% 9.9% 9.9% 9.3% 9.4% 9.4% 9.5% 9.8% 9.5% 9.3% 8.9% 8.9% 9.0% 77 78 * direct forecast 79 80 TABLE 3. HISTORICAL FREE CASH FLOW TABLE 7. FORECASTED FREE CASH FLOW 81 82 Free cash flow -5 -4 -3 -2 -1 0 1 2 3 4 5 6 7 8 9 10 11 12 83 84 Revenues 222.3 272.3 299.5 350.0 418.9 505.4 598.6 690.6 768.2 846.7 924.4 999.7 1070.9 1136.1 1193.6 1229.4 1266.3 1304.3 85 Operating expenses -205.8 -249.6 -274.7 -320.5 -383.6 -467.4 -538.8 -621.5 -691.4 -762.0 -831.9 -899.7 -963.8 -1022.5 -1074.2 -1106.5 -1139.7 -1173.9 86 Depreciation -9.3 -11.2 -13.0 -15.0 -17.7 -26.4 -28.7 -32.0 -36.6 -40.2 -43.8 -47.2 -50.4 -54.3 -57.9 -61.2 -63.3 -64.5 87 ------ ------ ------ ------ ------ ------ ------ ------ ------ ------ ------ ------ ------- ------- ------- ------- ------- ------- 88 EBIT 7.2 11.5 11.8 14.5 17.6 11.6 31.1 37.1 40.3 44.4 48.6 52.7 56.7 59.3 61.5 61.8 63.3 65.9 89 Taxes on EBIT -2.6 -4.1 -4.6 -6.0 -7.4 -4.4 -12.1 -14.5 -15.7 -17.3 -19.0 -20.6 -22.1 -23.1 -24.0 -24.1 -24.7 -25.7 90 Revaluation of deferred 91 income taxes 0.0 0.0 0.0 0.0 0.0 0.0 0.0 0.0 0.0 0.0 0.0 0.0 92 Change in deferred 93 income taxes 2.3 1.6 2.9 4.1 5.5 0.2 5.5 4.3 3.5 3.4 3.2 2.9 3.6 3.4 3.0 1.9 2.0 1.9 94 ------ ------ ------ ------ ------ ------ ------ ------ ------ ------ ------ ------ ------- ------- ------- ------- ------- ------- 95 NOPLAT 6.9 9.0 10.1 12.6 15.7 7.4 24.4 26.9 28.0 30.5 32.8 35.1 38.2 39.6 40.5 39.6 40.6 42.1 96 Add back depreciation 9.3 11.2 13.0 15.0 17.7 26.4 28.7 32.0 36.6 40.2 43.8 47.2 50.4 54.3 57.9 61.2 63.3 64.5 97 ------ ------ ------ ------ ------ ------ ------ ------ ------ ------ ------ ------ ------- ------- ------- ------- ------- ------- 98 Gross cash flow 16.2 20.2 23.1 27.6 33.4 33.8 53.2 58.9 64.6 70.7 76.7 82.3 88.6 93.8 98.4 100.8 103.9 106.6 99 100 Change in working 101 capital (+ if increase) 5.1 5.6 2.4 10.4 2.5 8.3 0.5 6.6 5.6 5.7 5.6 5.4 5.1 4.7 4.2 2.6 2.7 2.7 102 Capital expenditures 103 (+ if positive) 22.4 15.3 32.6 48.7 70.5 35.0 47.0 58.1 56.2 58.6 60.5 61.7 69.0 70.7 71.6 68.1 70.4 75.6 104 ------ ------ ------ ------ ------ ------ ------ ------ ------ ------ ------ ------ ------- ------- ------- ------- ------- ------- 2
  • 3. MCKAY VALUATION BY FREE CASH FLOW AND ABNORMAL EARNINGS MODELS (FILE MCK.XLS) A B C D E F G H I J K L M N O P Q R S T 105 Gross investment 27.5 20.9 35.0 59.1 73.0 43.3 47.5 64.8 61.8 64.3 66.1 67.2 74.2 75.4 75.8 70.7 73.0 78.4 106 ------ ------ ------ ------ ------ ------ ------ ------ ------ ------ ------ ------ ------- ------- ------- ------- ------- ------- 107 Free cash flow -11.3 -0.7 -11.9 -31.5 -39.6 -9.5 5.7 -5.9 2.8 6.4 10.5 15.1 14.4 18.4 22.6 30.1 30.9 28.2 108 ====== ====== ====== ====== ====== ====== ====== ====== ====== ====== ====== ====== ====== ====== ====== ====== ====== ====== 109 110 Financial cash flow -5 -4 -3 -2 -1 0 1 2 3 4 5 6 7 8 9 10 11 12 111 112 Incr(+)/Decr(-) in excess 113 marketable securities -7.9 17.5 -10.2 -10.3 5.8 -5.8 0.0 0.0 0.0 0.0 0.0 0.0 0.0 0.0 0.0 0.0 0.0 0.0 114 After-tax interest 115 income (-) 0.0 0.0 0.0 -0.5 -0.4 -0.4 0.0 0.0 0.0 0.0 0.0 0.0 0.0 0.0 0.0 0.0 0.0 0.0 116 Incr(-)/Decr(+) in short- 117 and long-term debt -6.5 -4.8 -6.1 -28.5 -51.4 -12.4 -0.5 -12.1 -7.7 -10.4 -9.7 -8.6 -10.3 -9.2 -7.7 -4.1 -4.2 -6.0 118 After-tax interest 119 expense (+) 0.2 0.5 0.6 2.1 2.5 6.2 6.2 6.2 6.9 7.3 7.8 8.3 8.8 9.4 9.8 10.3 10.5 10.7 120 Common dividends (+) 3.2 4.8 3.8 5.8 3.9 2.9 0.0 0.0 3.7 9.6 12.4 15.4 15.9 18.2 20.5 24.0 24.6 23.5 121 Incr(-)/Decr(+) in 122 common stock -0.3 -18.7 0.0 0.0 0.0 0.0 0.0 0.0 0.0 0.0 0.0 0.0 0.0 0.0 0.0 0.0 0.0 0.0 123 ------ ------ ------ ------ ------ ------ ------ ------ ------ ------ ------ ------ ------- ------- ------- ------- ------- ------- 124 Financial cash flow -11.3 -0.7 -11.9 -31.5 -39.6 -9.5 5.7 -5.9 2.8 6.4 10.5 15.1 14.4 18.4 22.6 30.1 30.9 28.2 125 126 Effective tax rate on EBIT 3.6% 21.8% 14.3% 12.9% 10.9% 36.3% 21.5% 27.4% 30.4% 31.4% 32.5% 33.5% 32.6% 33.3% 34.1% 35.9% 35.9% 36.2% 127 128 TABLE 4. HISTORICAL RATIOS FOR FORECAST ASSUMPTIONS TABLE 8. FORECAST ASSUMPTIONS 129 130 -6 -5 -4 -3 -2 -1 0 1 2 3 4 5 6 7 8 9 10 11 12 131 132 Operations 133 Real growth (g) 15.0% 12.0% 8.0% 7.0% 6.0% 5.0% 4.0% 3.0% 2.0% 0.0% 0.0% 0.0% 134 Inflation (i) 3.0% 3.0% 3.0% 3.0% 3.0% 3.0% 3.0% 3.0% 3.0% 3.0% 3.0% 3.0% 135 Revenue growth (c) 12.5% 22.5% 10.0% 16.9% 19.7% 20.6% 18.5% 15.4% 11.2% 10.2% 9.2% 8.2% 7.1% 6.1% 5.1% 3.0% 3.0% 3.0% 136 Operating expenses/ 137 revenues 88.8% 92.6% 91.7% 91.7% 91.6% 91.6% 92.5% 90.0% 90.0% 90.0% 90.0% 90.0% 90.0% 90.0% 90.0% 90.0% 90.0% 90.0% 90.0% 138 139 Working capital 140 Operating cash/revenues 2.0% 2.0% 2.0% 2.0% 1.7% 2.0% 2.0% 2.0% 2.0% 2.0% 2.0% 2.0% 2.0% 2.0% 2.0% 2.0% 2.0% 2.0% 2.0% 141 Trade receiv's/revenues 9.1% 11.0% 12.1% 11.1% 12.5% 11.9% 11.4% 11.3% 11.3% 11.3% 11.3% 11.3% 11.3% 11.3% 11.3% 11.3% 11.3% 11.3% 11.3% 142 Other receiv's/revenues 0.8% 0.9% 1.0% 0.9% 1.8% 1.2% 1.1% 1.1% 1.1% 1.1% 1.1% 1.1% 1.1% 1.1% 1.1% 1.1% 1.1% 1.1% 1.1% 143 Invent's/operating exp's 1.1% 1.0% 1.1% 0.9% 2.8% 2.8% 2.5% 1.8% 1.8% 1.8% 1.8% 1.8% 1.8% 1.8% 1.8% 1.8% 1.8% 1.8% 1.8% 144 Prepaid exp's/revenues 2.2% 2.3% 1.9% 2.0% 0.7% 1.1% 1.0% 1.6% 1.6% 1.6% 1.6% 1.6% 1.6% 1.6% 1.6% 1.6% 1.6% 1.6% 1.6% 145 Accounts payable/ 146 operating expenses 4.2% 5.3% 4.8% 3.8% 4.4% 4.2% 4.0% 4.4% 4.4% 4.4% 4.4% 4.4% 4.4% 4.4% 4.4% 4.4% 4.4% 4.4% 4.4% 147 Other curr liab's/rev's 7.0% 6.1% 6.7% 6.2% 6.1% 6.6% 5.7% 6.3% 6.3% 6.3% 6.3% 6.3% 6.3% 6.3% 6.3% 6.3% 6.3% 6.3% 6.3% 148 149 Property, Plant and 150 Equipment (PPE) 151 PPE economic life (n) 10 152 F_sub_g (see Sect 6) 10.0000 153 F_sub_c (see Sect 6) 8.7861 154 Real PPE/rev's (K) 0.580 155 M (see Section 6) 0.510 156 H (see Section 6) 0.426 3
  • 4. MCKAY VALUATION BY FREE CASH FLOW AND ABNORMAL EARNINGS MODELS (FILE MCK.XLS) A B C D E F G H I J K L M N O P Q R S T 157 Net PPE/revenues 31.5% 33.9% 29.2% 33.1% 37.9% 44.3% 38.4% 35.5% 34.5% 33.6% 32.7% 31.7% 30.8% 30.5% 30.2% 29.9% 29.6% 29.3% 29.3% 158 Depreciation/net PPE * 14.9% 14.9% 16.4% 15.1% 13.3% 14.2% 14.8% 15.1% 15.3% 15.6% 15.8% 16.1% 16.4% 16.6% 16.9% 17.2% 17.4% 17.4% 159 Retirements/net PPE * 7.5% 6.4% 6.5% -0.4% 2.0% 5.3% 5.3% 6.3% 7.3% 8.3% 9.3% 10.3% 11.2% 12.2% 13.2% 14.2% 15.2% 15.2% 160 Net PPE/revenues curve 161 parameter (α) -0.00319 162 Inflation factors 1.344 1.305 1.267 1.230 1.194 1.159 1.126 1.093 1.061 1.030 1.000 163 Resulting real gross PPE Err:508 164 Required real gross PPE 734.4 165 Drive to 0 by Goal Seek Err:508 166 (vary S161)! 167 168 Taxes 169 Tax rate 39.0% 39.0% 39.0% 39.0% 39.0% 39.0% 39.0% 39.0% 39.0% 39.0% 39.0% 39.0% 39.0% 39.0% 39.0% 39.0% 39.0% 39.0% 39.0% 170 PPE tax life (q) 5 171 J (see Section 8) 2.160 172 Timing diff's/net PPE 35.8% 37.4% 40.6% 40.1% 37.8% 34.7% 33.4% 37.1% 37.7% 38.3% 38.8% 39.4% 40.0% 40.5% 41.1% 41.7% 42.2% 42.8% 42.8% 173 174 Interest rate items 175 Real borrowing rate 5.60% 5.60% 5.60% 5.60% 5.60% 5.60% 5.60% 5.60% 5.60% 5.60% 5.60% 5.60% 176 Nominal borrowing rate 8.77% 8.77% 8.77% 8.77% 8.77% 8.77% 8.77% 8.77% 8.77% 8.77% 8.77% 8.77% 177 Real cost of equity 11.40% 11.40% 11.40% 11.40% 11.40% 11.40% 11.40% 11.40% 11.40% 11.40% 11.40% 11.40% 178 Nominal cost of equity 14.74% 14.74% 14.74% 14.74% 14.74% 14.74% 14.74% 14.74% 14.74% 14.74% 14.74% 14.74% 179 180 Book value target for 181 financial strength 56.7% 56.7% 56.7% 56.7% 56.7% 56.7% 56.7% 56.7% 56.7% 56.7% 56.7% 56.7% 182 183 This year's short-term/last 184 year's long-term debt 20.0% 20.0% 20.0% 20.0% 20.0% 20.0% 20.0% 20.0% 20.0% 20.0% 20.0% 20.0% 185 186 * last year's net PPE 187 188 VALUE CALCULATIONS Macro shortcut: Ctrl+Shift+G 189 190 1 2 3 4 5 6 7 8 9 10 11 12 191 192 1. Free Cash Flow 193 194 Excess marketable 195 securities (at year start) 0.0 0.0 0.0 0.0 0.0 0.0 0.0 0.0 0.0 0.0 0.0 0.0 196 Interest-bearing debt 197 (at year start) 115.5 116.0 128.1 135.8 146.2 155.9 164.5 174.8 184.0 191.7 195.9 200.1 198 Free cash fl (at year end) 5.7 -5.9 2.8 6.4 10.5 15.1 14.4 18.4 22.6 30.1 30.9 28.2 199 WACC 10.05% 10.05% 10.05% 10.05% 10.05% 10.05% 10.05% 10.05% 10.05% 10.05% 10.05% 10.05% 200 Computed value of oper 201 assets (at year start) 209.3 224.6 253.0 275.6 296.9 316.2 332.9 351.9 368.8 383.3 391.7 400.2 202 Computed equity value 203 (at year start) 93.8 108.6 124.9 139.8 150.7 160.3 168.3 177.0 184.8 191.5 195.8 200.1 204 Computed equity value at 205 the start of year 1 inclu- 206 ding dividends at the 207 end of year 0 96.7 208 4
  • 5. MCKAY VALUATION BY FREE CASH FLOW AND ABNORMAL EARNINGS MODELS (FILE MCK.XLS) A B C D E F G H I J K L M N O P Q R S T 209 Desired E/(D+E) year 12 50.0% 210 Result E/(D+E) year 12 50.0% 211 Result E/(D+E) all years 44.8% 48.3% 49.4% 50.7% 50.8% 50.7% 50.6% 50.3% 50.1% 50.0% 50.0% 50.0% 212 Drive to 0 by Goal Seek 213 (vary year 1 Book value 214 target for financial 215 strength I181)! 216 217 2. Abnormal Earnings 218 219 Interest-bearing debt 220 (at year start) 115.5 116.0 128.1 135.8 146.2 155.9 164.5 174.8 184.0 191.7 195.9 200.1 221 Book equity value 222 (at year start) 96.1 108.9 125.3 139.3 149.6 159.1 167.5 177.3 186.0 193.1 196.6 200.1 223 Net income (at year end) 12.8 16.4 17.7 19.8 21.8 23.8 25.8 26.8 27.6 27.4 28.2 29.5 224 Cost of equity 14.74% 14.74% 14.74% 14.74% 14.74% 14.74% 14.74% 14.74% 14.74% 14.74% 14.74% 14.74% 225 Abnormal earnings -1.4 0.3 -0.8 -0.7 -0.2 0.4 1.1 0.7 0.2 -1.0 -0.8 0.0 226 Computed value of abn 227 earnings (at year start) -1.5 -0.4 -0.8 -0.1 0.6 0.9 0.6 -0.4 -1.2 -1.6 -0.8 -0.1 228 Computed equity value 229 (at year start) 94.6 108.5 124.5 139.2 150.2 159.9 168.1 176.9 184.8 191.5 195.8 200.1 230 231 Desired E/(D+E) year 12 50.0% 232 Result E/(D+E) year 12 50.0% 233 Result E/(D+E) all years 45.0% 48.3% 49.3% 50.6% 50.7% 50.6% 50.5% 50.3% 50.1% 50.0% 50.0% 50.0% 234 Drive to 0 by Goal Seek 235 (vary year 1 Book value 236 target for financial 237 strength I181)! 5