Dy4301752755
•
0 likes•181 views

International Journal of Engineering Research and Applications (IJERA) is an open access online peer reviewed international journal that publishes research and review articles in the fields of Computer Science, Neural Networks, Electrical Engineering, Software Engineering, Information Technology, Mechanical Engineering, Chemical Engineering, Plastic Engineering, Food Technology, Textile Engineering, Nano Technology & science, Power Electronics, Electronics & Communication Engineering, Computational mathematics, Image processing, Civil Engineering, Structural Engineering, Environmental Engineering, VLSI Testing & Low Power VLSI Design etc.

Recommended
Recommended
More Related Content
What's hot
What's hot (20)
Viewers also liked
Viewers also liked (6)
Similar to Dy4301752755
Similar to Dy4301752755 (20)
Recently uploaded
Recently uploaded (20)
Dy4301752755
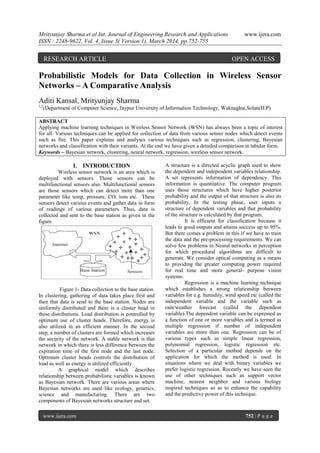
- 1. Mrityunjay Sharma et al Int. Journal of Engineering Research and Applications www.ijera.com ISSN : 2248-9622, Vol. 4, Issue 3( Version 1), March 2014, pp.752-755 www.ijera.com 752 | P a g e Probabilistic Models for Data Collection in Wireless Sensor Networks – A Comparative Analysis Aditi Kansal, Mrityunjay Sharma 1,2 (Department of Computer Science, Jaypee University of Information Technology, Waknaghat,Solan(H.P) ABSTRACT Applying machine learning techniques in Wireless Sensor Network (WSN) has always been a topic of interest for all. Various techniques can be applied for collection of data from various sensor nodes which detect events such as fire. This paper explains and analyses various techniques such as regression, clustering, Bayesian networks and classification with their variants. At the end we have given a detailed comparison in tabular form. Keywords – Bayesian network, clustering, neural network, regression, wireless sensor network. I. INTRODUCTION Wireless sensor network is an area which is deployed with sensors. Those sensors can be multifunctional sensors also. Multifunctional sensors are those sensors which can detect more than one parameter like temp, pressure, CO, ions etc. These sensors detect various events and gather data in form of readings of various parameters. Thus, data is collected and sent to the base station as given in the figure. Figure 1- Data collection to the base station In clustering, gathering of data takes place first and then that data is send to the base station. Nodes are uniformly distributed and there is a cluster head in these distributions. Load distribution is controlled by optimum use of cluster heads. Therefore, energy is also utilized in an efficient manner. In the second step, a number of clusters are formed which increases the security of the network. A stable network is that network in which there is less difference between the expiration time of the first node and the last node. Optimum cluster heads controls the distribution of load as well as energy is utilized efficiently. A graphical model which describes relationship between probabilistic variables is known as Bayesian network. There are various areas where Bayesian networks are used like ecology, genetics, science and manufacturing. There are two components of Bayesian networks structure and set. A structure is a directed acyclic graph used to show the dependent and independent variables relationship. A set represents information of dependency. This information is quantitative. The computer program uses those structures which have higher posterior probability and the output of that structure is also its probability. In the testing phase, user inputs a structure of dependent variables and that probability of the structure is calculated by that program. It is efficient for classification because it leads to good outputs and attains success up to 95%. But there comes a problem in this if we have to train the data and the pre-processing requirements. We can solve few problems in Neural networks in perception for which procedural algorithms are difficult to generate. We consider optical computing as a means to providing the greater computing power required for real time and more general- purpose vision systems. Regression is a machine learning technique which establishes a strong relationship between variables for e.g. humidity, wind speed etc (called the independent variable and the variable such as rain/weather forecast (called the dependent variable).The dependent variable can be expressed as a function of one or more variables and is termed as multiple regression if number of independent variables are more than one. Regression can be of various types such as simple linear regression, polynomial regression, logistic regression etc. Selection of a particular method depends on the application for which the method is used. In situations where we deal with binary variables we prefer logistic regression. Recently we have seen the use of other techniques such as support vector machine, nearest neighbor and various biology inspired techniques so as to enhance the capability and the predictive power of this technique. RESEARCH ARTICLE OPEN ACCESS
- 2. Mrityunjay Sharma et al Int. Journal of Engineering Research and Applications www.ijera.com ISSN : 2248-9622, Vol. 4, Issue 3( Version 1), March 2014, pp.752-755 www.ijera.com 753 | P a g e II. RELATED WORK A. Cluster Based Approximate Data Collection for Wireless Sensor Networks 1) KEN METHOD A robust technique used in wireless sensor network for data aggregation is known as Ken method. The communication cost between the base station and sensor node is reduced with the help of this methodology. This is because it uses dynamic probabilistic model for this. It is also helpful in detecting anomalies. It also has drawback that while the data is being transmitted and if any of the data packet is lost, then that data loss is difficult to recapture. It also has advantage that there is a fixed range of errors of the readings which can be read by users. Figure 2- Working of Ken model 2) DIRECTED DIFFUSION It is a data centric approach in which transmission of data takes place. In this, the messages are broadcast by the sink to its neighbors. The neighbor who wants that message and interested in that will reply to the sink. Since the nodes which are interested will respond back, so the transmission will be minimized. But the drawback of using such method is that it cannot be used for long term large scale wireless sensor networks. 3) SIMILARITY BASED ADAPTIVE FRAMEWORK This method diminishes the communication cost in wireless sensor network. It detects the similar features among different nodes and divides them into clusters according to their characteristics. Thus, the clustering helps to conserve energy and minimize transmission. It doesn’t consider the redundant readings of the data of the sensor nodes. So those readings which are drawbacks of this method are not considered. B. An energy efficient data collection scheme for wireless sensor networks 1) AUTOREGRESSIVE MODEL A time series data is a set of Xt reviews. Each of these has been examined at specific time t. Describing uncertainty mode of this data is its goal. The AutoRegressive Integrated Moving Average (ARIMA) model is a type of this category. Sensor node reading are time series types and also used for data forecasting in WSN. The AR model is simpler and light weighted as compare to ARIMA model. But it is more accurate. AR model is simple to use and we can apply methods like Burg, least-square or estimation of maximum likelihood. There are various phases used like local model learning phase which is used to avoid sensing and sending of readings of sensors to the sink node. This phase builds a good probabilistic model and maintains the individuality of each sensor node. Least square method is the best in case we want less computation. Next phases are centralized model clustering phase and approximate data collection phase. In the first one, after the leaning step the sensor nodes send the model coefficients C and the average flow value of the data F to the sink node. By attaining this information the sink performs clustering of model to obtain clusters. In the later phase, schedules for each cluster are made by the sink node and only few nodes have to report their data to the sink. Since few nodes have to send data, the energy consumption is reduced. C. Analysis on data collection using mobile robot in wireless sensor networks To increase the life span of WSN, more data should be gathered so that if any interruptions which occur while routing or aggregation of data can be handled. In this, a data collection algorithm is used. Nodes are dead which can be denoted by {M,A,H}. These can be partitioned. The nearby sinks will contain the sensed data. Each sensor node is defined with two threshold values for the near death and death nodes. These are denoted as Dn and D. The value of these threshold values should be between 0 and E. Here E is the energy consumed. On the bases of energy the position of the sensor node is determined. Similarly, the position of the other sensor nodes is determined. If the value of energy is less than D then it is considered as death node, else near death node. By considering two situations we achieve efficient data collection algorithm i.e. by identifying the locations of partitions and looking forward to the navigational strategies. The navigational strategies are GBA and LBA. In GBA, the near-death/dead node sends directly to its parent. But in case of LBA these nodes are in sleep mode. In case of GBA whole process output is considered. But in case of LBA, the role and output of each and every sensor node is considered. Finally, by aggregation of data the position of each sensor node is decided. Local-Based Approach, the LBA stores the intellect data and organizes packets nearby. Time-based scheduling (TBS), Location-based scheduling (LBS), Dynamic- moving based scheduling (DBS) are other algorithms which can be used for aggregation of data.
- 3. Mrityunjay Sharma et al Int. Journal of Engineering Research and Applications www.ijera.com ISSN : 2248-9622, Vol. 4, Issue 3( Version 1), March 2014, pp.752-755 www.ijera.com 754 | P a g e D. Data gathering and processing of large scale wireless sensor networks The limitation of wireless sensor network is energy consumption should be minimized even if a large number of sensor nodes have been deployed. Data is passed from one node to another by multi-hop routing. As a result it becomes difficult to reduce the cost of communication .Compressed Sensing (CS) is a collection of latest methods used for sampling. It helps to achieve accuracy in collection of data by the use of minimum measurements know as projections in compressed sensing literature. Reduction in global data traffic and minimizing the energy consumption are the objectives of data compression. The wireless sensing in compressed form minimizes the latency in compressed form by a single hop network. Linear projections are being delivered which are the readings of sensors in analog synchronization, but it is not suitable for large scale sensor networks. Therefore, sampling is used in gathering of data. Ji et al. proposed a Bayesian compressed sensing (BCS) algorithm which deals with high dimensional data. Chou et al. proposed an adaptive com- pressed sensing (ACS) algorithm [20] to collect information from sensor networks in an energy efficiency manner. III. COMPARATIVE ANALYSIS S. NO TECHNIQUE PROBABILISTIC MODEL USED ADVANTAGES DISADVANTAGES 1. A. Cluster Based Approximate Data Collection for Wireless Sensor Networks CLUSTERING 1) Reduces data redundancy 2) Saves energy 1) Data quality is reduced because of packet loss. 2) Huge data collection leads to excessive communication overhead. 2. B. An energy efficient data collection scheme for wireless sensor networks REGRESSION 1) Keeps the data quality. 2) Communication overhead is reduced. Accuracy is reduced. 3. C. Analysis on data collection using mobile robot in wireless sensor networks NEURAL NETWORKS 1)Area of localization positions into account for further process of collecting the data. 1) The deployment set is projected to be condensed more if the area of the localization stations is measured. 4. D. Data gathering and processing of large scale wireless sensor networks BAYESIAN NETWORKS 1) It can deal with abnormal sensor readings gracefully. 2) Data reconstruction is not sensitive to packet losses Losing main information will cause fatal errors to the decoder IV. CONCLUSION Thus, gathering of data through sensors in WSN. The main goal of this paper is minimizing the energy consumption in the sensor network by using various probabilistic models. A comparative analysis of some models is done which helps to reduce the consumption of energy in wireless sensor networks and the data is gathered by different methods in each and every probabilistic model. References [1] A. Ahmad, K. Latif, N. Javaidl, Z. Khan, and U. Qasim, “Density controlled divide- and-rule scheme for energy efficient routing in wireless sensor networks,” in Electrical and Computer Engineering (CCECE), 2013 26th Annual IEEE Canadian Conference on. IEEE, 2013, pp. 1–4. [2] X. Xing, D. Xie, and G.Wang, “Data gathering and processing for largescale wireless sensor networks,” in Mobile Ad-hoc
- 4. Mrityunjay Sharma et al Int. Journal of Engineering Research and Applications www.ijera.com ISSN : 2248-9622, Vol. 4, Issue 3( Version 1), March 2014, pp.752-755 www.ijera.com 755 | P a g e and Sensor Networks (MSN), 2013 IEEE Ninth International Conference on. IEEE, 2013, pp. 354–358. [3] M. Sabokrou, M. Fathy, and M. Hosseini, “Mobile target tracking in non-overlapping wireless visual sensor networks using neural networks,” in Computer and Knowledge Engineering (ICCKE), 2013 3th International eConference on. IEEE, 2013, pp. 309–314. [4] S. Dhivya and S. M. Kumar, “Cluster based approximate data collection for wireless sensor networks,” in Computer Communication and Informatics (ICCCI), 2013 International Conference on. IEEE, 2013, pp. 1–4. [5] Z. Liu, W. Xing, Y. Wang, and D. Lu, “An energy-efficient data collection scheme for wireless sensor networks,” in Advanced Communication Technology (ICACT), 2013 15th International Conference on. IEEE, 2013, pp. 60–65. [6] P. Rajaram and P. Prakasam, “Analysis on data collection using mobile robot in wireless sensor networks,” in Current Trends in Engineering and Technology (ICCTET), 2013 International Conference on. IEEE, 2013, pp. 264–269. [7] S. Huang, J. Li, J. Ye, A. Fleisher, K. Chen, T. Wu, E. Reiman, A. D. N. Initiative et al., “A sparse structure learning algorithm for Gaussian bayesian network identification from high-dimensional data,” Pattern Analysis and Machine Intelligence, IEEE Transactions on, vol. 35, no. 6, pp. 1328– 1342, 2013. [8] K. Dejaeger, T. Verbraken, and B. Baesens, “Toward comprehensible software fault prediction models using bayesian network classifiers,” Software Engineering, IEEE Transactions on, vol. 39, no. 2, pp. 237– 257, 2013 [9] M. Di and E. M. Joo, “A survey of machine learning in wireless sensor networks from networking and application perspectives,” in Information, Communications & Signal Processing, 2007 6th International Conference on. IEEE, 2007, pp. 1–5. [10] S. Afzal, “A review of localization techniques for wireless sensor networks,” Text Road Publication ISSN, pp. 2090–4304, 2012. [11] A. S. Raghuvanshi, R. Tripathi, and S. Tiwari, “Machine learning approach for anomaly detection in wireless sensor data,” International Journal of Advances in, Engineering and Technology, vol. 1, no. 4, pp. 47–61, 2011.