Abe 691 Estimating Markets
•
1 recomendación•2,325 vistas

The document discusses various methods for estimating market size, including defining key terms, frameworks for market sizing, and top-down versus bottom-up approaches. It provides examples of estimating total addressable markets, sales addressable markets, and target markets using different inputs and assumptions. Segmenting markets and developing estimation models using multiple data sources and steps are also covered.

Recomendados
Recomendados
Más contenido relacionado
La actualidad más candente
La actualidad más candente (20)
Similar a Abe 691 Estimating Markets
Similar a Abe 691 Estimating Markets (20)
Más de Ilana Stonebraker
Más de Ilana Stonebraker (20)
Último
Último (20)
Abe 691 Estimating Markets
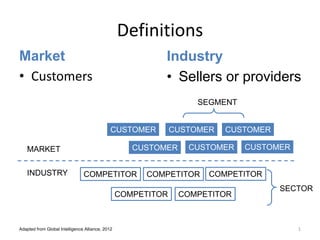
- 1. Definitions Market • Customers MARKET INDUSTRY CUSTOMER COMPETITOR CUSTOMERCUSTOMER CUSTOMER CUSTOMER CUSTOMER COMPETITOR COMPETITOR COMPETITOR COMPETITOR SEGMENT SECTOR Industry • Sellers or providers Adapted from Global Intelligence Alliance, 2012 1
- 2. Framework: Three Aspects to Market Sizing SEGMENTS ESTIMATION MODEL DATA SOURCES 2
- 3. Markets: Total, Sales, Target S Total AddressablePerfect World Scenario No competitors All the financing available to grow Adapted from Blank & Dorf, 2012 3
- 4. Markets: Total, Sales, Target S Total Addressable Sales Addressable Real World Constraints Geography Competition Sales channels Adapted from Blank & Dorf, 2012 4
- 5. Markets: Total, Sales, Target S Total Addressable Sales Addressable Target Priority Scenario Most desirable Most feasible 5 Adapted from Blank & Dorf, 2012
- 6. Markets: Total, Sales, Target S Total AddressablePerfect World Scenario No competitors All the financing available to grow Adapted from Blank & Dorf, 2012 6
- 7. Markets: Total, Sales, Target S Total Addressable Sales Addressable Real World Constraints Geography Competition Sales channels Adapted from Blank & Dorf, 2012 7
- 8. Markets: Total, Sales, Target S Total Addressable Sales Addressable Target Priority Scenario Most desirable Most feasible 8 Adapted from Blank & Dorf, 2012
- 9. Segmentation Total Addressable Market PRODUCT GROUP SEGMENT PRODUCT SEGMENTSEGMENT SEGMENT PRODUCT POPULATION GROUP CUSTOMERCUSTOMER Adapted from Global Intelligence Alliance, 2012 9
- 10. Estimation Modeling in 5 Steps 1. Brainstorm and map out possible inputs, outputs & calculations 2. Fill in data you currently have 3. Identify data gaps 4. Plan how to source and fill in data gaps 5. Compare estimates as result of different models This slide deck has been made available under a creative commons license to reuse, remix, repurpose for non-commercial Adapted from Global Intelligence Alliance, 2012 10
- 11. What’s an Estimation Model? Adapted from Global Intelligence Alliance, 2012 Vaccination coverage Price for one booster dose in DEFENSE scenario Market size (units) Birth cohorts Toddler cohorts Price for one primary dose in DEFENSE scenario Child cohorts Adolescent cohorts Price per country for one primary dose Market size (units) # of primary shots/year # of booster shots/year Price per country for one booster dose Public channel % Market size (value in USD) Private channel % Pre & post public market switch year Public channel % Private channel % x x + = + + This slide deck has been made available under a creative commons license to reuse, remix, repurpose for non-commercial 11
- 12. Two Approaches Top-down Top-down estimates approach the true value from above, by starting with broad indicators which are narrowed down using assumptions. Pro Often a quicker and easier way to size a market Con Tends to give too high estimates Bottom-up Bottom-up estimates approach the true value from below, by summing up known supply data from market participants. Pro Often considered more conservative (accounts for capacity limitations of the industry). Con Usually requires primary research, therefore often expensive to do. Statistic Data point Total market size Assumption Statistic Data point Assumption Supplier 1 Segment total Total market size Supplier 2 Supplier 3 Segment total Supplier 4 Source: Global Intelligence Alliance, 2012 12
- 13. Board Games: Top-down HH with Child Total market size: Board Games in U.S. HH Adults % Purchase BG Total HH Adult Market # of Games Purchased per year Price per Game % Purchase BG Total HH w Child Market # of Games Purchased per year Price per Game Adapted from Gentschev, 2010 This slide deck has been made available under a creative commons license to reuse, remix, repurpose for non-commercial 13
- 14. Board Games: Bottom-up Hasbro % (Board Games) Total market size: Board Games in U.S. Mattel Ravensburger % Revenue (Puzzles) Rio Grande % Revenue (Strategy) % (U.S. Sales) Total 1 Total 2 Total 3 Total 4 % (Board Games) % (U.S. Sales) % (U.S. Sales) % (U.S. Sales) Adapted from Gentschev, 2010 This slide deck has been made available under a creative commons license to reuse, remix, repurpose for non-commercial 14
- 15. Estimating the Diaper Market 300M (estimated) 80 years (estimated) 300M ÷ 80 = 4M (approx.) Total U.S. population (all ages) Average life expectancy Population per each 1-year age group Adapted from L.E.K. Consulting, 2013. This slide deck has been made available under a creative commons license to reuse, remix, repurpose for non-commercial 15
- 16. Diaper market by age (cont’d) Segments # of 1-yr age groups Pop per 1 year age group Pop per segment Diaper utilization rate Diapers used per day Total # of diapers used per day per segment Infant, 0-1 years 1 x 4M = 4M 100% 7 = 28M Toddler, 1-2 years 1 x 4M = 4M 100% 6 = 26M Toddler, 2-3 years 1 x 4M = 4M 80% 5 = 20M Child, 3-5 years 2 x 4M = 8M 50% 3 = 16M Adult, 5-74 years 69 x 4M = 276M 15% 3 = 124.2M Senior, 75-80 years 5 x 4M = 20M 40% 5 = 40M 300M (estimated) 80 years (estimated) 300M ÷ 80 = 4M (approx.) Total U.S. population (all ages) Average life expectancy Population per each 1-year age group This slide deck has been made available under a creative commons license to reuse, remix, repurpose for non-commercial 16
- 17. Segments Total # of diapers used per day per segment # days per year Total # of diapers used per year per segment Average revenue per diaper * Total estimated revenue per segment Infant, 0-1 years 28M x 365 = 10.2B 0.14 = $1.4B Toddler, 1-2 years 26M x 365 = 9.5B 0.14 = $1.3B Toddler, 2-3 years 20M x 365 = 7.3B 0.14 = $1.0B Child, 3-5 years 16M x 365 = 5.8B 0.14 = $812M Adult, 5-74 years 124.2M x 365 = 45.3B 0.14 = $6.3B Senior, 75-80 years 40M X 365 = 24.6B 0.14 = $3.4B TOTAL 254.2 X 365 = 102.7B 0.14 = $15B Diaper Market, Dollar Value (cont’d) *Average cost per diaper will vary on segment, quantity sold, material employed, brand premium and if end-market is retail or wholesale. This slide deck has been made available under a creative commons license to reuse, remix, repurpose for non-commercial 17
- 18. Sourcing the Data: Secondary Type of data Example of source Statistics Economic statistics Customs databases Government statistics Industry data Industry associations Market research reports Investor reports Product data Product brochures Product reviews News Free public aggregators (incl. Google) Fee-based news aggregators Financial data Global company financials databases Local company financials databases Company data Public company directories Securities exchanges (S.E.C., SEDAR)This slide deck has been made available under a creative commons license to reuse, remix, repurpose for non-commercial Adapted from Global Intelligence Alliance, 2012 18
- 19. Triangulation Estimate A (e.g., primary research) Estimate B (e.g., product complements where market sizes are known) Estimate C (e.g., based on macroeconomic indicators) Ideally, all estimates are independent of each other Adapted from Global Intelligence Alliance, 2012 This slide deck has been made available under a creative commons license to reuse, remix, repurpose for non-commercial 19
- 20. Framework: Three Aspects to Market Sizing SEGMENTS ESTIMATION MODEL DATA SOURCES Industry norms, decision-making context Develop more than one model, compare estimates Secondary + primary 20