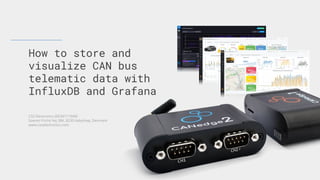
How to Store and Visualize CAN Bus Telematic Data with InfluxDB Cloud and Grafana
•
0 likes•848 views

The document discusses how CSS Electronics stores and visualizes telematic data collected from CAN bus networks using InfluxDB and Grafana. Specifically, it summarizes: 1) CSS Electronics develops CAN bus data loggers and sensors to collect data from vehicles and industrial equipment. They implemented InfluxDB to store the decoded telematic data and Grafana to visualize it in customizable dashboards. 2) The process involves logging raw CAN bus data, decoding it using Python scripts, and writing it to InfluxDB. Grafana then pulls the data from InfluxDB to generate intuitive dashboards without coding. 3) Examples are shown of heavy vehicle, automotive, maritime, and sensor fusion dashboards. The solution is open source

Recommended
More Related Content
What's hot
What's hot (20)
Similar to How to Store and Visualize CAN Bus Telematic Data with InfluxDB Cloud and Grafana
Similar to How to Store and Visualize CAN Bus Telematic Data with InfluxDB Cloud and Grafana (20)
More from InfluxData
More from InfluxData (20)
Recently uploaded
Recently uploaded (20)
How to Store and Visualize CAN Bus Telematic Data with InfluxDB Cloud and Grafana
- 1. How to store and visualize CAN bus telematic data with InfluxDB and Grafana CSS Electronics (DK36711949) Soeren Frichs Vej 38K, 8230 Aabyhoej, Denmark www.csselectronics.com
- 2. agenda 1. CSS Electronics, CAN bus and the CANedge2 ○ About us ○ What is CAN bus? ○ What problem do we solve - and how? 2. Telematics dashboards via InfluxDB and Grafana ○ Why InfluxDB and Grafana? ○ How did we implement it? ○ In action: Examples of dashboards (ours & users) ○ Pros & cons of the implementation
- 3. CSS Electronics, CAN bus and the CANedge2
- 4. about me ● Co-owner at CSS Electronics ● Responsibilities ○ Sales, tech support, marketing (web content, videos, SEO, ...) ○ Misc software dev (React, Python, Ruby, ...) ● Background: Management consulting, corporate strategy ● Degree in financial economics ● Live in Denmark with my wife and three kids Martin Falch ● www.linkedin.com/in/martin-falch-a7579821 CSS Electronics, CAN bus and the CANedge2
- 5. about CSS Electronics ● Started in 2015, based in Denmark ● Supply 2000+ companies across 80+ countries ● Develop & sell CAN bus hardware (data loggers, sensor modules) ○ PCB layouts from scratch ○ Firmware in embedded C ○ PCB assembly by US partner ● Carbon neutral since 2019 via 100% CO2 offsets ● Products are used particularly by automotive/industrial OEMs ● www.csselectronics.com ● contact@csselectronics.com ● +45 91 25 25 63 ● www.linkedin.com/company/css-electronics CSS Electronics CSS Electronics, CAN bus and the CANedge2
- 6. what is CAN bus? ● Quick overview of the technology ● Where is CAN bus used? ● Raw vs decoded CAN bus data CAN Bus Explained CSS Electronics, CAN bus and the CANedge2
- 7. where is CAN bus used? CSS Electronics, CAN bus and the CANedge2
- 8. raw vs decoded CAN bus data CSS Electronics, CAN bus and the CANedge2
- 9. example: What challenge do we solve? Situation ● Forklift battery OEM needs to collect data from new prototype ● Data to be recorded across hundreds of units & multiple warehouses CSS Electronics, CAN bus and the CANedge2
- 10. example: What challenge do we solve? Complication ● Because this is a team of OEM engineers, they have very specific requirements to the product ○ Solution needs to be low cost due to scale ○ Needs to be plug & play to install + power-safe ○ Needs to be pro specs - e.g. 0.05 ms frequency ○ Needs to be configurable (filters, triggers, ...) ○ Need to auto-upload data to their own server ○ Needs to be able to securely upload via WiFi ○ Needs ‘zero loss’ - SD is required to buffer ○ Needs support for many different software tools ○ ... CSS Electronics, CAN bus and the CANedge2
- 11. example: What challenge do we solve? Solution ● The CANedge2 enables the OEM to achieve their required use case CSS Electronics, CAN bus and the CANedge2
- 12. about the CANedge2 ● bit.ly/canedge2 ● bit.ly/canedge-intro-video ● www.csselectronics.com ● contact@csselectronics.com ● +45 91 25 25 63 CANedge2 2x CAN/LIN Data Logger (SD + WiFi) The 2xCAN/LIN logger records timestamped CAN bus data (Classical/CAN FD) to the extractable 8 GB industrial SD card. The device connects via WiFi access points (e.g. WLAN or 3G/4G routers) to securely push data to your own server. Ideal for telematics, field tests, diagnostics, predictive maintenance. CSS Electronics, CAN bus and the CANedge2
- 13. how it works ● Set up your own S3 server (~5 min) ● Configure your CANedge2 with your server/WiFi details ● Connect it to your CAN bus application to start logging ● Data is auto-pushed to your server and can be processed via the free software/API tools and DBC files CSS Electronics, CAN bus and the CANedge2
- 14. example use cases CSS Electronics, CAN bus and the CANedge2
- 15. what makes our solution different? ● Cross-section between pro specs loggers and telematics ● Ease-of-use: Plug & play & highly configurable (without scripts) ● Low cost: 50-80% lower cost vs. comparable devices ● Interoperable: Utilize open standards to ease custom integration ○ JSON Schema (configuration) ○ S3 (server interface) ○ MF4 (standardized binary log file format) ● 100% free open source software (FOSS) ● We do not host anything (and charge no recurring fees) pro specs automotive data loggers vehicle telematics CSS Electronics, CAN bus and the CANedge2
- 16. Telematics dashboards via InfluxDB and Grafana
- 17. issue: We lacked browser data visualization The CANedge2 integrates with various software tools - but previously no dashboard solution: ● Configuration editor: Load & edit JSON config files ● MF4 converters: Convert log files to other file formats ● asammdf: View, edit, DBC decode, plot log files ● Python API: Load & DBC decode log files ● CANcloud: Manage CANedge2 devices & data Telematics dashboards via InfluxDB and Grafana
- 18. how to best create a dashboard integration? Challenge Our users wanted to visualize their CAN bus data in the browser - ala a classic telematics dashboard Complication Specific user requirements: ● Need intra-second frequency ● 100% panel customization required (with no coding) ● Setup has to be really easy ● Solution needs to be optionally 100% free & open ● Should scale for big data Solution Process log files via Python API, write decoded data to InfluxDB, visualize in Grafana (facilitated via step-by-step guide and plug & play scripts) Telematics dashboards via InfluxDB and Grafana
- 19. why Grafana and InfluxDB? Why Grafana? ● Very popular (41K+ github stars) ● Intuitive/easy front end customization ● 100% free and open source ● Optional cloud (incl. free starter) ● Many plugins incl. geo maps ● Easy support for variables, alerts Why InfluxDB? ● Very popular (21K+ github stars) ● Natively supported by Grafana ● 100% free and open source ● Optional cloud (incl. free starter) ● Grafana & Influx Cloud Starter = easy ● Simple-to-use Python write API ● Intuitive explorer functionality Telematics dashboards via InfluxDB and Grafana
- 20. how did we implement it? ● High level article to explain concept and possibilities ● Our users need to be able to set everything up themselves ● “Time-to-awesome” is key - start simple! (free starter cloud) ● Optimized step-by-step guide with sample data + DBC ● Each device = ‘measurement’, each parameter = ‘field’ alternative setup examples typical ‘proof of concept’ setup Telematics dashboards via InfluxDB and Grafana
- 21. in action: Examples of dashboards See our public Grafana dashboard playground examples - or our user case studies involving dashboards (Havelsan, VIVES, Antü) Telematics dashboards via InfluxDB and Grafana
- 22. Dashboard links: Heavy duty (J1939) Telematics dashboards via InfluxDB and Grafana ● Playground link ● J1939 - simple intro ● J1939 data logger intro ● Mining intro
- 23. Dashboard links: Cars + GPS/IMU (OBD2) Telematics dashboards via InfluxDB and Grafana ● Playground link ● OBD2 - simple intro ● OBD2 data logger intro
- 24. Dashboard links: Maritime (NMEA 2000) Telematics dashboards via InfluxDB and Grafana ● Playground link ● Marine telematics
- 25. Dashboard links: CANmod.gps sensor fusion Telematics dashboards via InfluxDB and Grafana ● Playground link ● CANmod.gps
- 26. pros & cons of the implementation Telematics dashboards via InfluxDB and Grafana Pros ● Easy to get started due to cloud starters and plug & play data/script ● 100% free & open source - or paid convenience via full/partial cloud ● Users can fully customize their solution - without being developers Cons ● Our devices push data to S3, so an “S3 data source” would be “cleaner” (avoid duplicate data storage) ● Periodic uploads can result in users needing to crunch several GB at once ● Flux support in Grafana still semi-new
- 27. questions? Telematics dashboards via InfluxDB and Grafana ● bit.ly/canedge2 ● bit.ly/canedge-intro-video ● bit.ly/telematics-dashboard ● www.csselectronics.com ● contact@csselectronics.com ● +45 91 25 25 63
- 28. We look forward to bringing together our community of developers to learn, interact and share tips and use cases. 10-11 May 2021 Hands-On Flux Training 18-19 May 2021 Virtual Experience www.influxdays.com/emea-2021-virtual-experience/