SlideShare una empresa de Scribd logo
1 de 19
Descargar para leer sin conexión
International Journal of Business and Management Invention
ISSN (Online): 2319 – 8028, ISSN (Print): 2319 – 801X
www.ijbmi.org Volume 2 Issue 6ǁ June. 2013ǁ PP.07-25
www.ijbmi.org 7 | P a g e
India Infrastructure: A Boon Or A Bane?
1,
Niraj Satnalika , 2,
Saket Kochhar
1,
Research Analyst, CRISIL Ltd. , Mumbai, India
2,
PGDM (Finance) Batch of 2012-14, Insitute of Management Technology, Ghaziabad, India
ABSTRACT: Infrastructure: The roots of growth for emerging markets: “When you don't invest in
infrastructure, you are going to pay sooner or later"- Mike Parker. With the developed, developing economies
becoming Integrated, Interrelated, Interdependent, the need of infrastructure is growing day by day. It helps the
economy to keep up the pace with the dynamic changing environment. India, being the second largest economy
in Asia, is becoming the epicenter of trade. Constant GDP growth between 7-9% was seen from past few years
and with business, finance & trade developments taking place in the nation, India is now known to be the
economy which is on the verge of becoming the super power, after its competitor and neighbor China. The
recent Euro Zone Crisis and the risk of Double Dip recession, the Indian economy is left with the threat of
recession similar to the kind seen during the year 2007. A change in the monetary policy and fiscal policy was
implemented by Government of India to do the damage control so that the economic recession is not
experienced and the growth is not disrupted to a large extent. These changes though have resulted in the slow
growth. Recently Standard and Poor’s (S&P) Ratings Services in its report said “India needs to reform policies
concerning project execution and long term funding to fix its creaky infrastructure, which is a major roadblock
to its target of achieving a 9-9.5 percent annual growth during 2012-2017”.Government has stepped up
spending in recent years but the slow pace of reforms and a lack of long-term funding options constrain the
infrastructure growth, on the contrast the country's twelfth plan, focuses on removing these roadblocks and
creating a framework for private-sector participation, the feasibility of which lies with the leaders. In the draft
of twelfth five-year plan the government proposes to invest $1 trillion to upgrade infrastructure which is double
that in the earlier plan, which ends in March 2017. The delays in government and regulatory decision-making
have caused several infrastructure projects to fall way behind schedule, it added. However, the rating agency's
outlook for the infrastructure sector in India is stable thus commenting on India’s Infrastructure as a Boon or
Bain won’t be right at this point of time. What can be said is that the current stature of India’s Infrastructure is
definitely a hindrance to India’s growth.
KEYWORDS: Infrastructure, Indian economy, Debt, Equity, GDP, FiveYear Plan
I. INTRODUCTION
All you need to know about Infrastructure! What, Why and How?
Infrastructure can be thought as the basic physical and organizational structures which are required for the
proper operation of society or enterprise, also it can be thought of as the services and facilities necessary for
an economy to function smoothly.
“Infrastructure, in general, defined as the set of interconnected structural elements that provide
framework supporting an entire structure of development”
A well-knit and coordinated system of transport plays an important role in the sustained economic
growth of a country. Thus infrastructure can be regarded as one of the major requirements for sustainable
development of an economy. It also helps a nation develop a stature in today’s world where globalization is the
buzzword. Evidence also suggests that creation of infrastructure, through its direct and indirect effects, has a
significant impact on poverty reduction.Now when the need of infrastructure is defined, its working is a
mandate to be discussed. To accelerate the pace of infrastructure development and simultaneously reduce the
deficit of the same, the Government has taken the initiative and has started a host of projects and schemes with
the sole motive to upgrade physical infrastructure in all crucial sectors. Despite several challenges, the positive
results of the Government’s initiatives are showing in some sectors. However, required capacity addition in a
time-bound manner needs focused attention in other sectors.With the rising industrial growth and development
of the economy keeping its pace, the pick-up in overall industrial growth, core industries and infrastructure
services have also evinced signs of recovery with easing of supply bottlenecks in certain sectors and demand
recovery in others. In the Indian context, though there has been some improvement in infrastructure
development in transport, communication and energy sectors in recent years, there are still significant gaps that
need to be bridged.
India Infrastructure: A Boon…
www.ijbmi.org 8 | P a g e
The current economic slowdown provides an opportunity for countries like India that have a substantial
degree of unmet infrastructure requirements. This is reinforced by the understanding that spending on
infrastructure has large multiplier effects.
II. INDIAN ECONOMY
2.1.Post Independence Era (1947-1975):
Indian Economy during the time of Independence was known to be an agrarian economy wherein the
major part of the revenue, to an extent of 70%, was generated from the agriculture sector. Despite being an
agriculture front economy, food deficit was seen as a major issue besides the Colonial Exploitation and
Zamindari system. The main objective of planning in India at this stage was to initiate a process of development
which will raise living standards and also to open out to the people for new opportunities and for a richer, and
more varied life. The sole problem of development of an under developed economy is one of utilizing the
potential resources available to the community effectively. An underdeveloped economy is characterized by the
co-existence, in greater or less degree, of unutilized or underutilized manpower on the one hand and of
unexploited natural resources on the other.Indian economy, post independence, was somewhat more focused
towards increasing the investment the reason being accounted to the fact that being a fresh, new economy freed
from the British Raj it was necessary for the government to stabilize itself so as to control its economy in future.
A somewhat low rate of capital formation might have been adequate for countries like the U.K. and the U.S.A.,
wherein the modern industrialization took root early. On the other side the under developed countries which
make a late start have to aim at comparable development within a briefer period.The First Five Year Plan
involves an outlay on development by public authorities of around ` 2069 Crores over the period of 1951—56.
In determining this target of expenditure, the main considerations that have been taken into account are:
 Need for initiating a process of development that will form the basis of the much larger effort needed in the
future
 Total resources likely to be available to the country for the purpose of development
 The close relationship between the rates of development and the requirements of resources in the public and
in the private sectors
 The necessity of completing the schemes of development initiated by the Central and State Governments
prior to the commencement of the Plan ; and
 The need to correct the maladjustments in the economy caused by the war and the partition.
Following the budgetary plan formulated by the Planning Commission, since its inception in the year
1950, for the year 1951-1956 which is the First Five Year Plan of and for the Indian Economy. It is seen from
the chart that a major portion of the plan was focused on areas like agriculture and irrigation, the duo accounting
to as high as 45% of the total plan.
Figure I: Sectorwise Plan for 1st Five year Plan
India Infrastructure: A Boon…
www.ijbmi.org 9 | P a g e
Table 1: Sectorwise Plan for 1st Five year Plan
Thus we can see that Indian economy was not focused into infrastructure development rather the
development of the economy so as to ensure utmost utilization of the resources and also enhancing the
investment for the economy as a whole to the maximum.During the period of 1947-1965, the rate of growth of
the Indian economy in the first three decades after independence was derisively referred to as the Hindu rate of
growth by economists, because of the unfavorable growth rate. Since 1965, after the number of revolution in
the agricultural sector like the Green Revolution, Yellow Revolution or the White Revolution which enhanced
the use of high-yielding varieties of seeds, increased fertilisers and improved irrigation facilities collectively
contributed to the improved condition of agriculture by increasing crop productivity, crop patterns and
strengthening forward and backward linkages between agriculture and industry. However, the method was also
criticized accounting to the fact of unsustainable effort, resulting in the growth of capitalistic farming, ignoring
institutional reforms and widening income disparities.
2.2Liberalization of Economy (1991)
Liberalization Period- Is it liberalized or Paralyzed?
The major breakthrough in the economy came during the year 1991, when the current Prime Minister
Dr. Manmohan Singh served as the Finance Minister. He incorporated the Policy of Liberalization,
2.3.Privatization and Globalization also known as the LPG Policy.
In 1991, after India faced a balance of payments crisis, it had to pledge 67 tons of gold to Union Bank
of Switzerland and Bank of England as part of a bailout deal with the International Monetary Fund (IMF). In
addition to the bailout, IMF required Indian government to undertake a series of structural economic reforms.
As a result of which, the government of P. V. Narasimha Rao and finance minister Manmohan Singh started
breakthrough reforms, though all the reforms were not implemented as demanded by IMF.
The new neo-liberal policies included
 Opening for international trade and investment,
 Deregulation,
 Initiation of privatization,
 Tax reforms, and
 Inflation-controlling measures
With the sole motive to achieve a quality life for the common people of the nation, the main objective
of the government was to transform the economic system from socialism to capitalism so that a high economic
growth is achieved and industrialization can be seen in the nation which was, at the end of the day, intended for
the well-being of Indian citizens. Today India is mainly characterized as a market economy.
Sector Amount
Agriculture 360
Irrigation 561
Transport and Communications 497
Industry 173
Social Services 339
Rehabilitation 85
Miscellaneous 51
Total 2066
India Infrastructure: A Boon…
www.ijbmi.org 10 | P a g e
Figure II: Timeline
Following chart clearly depicts about the growth of the Indian Economy since LPG policy was incorporated in
1991. Indian economy saw a rapid growth as compared to the slow growth seen during the Post Independence
period of 1947-1991.
Figure III: India's GDP
Economy Liberalization in India in the 1990s and first decade of the 21st century led to large changes in the
economy. This is a chart of trend of gross domestic product.
Comparison
Year GDP w.r.t year 1975 w.r.t year 1990
1975 8,42,210 1 0.151949
1980 13,80,334 1.638943 0.249036
1985 27,29,350 3.2407 0.492422
1990 55,42,706 6.581145 1
1995 1,15,71,882 13.7399 2.087768
2000 2,07,91,898 24.68731 3.751218
Table 2: India's GDP
India Infrastructure: A Boon…
www.ijbmi.org 11 | P a g e
The figures itself shows how the GDP of the economy in 2000 grew by more than 24 times than that of
the GDP in the year 1975 and also grew 4 times as compared to the GDP in the year 1990. Thus the trio policy
of LPG came out to be a boon for the nation where in the infrastructure was also taken care of in the second
generation reforms. The Indian economy which generated around 70% of its revenue from the agriculture sector
has now turned the scenario with the services sector taking the lead with 57% followed by the manufacturing
sector at 28% and remaining being the agriculture sector at mere 15%.
Figure IV: GDP Contribution (Sectorwise)
Figure V: Workforce Distribution Sector Wise (Post LPG)
Now when the economic growth, development and reforms are taken care of, infrastructure was one key area
which needed utmost action and was of great importance. In the past, development of infrastructure was
completely in the hands of the public sector which was characterized by:
 Slow Progress,
 Poor Quality, and
 Inefficiency
INFRASTRUCTURE – A DETAILED LOOK
The Planning Commission of India categorizes infrastructure into the following 10 sectors:
 Electricity
 Roads and Bridges
 Telecommunications
 Railways
 Irrigation
 Water supply and Sanitation
 Ports
 Airports
 Storage
 Oil and Gas pipelines
The investment figures can be seen to almost double from the 10th
Five-year plan (US$ 217.86 billion)
to the 11th Five-year plan (US$ 514.04 billion). To that extent, the projected investment in the 12th
Five-year
plan (2012-2017) has also doubled from the previous plan to US $ 1 trillion in order to re-achieve and sustain a
Sector Contribution (%)
Agriculture 14.9
Services 56.6
Manufacturing 28.5
Total 100
Table 3: GDP Contribution (Sectorwise) Post LPG
Sector Workforce
Agriculture 52
Services 34
Manufacturing 14
Total 100
Table 4: Workforce Distribution
India Infrastructure: A Boon…
www.ijbmi.org 12 | P a g e
GDP growth rate of 9%. The policy of Public Private Partnership (PPP) was also strengthened to incorporate
30% private funding in the 11th
Five-year plan from 20% in the 10th
Five-year plan. For the 12th
Five-year plan,
this is expected to rise to 50%.India is privileged to rank #1 in terms of Public Private Partnership for the
execution of projects which is a moment of pride in itself.
III. ELECTRICITY
India has the 5th
largest power generating capacity in the world. The table below shows the electricity
production in India and their percentage contribution. We can see only 2.5 % of electricity is contributed by
Nuclear sources and maximum contribution to an extent of 55% is coming from coal itself which is again a non-
renewable source of energy and equally polluting. Thus India needs to work on the generation of electricity
from Hydro Power, Wind, Tidal, Bio-Gas, etc which are pollution free and are renewable.
Table 5: Electricity Production in India
Hydro Thermal Nuclear Total
MW 15627 59693 3380 78700
%age 19.9 75.8 4.3 100
Table 6: Planned generation of energy in 11th Five Year Plan
Based on ownership of the installed capacity, approximately 46% is owned by the state governments, 31 % by
the central government and 23% by the private sectors.
Figure VI: Ownership Structure for Energy
The growth rate of power generation has been 5.56% over the last year 2010-11 from 2009-10 and
similar figure of 5.7% CAGR during the 11th
Five-year plan. Transmission and Distribution network of power is
of 5.7 million circuit kilometres in length which is the 3
rd
largest in world.
FDI policy– 100% FDI permitted in Generation, Transmission and Distribution to draw private investment in
the sector which is currently seen at 23%
Incentives – Income tax waiver for first 10 years and import duty waiver on capital goods for mega power plant
projects (above 1000 MW generation capacity).
The graph below shows the electricity requirement, availability and shortfall in last 10 years. A rising demand
can be clearly seen from the graph. A rising supply too can be seen, however the supply is not sufficient enough
All
India
Thermal
Nuclear
Hydro RES@
Grand Total
Coal Gas Diesel Total (Renewable) (MNRE)
MW 104816.38 17742.85 1199.75 123758.98 4780 38848.4 20162.24 187549.62
%age 55.9 9.5 0.6 66 2.5 20.7 10.8 100
India Infrastructure: A Boon…
www.ijbmi.org 13 | P a g e
to meet the requirements. The demand supply gap compels people in many parts of the country to live only on
sunlight as the source of light.
Figure VII: Demand Supply Gap
The figure below shoes the shortage of electricity as percentage of requirement.
Figure VIII: Electricity Shortage (in Percent)
Some of the problems identified for the shortage of electricity in India are elucidated as under:
 Demand Supply Gap in coal
 Last preference for Gas-based power plants as supply to fertilizer unit, LPG and petrochemical plants tops
the list before power unit
 Poor financial condition of the State Electricity Boards
 Operational and technical inefficiencies
 High dependency on thermal production
 Limited dependency on renewable and nuclear sources
 Bureaucracy problem which delays in awarding tenders
 Shortage of investment, equipment and manpower
3.1.Solutions
Following are the solutions to meet the rising demand of electricity while preventing the environment:
 Renovation and maintenance of power system components
 Change in the generation mix with higher emphasis on the nuclear and other renewable sources of energy
 Improving the system of distribution to strengthen and reduce loss in the transmission and distribution
system
India Infrastructure: A Boon…
www.ijbmi.org 14 | P a g e
 Reducing the gestation period for power projects
 Reforms in State Electricity Boards
3.2.Roads and Bridges
India has the 2nd
largest road network in the world with about 3.314 million kilometres in length. In the
11th
Five-year plan the government embarked upon the massive National Highway Development Project
(NHDP) divided in 7 phases.
Figure IX: Road Length
Apart from the ambitious NHDP, the government has also planned several other projects for road development.
Some of them worth mentioning are:
 Pradhan Mantri Gram Sadak Yojana and Bharat Nirman
 Special Accelerated Road Development Programme for North East (SARDP-NE)
 Special Programme for Development of Roads in the Left Wing Extremism (LWE) Affected Areas
 Development of other non-NHDP National Highways
FDI Policy – 100% FDI under automatic route permitted for all road development projects.
Incentives – 100% income tax waiver for a period of first 5 years and 30% relief for next 5 years. Private
parties are also allowed to retain toll in case of BOT models. NHAI/government shall assist the players with
investment upto 40% of project cost. Also a import duty waiver for high capacity equipment is allowed.
Private sector investment - Private sector investment for roads in the 11
th
Five-year plan has been around Rs
18,800 crore (as of 2009) against the planned target of Rs 87000 Crore.
Problems faced by road development projects:
 Low participation of the private sector players
 Limited to low participation of foreign players
 Long gestation periods
 Huge capital requirement
 Problems during bidding. Standard Bidding Documents (SBD) and model Concession Agreement (MCA)
are problematic in several cases
 Problem of land acquisition, forest clearance and environment issue
 Labor shortage, unavailability of skilled technicians
 Unavailability of unsecured bank loans and very high interest if available
3.3.Solutions
 Increased participation from government towards fund
 Fastening the process of tendering
 Foreign Players encouragement
 Streamlining the process of land acquisition process by setting up land bank
 Concurrent implementation of projects in all 3 modes of BOT toll, BOT annuity and EPC basis
 Higher involvement of IIFCL helping in financing
India Infrastructure: A Boon…
www.ijbmi.org 15 | P a g e
IV. TELECOMMUNICATIONS
Telecom sector growth has so far been the most successful story, thanks to the huge participation from
the private players. Intense competition was witnessed in this sector due to entry of new players and expansion
by existing players, particularly in the wireless segment. Tariff wars by wireless operators to attract customers
were one of the key area of customer engagement. Growth of overall telecom subscriber base itself says the
story of Indian telecom sector. India has the 2
nd
largest telecom network in the world in terms of number of
subscriptions. It has grown rapidly at around 45%/year since 2006. Actual investment in the sector is expected
to exceed manifold in 12th
five year plan. This is due to increase in investment by the private sector.The figure
below shows the number of telephone connections in India since the year 2000. An exponential growth in the
number of mobile connections is seen all these years.
Figure X: Telephone Connnections
Looking at the internet, which is a very important means to be connected to the world we can see in the table
below the level of penetration in the country, has increased to 8.5 % in the year 2010 as compared to 0.1% in the
year 1998.
Year % Penetration
1998 0.1
1999 0.3
2000 0.3
2001 0.7
2002 1.6
2003 2.1
2004 3.6
2005 4.5
2006 3.6
2007 3.7
2009 7
2010 8.5
Table 7: Percentage penetration of Internet in India
India Infrastructure: A Boon…
www.ijbmi.org 16 | P a g e
The graph below shows the penetration pattern of internet in the nation.
Figure XI: % Penetration of Internet
The graph below shows the number of registered internet users since 2008 which has cross 100 million users by
2009 and is showing a massive growth in the ICT sector as a whole.
Figure XII: Internet user base in India
4.1.Major concerns
 Declining Average revenue per user due to tariff competition, increasing rural subscribers, and increasing
number of pre-paid subscribers
 Low utilization (40%) of the universal service levy collected from telecom operators for increasing
penetration of telecom services in rural and remote areas
 Low contribution (9-10%) of VAS (Value Added Services) to the operators’ revenue as compared to
developed nations
 Delay in implementation of MNP (Mobile Number Portability)
 Lack of efficiency and transparency in the process
But the presence of TRAI as a regulatory body in telecom has limited the problems and attracted
private players unlike other sectors, causing telecom to be a success in India so far.
4.2.Railways
India is privileged to have one of the biggest railway networks in the world. The figure below depicts
the Railway Route length graph from the year 1951. We can see that the railway route has not only increased but
is also getting electrified at a rapid pace. The country will very soon see electrified high performance railway
system which will be free from polluting diesel and coal bases locomotives.
India Infrastructure: A Boon…
www.ijbmi.org 17 | P a g e
Figure XIII: Railway Route Length in India
It is a known fact that nothing in this world holds interest until and unless a return is generated out of it.
Getting benefitted is the bottom line for every business, or work an Individual carries out. The graph below
shows nothing else but the revenue earning from railways. We can see a highly steep growth in the earnings.
The earnings can be seen plotted from the year 1972 until recently and we can see a net increase in the overall
earnings of railways including the increase in both the earnings from Passenger and good carrier.
Figure XIV: Revenue Earnings for Railways
Despite being highly connected railways is said to lack in efficiency, safety, security. Massive
accidents have frightened the common people. Not only this, hygiene is also a matter of concern for the people.
4.3.Solutions:
 Maintenance of railways including stations, coaches etc should be outsourced to companies dealing in
cleaning and maintenance
 Increased security for passengers, goods, etc. Security companies can be hired for the purpose.
 Proper checking before boarding of train this will improve ticketing and decrease corruption
India Infrastructure: A Boon…
www.ijbmi.org 18 | P a g e
 Security Check for luggage in a planned, efficient manner
 Starting of ultra high speed train between metropolitans and important cities
 Portal for online ticket booking to be improved
 Goods carrier should be increased and tie ups with companies/industries should be encourage
 Intra state connectivity should be improved
 Proper help and alarm system to be installed in Trains
4.4.Shipping
Shipping is another mode of transport which has a importance of its own. It is basically used for the
transportation of the goods from one place to another. The graph below shows the shipping industry details. We
can see a rising spree in the total number if ships operated in India.
Figure XV: Number of Ship Counts in India
Before getting into the details of Gross Register Tonnage and Deadweight Tonnage let us first see the
terms independently. Gross register tonnage or GRT as it is known commonly is a ship's total internal volume
expressed in "register tons", one of which equals to a volume of 100 cubic feet. Deadweight tonnage (also
known DWT) is a measure of how much weight a ship is carrying or can safely carry. It is the sum total of
weights of cargo, fuel, fresh water, ballast water, provisions, and passengers and obviously the crew
members.The graph below shows the increasing capacity of GRT and DWT since 1987 which is a good sign for
the nation.
Figure XVI: GRT and DWT Capacity
India Infrastructure: A Boon…
www.ijbmi.org 19 | P a g e
4.5.Airports
The aviation industry is among one of those industries which have seen constant development at rapid
pace not only in India but in the world as a whole. The open sky policy of the government has helped a lot of
overseas players entering the aviation market in India. The 9th largest aviation market in the world is India. The
Indian aviation industry has also seen the investment from private players and rapid head-to-head competition
striving for success. Private players has given the industry a new look, which on the whole is growing at a
tremendous rate but lot more needs to be done. The Indian Civil Aviation market grew at a CAGR of 18%,
being valued round US$ 5.6 billion in 2008. Further statistics revealed that the air traffic in August 2009 was a
double digit figure.The figures below give a clearer picture on the state of the industry and its affairs. We can
see that the no. of hours flown by the aircrafts in the domestic and international operations has increased
drastically since 1951.
Figure XVII: Hours Flown
Also the figure below depicts the no. of passengers flown since 1951. We can very well see the increasing trend
in the passengers flown in domestic operations.
Figure XVIII: Passengers Flown
The figure below is on the same lines as that of the figure above but it gives a clearer picture of the
aircrafts operation. The figure shows the number of kilometres flown by aircraft in both domestic and
international operation. We can again see the rising trend in the number of kilometres flown.
India Infrastructure: A Boon…
www.ijbmi.org 20 | P a g e
Figure XIX: Aircraft Operation
The figure below shows in detail Passenger, freight, mail tonne km flown case of both domestic and
international flights. It can be seen we are growing across the entire sector.
Figure XX: Flying Details of International and Domestic Flights
4.6.Ports
Ports form an important part in carrying out the business activities in a nation. Imports and exports of
goods take place at different ports situated in the country. It thus serves the purpose of linking two or more
nations and thus facilitates international trade, which again plays a vital role in the economy of nation as exports
and imports relates to Balance of Payment (BoP) and BoP helps in determining the performance of the
economy.The graph below shows the import traffic, export traffic at major ports. Also it shows the transhipment
traffic and total commodity traffic at ports. We can see a rising trend in all the four indicators and mainly in
terms of commodity it’s the highest.
India Infrastructure: A Boon…
www.ijbmi.org 21 | P a g e
Figure XXI: Ports in India
4.7.Approach to 12th Year Plan
The Indian economy which is now on the verge of releasing the Twelfth Five Year Plan for the period
of 2012-2017, can be characterized by strong macro i.e., the overall fundamentals and is also characterized by a
successful and good performance over the ongoing Eleventh Plan period. At the same time looking at the other
side of the coin the economy can be seen clouded by some slowdown in growth in the current year which can be
accounted to the fact of continuously growing concern about inflation and a sudden increase in uncertainty
about the global economy.
4.8.Plan of Action:
The twelfth year plan commencing April 1, 2012 projects a total investment of Rs 41 trillion (at 2006-
07 prices) in infrastructure. This would account to approximately 10% of India’s GDP during the period and is
twice the targeted levels during the eleventh five year plan. The planning commission plans to raise the said
fund by a contribution to an extent of 50% investment coming from the private sector (as stated earlier India
enjoys the #1 position in the world to have the maximum and largest number of Public Private Partnership
Projects).Deputy Chairman of Planning Commission, Dr. Montek Singh Ahluwalia said that financing the
infrastructure projects, which is aimed at an investment of 1 trillion USD, is not a constraint but the constraint is
we have long gestation period, return on investment is spread over a long period and a huge investment is
required.It was pointed out that the environment is attractive for foreign investment and there is a need of pool
of capital inflow so that the current a/c deficit of 3% can also be financed. Also the wealth with Indian banks
which is more than 1.1 trillion USD as reserve against the need of 1 trillion USD is sufficient enough to finance
the projects but in order to avoid the asset liability mismatch the banks are not going in for the financing which
in a sense is justified. Also lacking the expertise in infra domain the banks are not very comfortable in taking the
risk which would give them RoI on a longer period and not shorter term.Talking of an example we have seen the
case of Piramal Health care who despite having a mountain of cash to an extent of 8 billion USD sold its stake
as the company failed in finding suitable projects in India to route its cash.So we can see that the funds are not
the case but ecosystem, environment and routing of funds appropriately is the problem.Following is the brief
intended plan of financing of Infrastructure projects during the Twelfth Five year Plan starting April 1, 2012.
The Sources of Financing is categorically divided into two methods:
 Equity Financing, and
 Debt Financing
The total shortfall inclusive of both the Equity and debt financing stands out to be at `365000 Crore which is
nearly 15% of the total estimated financing of `2500000 Crore.
Table 8: Source of Equity Financing
Sources of Equity Finance
Corporates' internal accruals 329
IPOs 93
Private Equities 65
FDI 74
QIP 17
Shortfall 135
Total available sources 578
Total requirement 713
India Infrastructure: A Boon…
www.ijbmi.org 22 | P a g e
Figure XXII: Sources of Equity Financing
The equity financing includes IPO’s, private equities, Foreign Direct Investment or the QIP (Qualified
Institutional Placement). The equity finance, as per the Planning Commission projection, is expected to raise
around 29% of the total amount projected for financing inclusive of both debt and equity.
Figure XXIII: Sources of Debt Financing
4.9.Equity Financing
For equity financing Reverse-merger can be an option which the government should allow. Better
predictability of RoI can bring in more investors. Two years ago the road projects were financed by banks at
10% and now the same is done at 14%, if the predictability of RoI is improved, a pool of untapped investors can
be brought in. Foreign investors should be encouraged so that they can provide with the funds which are
required immediately. Foreign investors are reluctant due to Political and Country Risk, in such a case Insurance
companies should come into picture to build their confidence and get the inflow of money. Also debt market in
India is not strong enough to support the long term financing and infrastructure projects require long term
financing as the RoI is spread over a long term and cannot be generated immediately at hand.
4.10.Key Challenges:
There are several other external challenges arising from the fact that the current stature of the global
economic environment is less favorable than it was at the start of the Eleventh Plan. The global slowdown and
the European Crisis along with the fear of the double dip recession have added fuel to the fire. Apart from this,
the downgrading of US economy from it’s ever since AAA to AA+ by the Standard & Poor’s have done the
remaining icing. These global challenges call for renewed efforts on multiple fronts, learning from the
experience gained, and keeping in mind global developments.
4.11.Performance and Key areas:
As far as the Indian economy performance is considered it has not outperformed though have
performed well on the growth front which can be accounted due to the fact that the growth rate averaging 8.2
percent was seen in the first four years where as the growth in the final year of the Eleventh Plan saw a growth
of 8.5 percent in contrast to the projected 9 percent.
Sources of Debt Finance
Commercial banks 931
NBFCs 168
Insurance/pensions 116
ECB 179
Private Placements 158
Shortfall 230
Total available resources 1552
Total requirements 1782
Table 9: Sources of Debt Financing
India Infrastructure: A Boon…
www.ijbmi.org 23 | P a g e
This slight underperformance can be owed to the strong rebound from the crisis thus the actual growth
in 2011‐12 is likely to be around 8.0 percent which would lead to achieve an average GDP growth of around 8.2
percent over the Eleventh Plan period, lower than the targeted 9.0 percent, but better than the 7.8 percent growth
as seen in the Tenth Plan.This increase accounted for an increase of nearly 35 percent in per‐capita GDP. The
slowdown in 2011‐12 is a matter of concern, but can be reversed if the investment climate is turned around and
if fiscal policy is strengthen alongside.One of the major shortcomings of 11th
Plan was inadequate infrastructure
which resulted as a major constraint on rapid growth of the economy. The Plan had, therefore, emphasized the
need for a massive expansion in investment in infrastructure based on a combination of public and private
investment, the latter through various forms of public‐private‐partnerships. Substantial progress has been made
in this respect. The total investment in infrastructure which includes roads, railways, ports, airports,
electricity, telecommunications, oil gas pipelines and irrigation is estimated to have increased from 5.7
percent of GDP in the base year of the Eleventh Plan to around 8.0 percent in the last year of the Plan. The pace
of investment has been particularly buoyant in some sectors, notably telecommunications, oil & gas pipelines,
while falling short of targets in electricity, railways, roads and ports. Efforts to attract private investment into
infrastructure through the PPP route have met with considerable success, not only at the level of the Central
Government, but also at the level of the individual States. A large number of PPP projects have taken off, and
many of them are currently operational in both the Centre and the States.
As far as Urbanization is concerned as compared to other developing countries, India has been slow to
urbanize, but the pace of urbanization is expected to accelerate over the next two decades. According to the
2011 Census an increase was seen in the urban population from 27.8 percent in 2001 to 31.2 percent in 2011,
and is likely to exceed 40 percent by 2030. This would generate a heavy demand for better quality infrastructure
in urban areas, especially water, sewerage, public transport and low cost housing. Since it takes time to create
urban infrastructure, we must introduce a sufficiently long term focus on urban planning in the Twelfth Plan.
4.12.Public Private Partnerships (PPP) in Infrastructure
With the government spending or investment becoming a constraint, the Public Private Partnerships
(PPPs) are increasingly becoming the preferred mode for construction and operation of infrastructure projects,
both in developed and developing countries. PPPs are expected to augment resource availability as well as
improve efficiency of infrastructure service delivery. Time and cost overrun in construction of PPP projects are
also expected to be lower compared to traditional public procurement. The adoption of standardized documents
such as model concession agreements and bidding documents for award of PPP projects have streamlined and
accelerated decision‐making by agencies in a manner that is fair, transparent and competitive.
4.13.How PPP has affected?
India currently has 1,017 PPP projects accounting for an investment of Rs. 486,603 Crore. According
to the Private Participation in Infrastructure (PPI) database of the World Bank, India is second only to China
in terms of number of PPP projects and in terms of investments, it is second to Brazil.Transport is the dominant
PPP sector in India both by number of projects and investments, mainly due to the large number of road sector
projects. Efforts are needed to mainstream PPPs in areas such as power transmission and distribution, water
supply and sewerage and railways and in social sectors, especially health and education.
4.14.Few PPP Projects:
Major PPP projects undertaken thus far are: Delhi, Mumbai, Hyderabad and Bangalore airports; 4
ultra‐mega power projects at Sasan (Madhya Pradesh), Mundra (Gujarat), Krishnapatnam (Andhra Pradesh) and
Tilaiya (Jharkhand); container terminals at Mumbai, Chennai and Tuticorin ports; 15 concessions for operation
of container trains; Jhajjar power transmission project in Haryana and 298 national and state highway projects.
As far as current status of projects is concerned, as per our database, there have been 758 PPP projects in our
main sectors of focus where a contract has been awarded and projects are underway – in the sense that they are
either operational, have reached construction stage, or at least construction/implementation is imminent. The
total project cost is estimated to be about Rs. 383,332.06 Crore.
S E C T O R W I S E F I G U R E S
Sector Total Number of
Projects
Based on 100 Crore Between 100 to 250
Crore
Between 251 to 500
Crore
More than
500 Crore
Value
of
Contra
cts
Airports 5 - - 303.0 18,808.0 19,111.
0
Education 17 424.2 365.5 460.0 600.0 1,849.7
Energy 56 337.6 934.0 3,083.0 62,890.0 67,244.
India Infrastructure: A Boon…
www.ijbmi.org 24 | P a g e
6
Health Care 8 315.0 343.0 275.0 900.0 1,833.0
Ports 61 86.0 1,745.3 4,304.8 74,902.1 81,038.
2
Railways 4 - 102.2 873.0 594.3 1,569.6
Roads 405 4,364.6 11,696.5 38,520.5 122,143.3 176,72
4.9
Tourism 50 1,132.6 1,503.5 800.0 1,050.0 4,486.1
Urban
Developme
nt
152 2,812.0 3,136.9 6,688.2 16,838.0 29,475.
0
Total 758 9,471.9 19,826.9 55,307.5 298,725.8 383,33
2.1
Table 10: PPP Projects
V. CONCLUSION
Thus we can see that there is a drastic change in the Indian Economy since Independence and a lot has
been done towards the development of the Nations’ Infrastructure but still a lot more needs to be done so that
India can get a stature globally and can move on the path of development. According to the report published by
the standards and poor’s, it is said that lack of infrastructure on the face of Transport and lack of funding is a
hindrance to the growth of Indian Economy. The report clearly says that the inadequate infrastructure is a major
roadblock for the country’s economic development and if the same condition prevails the forecasted economic
growth for the coming twelfth five-year plan would be impossible to achieve.Thus we can say that India’s
Infrastructure is definitely not a boon for the economy though is not also a bane as it has the potential to be
changed and if changed it can change the face of the economy as a whole.
Appendix 1 (List of Table)
Table 1: Sectorwise Plan for 1st Five year Plan.......................................................................................................9
Table 2: India's GDP ............................................................................................................................................ 10
Table 3: GDP Contribution (Sectorwise) Post LPG ............................................................................................... 11
Table 4: Workforce Distribution ........................................................................................................................... 11
Table 5: Electricity Production in India................................................................................................................. 12
Table 6: Planned generation of energy in 11th Five Year Plan ............................................................................... 12
Table 7: Percentage penetration of Internet in India.............................................................................................. 15
Table 8: Source of Equity Financing..................................................................................................................... 21
Table 9: Sources of Debt Financing ...................................................................................................................... 22
Table 10: PPP Projects ......................................................................................................................................... 24
Appendix 2 (List of Figures)
Figure I: Sectorwise Plan for 1st Five year Plan ......................................................................................................8
Figure II: Timeline ............................................................................................................................................... 10
Figure III: India's GDP......................................................................................................................................... 10
Figure IV: GDP Contribution (Sectorwise) ........................................................................................................... 11
Figure V: Workforce Distribution Sector Wise (Post LPG)................................................................................... 11
Figure VI: Ownership Structure for Energy........................................................................................................... 12
Figure VII: Demand Supply Gap .......................................................................................................................... 13
Figure VIII: Electricity Shortage (in Percent)........................................................................................................ 13
Figure IX: Road Length........................................................................................................................................ 14
Figure X: Telephone Connnections....................................................................................................................... 15
Figure XI: % Penetration of Internet ..................................................................................................................... 16
Figure XII: Internet user base in India................................................................................................................... 16
Figure XIII: Railway Route Length in India.......................................................................................................... 17
Figure XIV: Revenue Earnings for Railways......................................................................................................... 17
Figure XV: Number of Ship Counts in India ......................................................................................................... 18
Figure XVI: GRT and DWT Capacity................................................................................................................... 18
Figure XVII: Hours Flown.................................................................................................................................... 19
Figure XVIII: Passengers Flown........................................................................................................................... 19
Figure XIX: Aircraft Operation............................................................................................................................. 20
Figure XX: Flying Details of International and Domestic Flights........................................................................... 20
India Infrastructure: A Boon…
www.ijbmi.org 25 | P a g e
Figure XXI: Ports in India .................................................................................................................................... 21
Figure XXII: Sources of Equity Financing ........................................................................................................... 22
Figure XXIII: Sources of Debt Financing.............................................................................................................. 22
REFERENCE
Online Resources
[1] Planning Commission, http://www.planningcommission.nic.in
[2] Government of India, http://finance.yahoo.com
[3] Ministry of Finance, http://finmin.nic.in/
[4] Ministry of Railway, http://www.indianrailways.gov.in/railwayboard/
[5] Centre for Monitoring Indian Economy Database, CMIE Database
[6] Secretariat for Infrastructure, Planning Commission, http://infrastructure.gov.in/
[7] Reserve Bank of India, http://www.rbi.org.in/
[8] Business Update, http://business.gov.in/default.php
[9] United Nations Development Programme in India, http://www.undp.org.in/
[10] Public Private Partnership in India, http://www.pppinindia.com/
[11] Ministry of Commerce, http://commerce.nic.in/
[12] Ministry of Road Transport and Highway, http://morth.nic.in/
[13] Ministry of Transport and Civil Aviation, http://www.motca.gov.af/
[14] Ministry of Shipping, http://shipping.nic.in/
[15] Ministry of Power, http://powermin.nic.in/
[16] Wikipedia, http://www.wikipedia.org
Organization Publications
 Annual Report to the People on Infrastructure 2010-11, Planning Commission
 Annual Report 2011-12 on The Working of State Power Utilities & Electricity Departments, Planning
Commission
 Approach Paper for the Twelfth Five Year Plan 2012-17, Planning Commission
 Eleventh Five Year Plan (2007-12), Planning Commission
 Mid Term Appraisal of the Eleventh Five Year Plan (2007), Planning Commission
 Mid Term Appraisal of the Tenth Five Year Plan (2002-2007), Planning Commission
 SCENARIOS: Shaping India's Futures, Planning Commission
 Monitorable Targets & Milstones for 2010-11 INFRASTRUCTURE SECTOR, Planning Commission
 Annual Report 2011, 10, 09, 08, 07 Planning Commission
 Annual report 2011, 10, 09, Ministry of Finance
 Union Budget 2012, 11, 10, Ministry of Finance
 Railway Budget 2012, 11, 10, Ministry of Railway
 Indian Infrastructure Report- Standard & Poor’s

Más contenido relacionado

La actualidad más candente

Indian Economy | 2019
Indian Economy | 2019Indian Economy | 2019
Indian Economy | 2019Ravit4
 
International Journal of Humanities and Social Science Invention (IJHSSI)
International Journal of Humanities and Social Science Invention (IJHSSI)International Journal of Humanities and Social Science Invention (IJHSSI)
International Journal of Humanities and Social Science Invention (IJHSSI)inventionjournals
 
Five year plans of India:Goals and Achievements
Five year plans of India:Goals and AchievementsFive year plans of India:Goals and Achievements
Five year plans of India:Goals and AchievementsRavi Varma reddy
 
2nd five year plan INDIA
2nd five year plan INDIA2nd five year plan INDIA
2nd five year plan INDIAJ A
 
First Five Year Plan India, 1951-56
First Five Year Plan India, 1951-56First Five Year Plan India, 1951-56
First Five Year Plan India, 1951-56Aman Kudesia
 
Industrial policy and structure
Industrial policy and structureIndustrial policy and structure
Industrial policy and structurepraveen3030
 
NITI Aayog and Planning Commission
NITI Aayog and Planning CommissionNITI Aayog and Planning Commission
NITI Aayog and Planning CommissionPreethi Selvaraj
 
Niti aayog-new-version
Niti aayog-new-versionNiti aayog-new-version
Niti aayog-new-versionvinayks75
 
Achievements and failures of indian economic planning
Achievements and failures of indian economic planningAchievements and failures of indian economic planning
Achievements and failures of indian economic planninganita rani
 
objectives of Current 5 year plan(2012-17)
objectives of Current 5 year plan(2012-17)objectives of Current 5 year plan(2012-17)
objectives of Current 5 year plan(2012-17)Sweetp999
 
The Role of Five-Year Plans in the development of SSIs
The Role of Five-Year Plans in the development of SSIsThe Role of Five-Year Plans in the development of SSIs
The Role of Five-Year Plans in the development of SSIsRHIMRJ Journal
 
Business environment -Twelfth five year plan(2012-2017)
Business environment -Twelfth five year plan(2012-2017)Business environment -Twelfth five year plan(2012-2017)
Business environment -Twelfth five year plan(2012-2017)Chandra Shekar Immani
 
Impact of Migration and Unplanned Development on the Urban Population
Impact of Migration and Unplanned Development on the Urban PopulationImpact of Migration and Unplanned Development on the Urban Population
Impact of Migration and Unplanned Development on the Urban Populationijtsrd
 
An approach to 12th five year plan(2012 17).pptxlknkl
An approach to 12th five year plan(2012 17).pptxlknklAn approach to 12th five year plan(2012 17).pptxlknkl
An approach to 12th five year plan(2012 17).pptxlknklAnuj Malhotra
 

La actualidad más candente (19)

Indian Economy | 2019
Indian Economy | 2019Indian Economy | 2019
Indian Economy | 2019
 
International Journal of Humanities and Social Science Invention (IJHSSI)
International Journal of Humanities and Social Science Invention (IJHSSI)International Journal of Humanities and Social Science Invention (IJHSSI)
International Journal of Humanities and Social Science Invention (IJHSSI)
 
Five year plans of India:Goals and Achievements
Five year plans of India:Goals and AchievementsFive year plans of India:Goals and Achievements
Five year plans of India:Goals and Achievements
 
Planning in India
Planning in IndiaPlanning in India
Planning in India
 
5 year plans
5 year plans5 year plans
5 year plans
 
State of the Indian Economy - Challenges and Way Ahead
State of the Indian Economy - Challenges and Way AheadState of the Indian Economy - Challenges and Way Ahead
State of the Indian Economy - Challenges and Way Ahead
 
Five Year Plan
Five Year PlanFive Year Plan
Five Year Plan
 
2nd five year plan INDIA
2nd five year plan INDIA2nd five year plan INDIA
2nd five year plan INDIA
 
First Five Year Plan India, 1951-56
First Five Year Plan India, 1951-56First Five Year Plan India, 1951-56
First Five Year Plan India, 1951-56
 
Industrial policy and structure
Industrial policy and structureIndustrial policy and structure
Industrial policy and structure
 
NITI Aayog and Planning Commission
NITI Aayog and Planning CommissionNITI Aayog and Planning Commission
NITI Aayog and Planning Commission
 
Niti aayog-new-version
Niti aayog-new-versionNiti aayog-new-version
Niti aayog-new-version
 
Achievements and failures of indian economic planning
Achievements and failures of indian economic planningAchievements and failures of indian economic planning
Achievements and failures of indian economic planning
 
objectives of Current 5 year plan(2012-17)
objectives of Current 5 year plan(2012-17)objectives of Current 5 year plan(2012-17)
objectives of Current 5 year plan(2012-17)
 
The Role of Five-Year Plans in the development of SSIs
The Role of Five-Year Plans in the development of SSIsThe Role of Five-Year Plans in the development of SSIs
The Role of Five-Year Plans in the development of SSIs
 
Business environment -Twelfth five year plan(2012-2017)
Business environment -Twelfth five year plan(2012-2017)Business environment -Twelfth five year plan(2012-2017)
Business environment -Twelfth five year plan(2012-2017)
 
Impact of Migration and Unplanned Development on the Urban Population
Impact of Migration and Unplanned Development on the Urban PopulationImpact of Migration and Unplanned Development on the Urban Population
Impact of Migration and Unplanned Development on the Urban Population
 
1 to 11.
1 to 11.1 to 11.
1 to 11.
 
An approach to 12th five year plan(2012 17).pptxlknkl
An approach to 12th five year plan(2012 17).pptxlknklAn approach to 12th five year plan(2012 17).pptxlknkl
An approach to 12th five year plan(2012 17).pptxlknkl
 

Destacado

Mudras for Women in Enhancing the Level of Oomph - A Pilot Trial in Virudhunagar
Mudras for Women in Enhancing the Level of Oomph - A Pilot Trial in VirudhunagarMudras for Women in Enhancing the Level of Oomph - A Pilot Trial in Virudhunagar
Mudras for Women in Enhancing the Level of Oomph - A Pilot Trial in Virudhunagarinventionjournals
 
Social work needs paulo frierie
	Social work needs paulo frierie	Social work needs paulo frierie
Social work needs paulo frierieinventionjournals
 
Identification of the effects of micro-credits on different aspects of the li...
Identification of the effects of micro-credits on different aspects of the li...Identification of the effects of micro-credits on different aspects of the li...
Identification of the effects of micro-credits on different aspects of the li...inventionjournals
 
Estimation of Phytochemical Components from Cassia Tora and To Study Its Larv...
Estimation of Phytochemical Components from Cassia Tora and To Study Its Larv...Estimation of Phytochemical Components from Cassia Tora and To Study Its Larv...
Estimation of Phytochemical Components from Cassia Tora and To Study Its Larv...inventionjournals
 
Oral Submucous fibrosis and the role of curcumin in its treatment: A review
	Oral Submucous fibrosis and the role of curcumin in its treatment: A review	Oral Submucous fibrosis and the role of curcumin in its treatment: A review
Oral Submucous fibrosis and the role of curcumin in its treatment: A reviewinventionjournals
 
A Study of the Prevalence of Cardio-Vascular Diseases and Its Risk Factors (B...
A Study of the Prevalence of Cardio-Vascular Diseases and Its Risk Factors (B...A Study of the Prevalence of Cardio-Vascular Diseases and Its Risk Factors (B...
A Study of the Prevalence of Cardio-Vascular Diseases and Its Risk Factors (B...inventionjournals
 
Standardization of Poly Herbal Siddha Medicine Eladhi Chooranam
Standardization of Poly Herbal Siddha Medicine Eladhi ChooranamStandardization of Poly Herbal Siddha Medicine Eladhi Chooranam
Standardization of Poly Herbal Siddha Medicine Eladhi Chooranaminventionjournals
 
Oil pulling as an adjunct to scaling and root planing: A Clinico-Microbial study
Oil pulling as an adjunct to scaling and root planing: A Clinico-Microbial studyOil pulling as an adjunct to scaling and root planing: A Clinico-Microbial study
Oil pulling as an adjunct to scaling and root planing: A Clinico-Microbial studyinventionjournals
 
To Study the Efficacy of Kampillakadi Tail as- Vranaropak In Sadyovrana
To Study the Efficacy of Kampillakadi Tail as- Vranaropak In SadyovranaTo Study the Efficacy of Kampillakadi Tail as- Vranaropak In Sadyovrana
To Study the Efficacy of Kampillakadi Tail as- Vranaropak In Sadyovranainventionjournals
 
The Accounting Information Quality And The Accounting Information System Qual...
The Accounting Information Quality And The Accounting Information System Qual...The Accounting Information Quality And The Accounting Information System Qual...
The Accounting Information Quality And The Accounting Information System Qual...inventionjournals
 

Destacado (10)

Mudras for Women in Enhancing the Level of Oomph - A Pilot Trial in Virudhunagar
Mudras for Women in Enhancing the Level of Oomph - A Pilot Trial in VirudhunagarMudras for Women in Enhancing the Level of Oomph - A Pilot Trial in Virudhunagar
Mudras for Women in Enhancing the Level of Oomph - A Pilot Trial in Virudhunagar
 
Social work needs paulo frierie
	Social work needs paulo frierie	Social work needs paulo frierie
Social work needs paulo frierie
 
Identification of the effects of micro-credits on different aspects of the li...
Identification of the effects of micro-credits on different aspects of the li...Identification of the effects of micro-credits on different aspects of the li...
Identification of the effects of micro-credits on different aspects of the li...
 
Estimation of Phytochemical Components from Cassia Tora and To Study Its Larv...
Estimation of Phytochemical Components from Cassia Tora and To Study Its Larv...Estimation of Phytochemical Components from Cassia Tora and To Study Its Larv...
Estimation of Phytochemical Components from Cassia Tora and To Study Its Larv...
 
Oral Submucous fibrosis and the role of curcumin in its treatment: A review
	Oral Submucous fibrosis and the role of curcumin in its treatment: A review	Oral Submucous fibrosis and the role of curcumin in its treatment: A review
Oral Submucous fibrosis and the role of curcumin in its treatment: A review
 
A Study of the Prevalence of Cardio-Vascular Diseases and Its Risk Factors (B...
A Study of the Prevalence of Cardio-Vascular Diseases and Its Risk Factors (B...A Study of the Prevalence of Cardio-Vascular Diseases and Its Risk Factors (B...
A Study of the Prevalence of Cardio-Vascular Diseases and Its Risk Factors (B...
 
Standardization of Poly Herbal Siddha Medicine Eladhi Chooranam
Standardization of Poly Herbal Siddha Medicine Eladhi ChooranamStandardization of Poly Herbal Siddha Medicine Eladhi Chooranam
Standardization of Poly Herbal Siddha Medicine Eladhi Chooranam
 
Oil pulling as an adjunct to scaling and root planing: A Clinico-Microbial study
Oil pulling as an adjunct to scaling and root planing: A Clinico-Microbial studyOil pulling as an adjunct to scaling and root planing: A Clinico-Microbial study
Oil pulling as an adjunct to scaling and root planing: A Clinico-Microbial study
 
To Study the Efficacy of Kampillakadi Tail as- Vranaropak In Sadyovrana
To Study the Efficacy of Kampillakadi Tail as- Vranaropak In SadyovranaTo Study the Efficacy of Kampillakadi Tail as- Vranaropak In Sadyovrana
To Study the Efficacy of Kampillakadi Tail as- Vranaropak In Sadyovrana
 
The Accounting Information Quality And The Accounting Information System Qual...
The Accounting Information Quality And The Accounting Information System Qual...The Accounting Information Quality And The Accounting Information System Qual...
The Accounting Information Quality And The Accounting Information System Qual...
 

Similar a International Journal of Business and Management Invention (IJBMI)

Indian Economy during the planning era
Indian Economy during the planning eraIndian Economy during the planning era
Indian Economy during the planning eraVaibhav verma
 
Trend and Growth of Flow of Credit to Agriculture after 1991 in India
Trend and Growth of Flow of Credit to Agriculture after 1991 in IndiaTrend and Growth of Flow of Credit to Agriculture after 1991 in India
Trend and Growth of Flow of Credit to Agriculture after 1991 in Indiaiosrjce
 
current five year plan of India
current five year plan of Indiacurrent five year plan of India
current five year plan of IndiaMEKUANINT ABERA
 
Second generation reforms in india
Second generation reforms  in indiaSecond generation reforms  in india
Second generation reforms in indiaGeorgi Mathew
 
5 yr master plan final and its approaches
 5 yr master plan final and its approaches 5 yr master plan final and its approaches
5 yr master plan final and its approachesnilofar saifi
 
Money Supply and its Impact on Inflation and Interest Rate: A case study of I...
Money Supply and its Impact on Inflation and Interest Rate: A case study of I...Money Supply and its Impact on Inflation and Interest Rate: A case study of I...
Money Supply and its Impact on Inflation and Interest Rate: A case study of I...Gokul K Prasad
 
Growth vs development ( by Karan & Group)
Growth vs development ( by Karan & Group)Growth vs development ( by Karan & Group)
Growth vs development ( by Karan & Group)MD SALMAN ANJUM
 
Infrastructure bottleneck in india
Infrastructure bottleneck in indiaInfrastructure bottleneck in india
Infrastructure bottleneck in indiaSambit Biswal
 
Demographic profile of INDIA - Opportunity or Threat
Demographic profile of INDIA - Opportunity or ThreatDemographic profile of INDIA - Opportunity or Threat
Demographic profile of INDIA - Opportunity or ThreatVijeth Karthik
 
Gk for law exams economics and science
Gk for law exams economics and scienceGk for law exams economics and science
Gk for law exams economics and sciencekeaton01167
 
404 ib Indian Economy and Trade Dependencies notes
404 ib Indian Economy and Trade Dependencies notes404 ib Indian Economy and Trade Dependencies notes
404 ib Indian Economy and Trade Dependencies notesASM's IBMR- Chinchwad
 
Growth vs development in Indian perspective
Growth vs development in Indian perspectiveGrowth vs development in Indian perspective
Growth vs development in Indian perspectiveKaran Rohokale
 
4. Economic Planning in Bangladesh.pdf
4. Economic Planning in Bangladesh.pdf4. Economic Planning in Bangladesh.pdf
4. Economic Planning in Bangladesh.pdfLAZINAAZRIN
 
Financial Analysis of the Blue Economy: Sagarmala’s Case in Point
Financial Analysis of the Blue Economy: Sagarmala’s Case in PointFinancial Analysis of the Blue Economy: Sagarmala’s Case in Point
Financial Analysis of the Blue Economy: Sagarmala’s Case in PointCentre for Financial Accountability
 
IIIE SECTION A ECONOMICS NOTES Economic development in india
IIIE SECTION A ECONOMICS NOTES Economic development in indiaIIIE SECTION A ECONOMICS NOTES Economic development in india
IIIE SECTION A ECONOMICS NOTES Economic development in indiaBhaskar Nagarajan
 

Similar a International Journal of Business and Management Invention (IJBMI) (20)

Indian Economy during the planning era
Indian Economy during the planning eraIndian Economy during the planning era
Indian Economy during the planning era
 
108INDIANECONOMY.pdf
108INDIANECONOMY.pdf108INDIANECONOMY.pdf
108INDIANECONOMY.pdf
 
Trend and Growth of Flow of Credit to Agriculture after 1991 in India
Trend and Growth of Flow of Credit to Agriculture after 1991 in IndiaTrend and Growth of Flow of Credit to Agriculture after 1991 in India
Trend and Growth of Flow of Credit to Agriculture after 1991 in India
 
current five year plan of India
current five year plan of Indiacurrent five year plan of India
current five year plan of India
 
Second generation reforms in india
Second generation reforms  in indiaSecond generation reforms  in india
Second generation reforms in india
 
5 year plan
 5 year plan 5 year plan
5 year plan
 
5 yr master plan final and its approaches
 5 yr master plan final and its approaches 5 yr master plan final and its approaches
5 yr master plan final and its approaches
 
Money Supply and its Impact on Inflation and Interest Rate: A case study of I...
Money Supply and its Impact on Inflation and Interest Rate: A case study of I...Money Supply and its Impact on Inflation and Interest Rate: A case study of I...
Money Supply and its Impact on Inflation and Interest Rate: A case study of I...
 
Growth vs development ( by Karan & Group)
Growth vs development ( by Karan & Group)Growth vs development ( by Karan & Group)
Growth vs development ( by Karan & Group)
 
Infrastructure bottleneck in india
Infrastructure bottleneck in indiaInfrastructure bottleneck in india
Infrastructure bottleneck in india
 
13 chapter7
13 chapter713 chapter7
13 chapter7
 
Demographic profile of INDIA - Opportunity or Threat
Demographic profile of INDIA - Opportunity or ThreatDemographic profile of INDIA - Opportunity or Threat
Demographic profile of INDIA - Opportunity or Threat
 
Indian Economy
Indian EconomyIndian Economy
Indian Economy
 
Gk for law exams economics and science
Gk for law exams economics and scienceGk for law exams economics and science
Gk for law exams economics and science
 
404 ib Indian Economy and Trade Dependencies notes
404 ib Indian Economy and Trade Dependencies notes404 ib Indian Economy and Trade Dependencies notes
404 ib Indian Economy and Trade Dependencies notes
 
Growth vs development in Indian perspective
Growth vs development in Indian perspectiveGrowth vs development in Indian perspective
Growth vs development in Indian perspective
 
4. Economic Planning in Bangladesh.pdf
4. Economic Planning in Bangladesh.pdf4. Economic Planning in Bangladesh.pdf
4. Economic Planning in Bangladesh.pdf
 
Financial Analysis of the Blue Economy: Sagarmala’s Case in Point
Financial Analysis of the Blue Economy: Sagarmala’s Case in PointFinancial Analysis of the Blue Economy: Sagarmala’s Case in Point
Financial Analysis of the Blue Economy: Sagarmala’s Case in Point
 
IIIE SECTION A ECONOMICS NOTES Economic development in india
IIIE SECTION A ECONOMICS NOTES Economic development in indiaIIIE SECTION A ECONOMICS NOTES Economic development in india
IIIE SECTION A ECONOMICS NOTES Economic development in india
 
MITians
MITiansMITians
MITians
 

Último

How Generative AI Is Transforming Your Business | Byond Growth Insights | Apr...
How Generative AI Is Transforming Your Business | Byond Growth Insights | Apr...How Generative AI Is Transforming Your Business | Byond Growth Insights | Apr...
How Generative AI Is Transforming Your Business | Byond Growth Insights | Apr...Hector Del Castillo, CPM, CPMM
 
business environment micro environment macro environment.pptx
business environment micro environment macro environment.pptxbusiness environment micro environment macro environment.pptx
business environment micro environment macro environment.pptxShruti Mittal
 
EUDR Info Meeting Ethiopian coffee exporters
EUDR Info Meeting Ethiopian coffee exportersEUDR Info Meeting Ethiopian coffee exporters
EUDR Info Meeting Ethiopian coffee exportersPeter Horsten
 
Traction part 2 - EOS Model JAX Bridges.
Traction part 2 - EOS Model JAX Bridges.Traction part 2 - EOS Model JAX Bridges.
Traction part 2 - EOS Model JAX Bridges.Anamaria Contreras
 
MAHA Global and IPR: Do Actions Speak Louder Than Words?
MAHA Global and IPR: Do Actions Speak Louder Than Words?MAHA Global and IPR: Do Actions Speak Louder Than Words?
MAHA Global and IPR: Do Actions Speak Louder Than Words?Olivia Kresic
 
Pitch Deck Teardown: Xpanceo's $40M Seed deck
Pitch Deck Teardown: Xpanceo's $40M Seed deckPitch Deck Teardown: Xpanceo's $40M Seed deck
Pitch Deck Teardown: Xpanceo's $40M Seed deckHajeJanKamps
 
Guide Complete Set of Residential Architectural Drawings PDF
Guide Complete Set of Residential Architectural Drawings PDFGuide Complete Set of Residential Architectural Drawings PDF
Guide Complete Set of Residential Architectural Drawings PDFChandresh Chudasama
 
PSCC - Capability Statement Presentation
PSCC - Capability Statement PresentationPSCC - Capability Statement Presentation
PSCC - Capability Statement PresentationAnamaria Contreras
 
NAB Show Exhibitor List 2024 - Exhibitors Data
NAB Show Exhibitor List 2024 - Exhibitors DataNAB Show Exhibitor List 2024 - Exhibitors Data
NAB Show Exhibitor List 2024 - Exhibitors DataExhibitors Data
 
WSMM Technology February.March Newsletter_vF.pdf
WSMM Technology February.March Newsletter_vF.pdfWSMM Technology February.March Newsletter_vF.pdf
WSMM Technology February.March Newsletter_vF.pdfJamesConcepcion7
 
The McKinsey 7S Framework: A Holistic Approach to Harmonizing All Parts of th...
The McKinsey 7S Framework: A Holistic Approach to Harmonizing All Parts of th...The McKinsey 7S Framework: A Holistic Approach to Harmonizing All Parts of th...
The McKinsey 7S Framework: A Holistic Approach to Harmonizing All Parts of th...Operational Excellence Consulting
 
Introducing the Analogic framework for business planning applications
Introducing the Analogic framework for business planning applicationsIntroducing the Analogic framework for business planning applications
Introducing the Analogic framework for business planning applicationsKnowledgeSeed
 
Send Files | Sendbig.comSend Files | Sendbig.com
Send Files | Sendbig.comSend Files | Sendbig.comSend Files | Sendbig.comSend Files | Sendbig.com
Send Files | Sendbig.comSend Files | Sendbig.comSendBig4
 
Church Building Grants To Assist With New Construction, Additions, And Restor...
Church Building Grants To Assist With New Construction, Additions, And Restor...Church Building Grants To Assist With New Construction, Additions, And Restor...
Church Building Grants To Assist With New Construction, Additions, And Restor...Americas Got Grants
 
Fordham -How effective decision-making is within the IT department - Analysis...
Fordham -How effective decision-making is within the IT department - Analysis...Fordham -How effective decision-making is within the IT department - Analysis...
Fordham -How effective decision-making is within the IT department - Analysis...Peter Ward
 
1911 Gold Corporate Presentation Apr 2024.pdf
1911 Gold Corporate Presentation Apr 2024.pdf1911 Gold Corporate Presentation Apr 2024.pdf
1911 Gold Corporate Presentation Apr 2024.pdfShaun Heinrichs
 
Pitch Deck Teardown: Geodesic.Life's $500k Pre-seed deck
Pitch Deck Teardown: Geodesic.Life's $500k Pre-seed deckPitch Deck Teardown: Geodesic.Life's $500k Pre-seed deck
Pitch Deck Teardown: Geodesic.Life's $500k Pre-seed deckHajeJanKamps
 
Innovation Conference 5th March 2024.pdf
Innovation Conference 5th March 2024.pdfInnovation Conference 5th March 2024.pdf
Innovation Conference 5th March 2024.pdfrichard876048
 

Último (20)

How Generative AI Is Transforming Your Business | Byond Growth Insights | Apr...
How Generative AI Is Transforming Your Business | Byond Growth Insights | Apr...How Generative AI Is Transforming Your Business | Byond Growth Insights | Apr...
How Generative AI Is Transforming Your Business | Byond Growth Insights | Apr...
 
Japan IT Week 2024 Brochure by 47Billion (English)
Japan IT Week 2024 Brochure by 47Billion (English)Japan IT Week 2024 Brochure by 47Billion (English)
Japan IT Week 2024 Brochure by 47Billion (English)
 
business environment micro environment macro environment.pptx
business environment micro environment macro environment.pptxbusiness environment micro environment macro environment.pptx
business environment micro environment macro environment.pptx
 
EUDR Info Meeting Ethiopian coffee exporters
EUDR Info Meeting Ethiopian coffee exportersEUDR Info Meeting Ethiopian coffee exporters
EUDR Info Meeting Ethiopian coffee exporters
 
Traction part 2 - EOS Model JAX Bridges.
Traction part 2 - EOS Model JAX Bridges.Traction part 2 - EOS Model JAX Bridges.
Traction part 2 - EOS Model JAX Bridges.
 
MAHA Global and IPR: Do Actions Speak Louder Than Words?
MAHA Global and IPR: Do Actions Speak Louder Than Words?MAHA Global and IPR: Do Actions Speak Louder Than Words?
MAHA Global and IPR: Do Actions Speak Louder Than Words?
 
Pitch Deck Teardown: Xpanceo's $40M Seed deck
Pitch Deck Teardown: Xpanceo's $40M Seed deckPitch Deck Teardown: Xpanceo's $40M Seed deck
Pitch Deck Teardown: Xpanceo's $40M Seed deck
 
Guide Complete Set of Residential Architectural Drawings PDF
Guide Complete Set of Residential Architectural Drawings PDFGuide Complete Set of Residential Architectural Drawings PDF
Guide Complete Set of Residential Architectural Drawings PDF
 
PSCC - Capability Statement Presentation
PSCC - Capability Statement PresentationPSCC - Capability Statement Presentation
PSCC - Capability Statement Presentation
 
NAB Show Exhibitor List 2024 - Exhibitors Data
NAB Show Exhibitor List 2024 - Exhibitors DataNAB Show Exhibitor List 2024 - Exhibitors Data
NAB Show Exhibitor List 2024 - Exhibitors Data
 
WSMM Technology February.March Newsletter_vF.pdf
WSMM Technology February.March Newsletter_vF.pdfWSMM Technology February.March Newsletter_vF.pdf
WSMM Technology February.March Newsletter_vF.pdf
 
The McKinsey 7S Framework: A Holistic Approach to Harmonizing All Parts of th...
The McKinsey 7S Framework: A Holistic Approach to Harmonizing All Parts of th...The McKinsey 7S Framework: A Holistic Approach to Harmonizing All Parts of th...
The McKinsey 7S Framework: A Holistic Approach to Harmonizing All Parts of th...
 
Introducing the Analogic framework for business planning applications
Introducing the Analogic framework for business planning applicationsIntroducing the Analogic framework for business planning applications
Introducing the Analogic framework for business planning applications
 
Send Files | Sendbig.comSend Files | Sendbig.com
Send Files | Sendbig.comSend Files | Sendbig.comSend Files | Sendbig.comSend Files | Sendbig.com
Send Files | Sendbig.comSend Files | Sendbig.com
 
WAM Corporate Presentation April 12 2024.pdf
WAM Corporate Presentation April 12 2024.pdfWAM Corporate Presentation April 12 2024.pdf
WAM Corporate Presentation April 12 2024.pdf
 
Church Building Grants To Assist With New Construction, Additions, And Restor...
Church Building Grants To Assist With New Construction, Additions, And Restor...Church Building Grants To Assist With New Construction, Additions, And Restor...
Church Building Grants To Assist With New Construction, Additions, And Restor...
 
Fordham -How effective decision-making is within the IT department - Analysis...
Fordham -How effective decision-making is within the IT department - Analysis...Fordham -How effective decision-making is within the IT department - Analysis...
Fordham -How effective decision-making is within the IT department - Analysis...
 
1911 Gold Corporate Presentation Apr 2024.pdf
1911 Gold Corporate Presentation Apr 2024.pdf1911 Gold Corporate Presentation Apr 2024.pdf
1911 Gold Corporate Presentation Apr 2024.pdf
 
Pitch Deck Teardown: Geodesic.Life's $500k Pre-seed deck
Pitch Deck Teardown: Geodesic.Life's $500k Pre-seed deckPitch Deck Teardown: Geodesic.Life's $500k Pre-seed deck
Pitch Deck Teardown: Geodesic.Life's $500k Pre-seed deck
 
Innovation Conference 5th March 2024.pdf
Innovation Conference 5th March 2024.pdfInnovation Conference 5th March 2024.pdf
Innovation Conference 5th March 2024.pdf
 

International Journal of Business and Management Invention (IJBMI)

  • 1. International Journal of Business and Management Invention ISSN (Online): 2319 – 8028, ISSN (Print): 2319 – 801X www.ijbmi.org Volume 2 Issue 6ǁ June. 2013ǁ PP.07-25 www.ijbmi.org 7 | P a g e India Infrastructure: A Boon Or A Bane? 1, Niraj Satnalika , 2, Saket Kochhar 1, Research Analyst, CRISIL Ltd. , Mumbai, India 2, PGDM (Finance) Batch of 2012-14, Insitute of Management Technology, Ghaziabad, India ABSTRACT: Infrastructure: The roots of growth for emerging markets: “When you don't invest in infrastructure, you are going to pay sooner or later"- Mike Parker. With the developed, developing economies becoming Integrated, Interrelated, Interdependent, the need of infrastructure is growing day by day. It helps the economy to keep up the pace with the dynamic changing environment. India, being the second largest economy in Asia, is becoming the epicenter of trade. Constant GDP growth between 7-9% was seen from past few years and with business, finance & trade developments taking place in the nation, India is now known to be the economy which is on the verge of becoming the super power, after its competitor and neighbor China. The recent Euro Zone Crisis and the risk of Double Dip recession, the Indian economy is left with the threat of recession similar to the kind seen during the year 2007. A change in the monetary policy and fiscal policy was implemented by Government of India to do the damage control so that the economic recession is not experienced and the growth is not disrupted to a large extent. These changes though have resulted in the slow growth. Recently Standard and Poor’s (S&P) Ratings Services in its report said “India needs to reform policies concerning project execution and long term funding to fix its creaky infrastructure, which is a major roadblock to its target of achieving a 9-9.5 percent annual growth during 2012-2017”.Government has stepped up spending in recent years but the slow pace of reforms and a lack of long-term funding options constrain the infrastructure growth, on the contrast the country's twelfth plan, focuses on removing these roadblocks and creating a framework for private-sector participation, the feasibility of which lies with the leaders. In the draft of twelfth five-year plan the government proposes to invest $1 trillion to upgrade infrastructure which is double that in the earlier plan, which ends in March 2017. The delays in government and regulatory decision-making have caused several infrastructure projects to fall way behind schedule, it added. However, the rating agency's outlook for the infrastructure sector in India is stable thus commenting on India’s Infrastructure as a Boon or Bain won’t be right at this point of time. What can be said is that the current stature of India’s Infrastructure is definitely a hindrance to India’s growth. KEYWORDS: Infrastructure, Indian economy, Debt, Equity, GDP, FiveYear Plan I. INTRODUCTION All you need to know about Infrastructure! What, Why and How? Infrastructure can be thought as the basic physical and organizational structures which are required for the proper operation of society or enterprise, also it can be thought of as the services and facilities necessary for an economy to function smoothly. “Infrastructure, in general, defined as the set of interconnected structural elements that provide framework supporting an entire structure of development” A well-knit and coordinated system of transport plays an important role in the sustained economic growth of a country. Thus infrastructure can be regarded as one of the major requirements for sustainable development of an economy. It also helps a nation develop a stature in today’s world where globalization is the buzzword. Evidence also suggests that creation of infrastructure, through its direct and indirect effects, has a significant impact on poverty reduction.Now when the need of infrastructure is defined, its working is a mandate to be discussed. To accelerate the pace of infrastructure development and simultaneously reduce the deficit of the same, the Government has taken the initiative and has started a host of projects and schemes with the sole motive to upgrade physical infrastructure in all crucial sectors. Despite several challenges, the positive results of the Government’s initiatives are showing in some sectors. However, required capacity addition in a time-bound manner needs focused attention in other sectors.With the rising industrial growth and development of the economy keeping its pace, the pick-up in overall industrial growth, core industries and infrastructure services have also evinced signs of recovery with easing of supply bottlenecks in certain sectors and demand recovery in others. In the Indian context, though there has been some improvement in infrastructure development in transport, communication and energy sectors in recent years, there are still significant gaps that need to be bridged.
  • 2. India Infrastructure: A Boon… www.ijbmi.org 8 | P a g e The current economic slowdown provides an opportunity for countries like India that have a substantial degree of unmet infrastructure requirements. This is reinforced by the understanding that spending on infrastructure has large multiplier effects. II. INDIAN ECONOMY 2.1.Post Independence Era (1947-1975): Indian Economy during the time of Independence was known to be an agrarian economy wherein the major part of the revenue, to an extent of 70%, was generated from the agriculture sector. Despite being an agriculture front economy, food deficit was seen as a major issue besides the Colonial Exploitation and Zamindari system. The main objective of planning in India at this stage was to initiate a process of development which will raise living standards and also to open out to the people for new opportunities and for a richer, and more varied life. The sole problem of development of an under developed economy is one of utilizing the potential resources available to the community effectively. An underdeveloped economy is characterized by the co-existence, in greater or less degree, of unutilized or underutilized manpower on the one hand and of unexploited natural resources on the other.Indian economy, post independence, was somewhat more focused towards increasing the investment the reason being accounted to the fact that being a fresh, new economy freed from the British Raj it was necessary for the government to stabilize itself so as to control its economy in future. A somewhat low rate of capital formation might have been adequate for countries like the U.K. and the U.S.A., wherein the modern industrialization took root early. On the other side the under developed countries which make a late start have to aim at comparable development within a briefer period.The First Five Year Plan involves an outlay on development by public authorities of around ` 2069 Crores over the period of 1951—56. In determining this target of expenditure, the main considerations that have been taken into account are:  Need for initiating a process of development that will form the basis of the much larger effort needed in the future  Total resources likely to be available to the country for the purpose of development  The close relationship between the rates of development and the requirements of resources in the public and in the private sectors  The necessity of completing the schemes of development initiated by the Central and State Governments prior to the commencement of the Plan ; and  The need to correct the maladjustments in the economy caused by the war and the partition. Following the budgetary plan formulated by the Planning Commission, since its inception in the year 1950, for the year 1951-1956 which is the First Five Year Plan of and for the Indian Economy. It is seen from the chart that a major portion of the plan was focused on areas like agriculture and irrigation, the duo accounting to as high as 45% of the total plan. Figure I: Sectorwise Plan for 1st Five year Plan
  • 3. India Infrastructure: A Boon… www.ijbmi.org 9 | P a g e Table 1: Sectorwise Plan for 1st Five year Plan Thus we can see that Indian economy was not focused into infrastructure development rather the development of the economy so as to ensure utmost utilization of the resources and also enhancing the investment for the economy as a whole to the maximum.During the period of 1947-1965, the rate of growth of the Indian economy in the first three decades after independence was derisively referred to as the Hindu rate of growth by economists, because of the unfavorable growth rate. Since 1965, after the number of revolution in the agricultural sector like the Green Revolution, Yellow Revolution or the White Revolution which enhanced the use of high-yielding varieties of seeds, increased fertilisers and improved irrigation facilities collectively contributed to the improved condition of agriculture by increasing crop productivity, crop patterns and strengthening forward and backward linkages between agriculture and industry. However, the method was also criticized accounting to the fact of unsustainable effort, resulting in the growth of capitalistic farming, ignoring institutional reforms and widening income disparities. 2.2Liberalization of Economy (1991) Liberalization Period- Is it liberalized or Paralyzed? The major breakthrough in the economy came during the year 1991, when the current Prime Minister Dr. Manmohan Singh served as the Finance Minister. He incorporated the Policy of Liberalization, 2.3.Privatization and Globalization also known as the LPG Policy. In 1991, after India faced a balance of payments crisis, it had to pledge 67 tons of gold to Union Bank of Switzerland and Bank of England as part of a bailout deal with the International Monetary Fund (IMF). In addition to the bailout, IMF required Indian government to undertake a series of structural economic reforms. As a result of which, the government of P. V. Narasimha Rao and finance minister Manmohan Singh started breakthrough reforms, though all the reforms were not implemented as demanded by IMF. The new neo-liberal policies included  Opening for international trade and investment,  Deregulation,  Initiation of privatization,  Tax reforms, and  Inflation-controlling measures With the sole motive to achieve a quality life for the common people of the nation, the main objective of the government was to transform the economic system from socialism to capitalism so that a high economic growth is achieved and industrialization can be seen in the nation which was, at the end of the day, intended for the well-being of Indian citizens. Today India is mainly characterized as a market economy. Sector Amount Agriculture 360 Irrigation 561 Transport and Communications 497 Industry 173 Social Services 339 Rehabilitation 85 Miscellaneous 51 Total 2066
  • 4. India Infrastructure: A Boon… www.ijbmi.org 10 | P a g e Figure II: Timeline Following chart clearly depicts about the growth of the Indian Economy since LPG policy was incorporated in 1991. Indian economy saw a rapid growth as compared to the slow growth seen during the Post Independence period of 1947-1991. Figure III: India's GDP Economy Liberalization in India in the 1990s and first decade of the 21st century led to large changes in the economy. This is a chart of trend of gross domestic product. Comparison Year GDP w.r.t year 1975 w.r.t year 1990 1975 8,42,210 1 0.151949 1980 13,80,334 1.638943 0.249036 1985 27,29,350 3.2407 0.492422 1990 55,42,706 6.581145 1 1995 1,15,71,882 13.7399 2.087768 2000 2,07,91,898 24.68731 3.751218 Table 2: India's GDP
  • 5. India Infrastructure: A Boon… www.ijbmi.org 11 | P a g e The figures itself shows how the GDP of the economy in 2000 grew by more than 24 times than that of the GDP in the year 1975 and also grew 4 times as compared to the GDP in the year 1990. Thus the trio policy of LPG came out to be a boon for the nation where in the infrastructure was also taken care of in the second generation reforms. The Indian economy which generated around 70% of its revenue from the agriculture sector has now turned the scenario with the services sector taking the lead with 57% followed by the manufacturing sector at 28% and remaining being the agriculture sector at mere 15%. Figure IV: GDP Contribution (Sectorwise) Figure V: Workforce Distribution Sector Wise (Post LPG) Now when the economic growth, development and reforms are taken care of, infrastructure was one key area which needed utmost action and was of great importance. In the past, development of infrastructure was completely in the hands of the public sector which was characterized by:  Slow Progress,  Poor Quality, and  Inefficiency INFRASTRUCTURE – A DETAILED LOOK The Planning Commission of India categorizes infrastructure into the following 10 sectors:  Electricity  Roads and Bridges  Telecommunications  Railways  Irrigation  Water supply and Sanitation  Ports  Airports  Storage  Oil and Gas pipelines The investment figures can be seen to almost double from the 10th Five-year plan (US$ 217.86 billion) to the 11th Five-year plan (US$ 514.04 billion). To that extent, the projected investment in the 12th Five-year plan (2012-2017) has also doubled from the previous plan to US $ 1 trillion in order to re-achieve and sustain a Sector Contribution (%) Agriculture 14.9 Services 56.6 Manufacturing 28.5 Total 100 Table 3: GDP Contribution (Sectorwise) Post LPG Sector Workforce Agriculture 52 Services 34 Manufacturing 14 Total 100 Table 4: Workforce Distribution
  • 6. India Infrastructure: A Boon… www.ijbmi.org 12 | P a g e GDP growth rate of 9%. The policy of Public Private Partnership (PPP) was also strengthened to incorporate 30% private funding in the 11th Five-year plan from 20% in the 10th Five-year plan. For the 12th Five-year plan, this is expected to rise to 50%.India is privileged to rank #1 in terms of Public Private Partnership for the execution of projects which is a moment of pride in itself. III. ELECTRICITY India has the 5th largest power generating capacity in the world. The table below shows the electricity production in India and their percentage contribution. We can see only 2.5 % of electricity is contributed by Nuclear sources and maximum contribution to an extent of 55% is coming from coal itself which is again a non- renewable source of energy and equally polluting. Thus India needs to work on the generation of electricity from Hydro Power, Wind, Tidal, Bio-Gas, etc which are pollution free and are renewable. Table 5: Electricity Production in India Hydro Thermal Nuclear Total MW 15627 59693 3380 78700 %age 19.9 75.8 4.3 100 Table 6: Planned generation of energy in 11th Five Year Plan Based on ownership of the installed capacity, approximately 46% is owned by the state governments, 31 % by the central government and 23% by the private sectors. Figure VI: Ownership Structure for Energy The growth rate of power generation has been 5.56% over the last year 2010-11 from 2009-10 and similar figure of 5.7% CAGR during the 11th Five-year plan. Transmission and Distribution network of power is of 5.7 million circuit kilometres in length which is the 3 rd largest in world. FDI policy– 100% FDI permitted in Generation, Transmission and Distribution to draw private investment in the sector which is currently seen at 23% Incentives – Income tax waiver for first 10 years and import duty waiver on capital goods for mega power plant projects (above 1000 MW generation capacity). The graph below shows the electricity requirement, availability and shortfall in last 10 years. A rising demand can be clearly seen from the graph. A rising supply too can be seen, however the supply is not sufficient enough All India Thermal Nuclear Hydro RES@ Grand Total Coal Gas Diesel Total (Renewable) (MNRE) MW 104816.38 17742.85 1199.75 123758.98 4780 38848.4 20162.24 187549.62 %age 55.9 9.5 0.6 66 2.5 20.7 10.8 100
  • 7. India Infrastructure: A Boon… www.ijbmi.org 13 | P a g e to meet the requirements. The demand supply gap compels people in many parts of the country to live only on sunlight as the source of light. Figure VII: Demand Supply Gap The figure below shoes the shortage of electricity as percentage of requirement. Figure VIII: Electricity Shortage (in Percent) Some of the problems identified for the shortage of electricity in India are elucidated as under:  Demand Supply Gap in coal  Last preference for Gas-based power plants as supply to fertilizer unit, LPG and petrochemical plants tops the list before power unit  Poor financial condition of the State Electricity Boards  Operational and technical inefficiencies  High dependency on thermal production  Limited dependency on renewable and nuclear sources  Bureaucracy problem which delays in awarding tenders  Shortage of investment, equipment and manpower 3.1.Solutions Following are the solutions to meet the rising demand of electricity while preventing the environment:  Renovation and maintenance of power system components  Change in the generation mix with higher emphasis on the nuclear and other renewable sources of energy  Improving the system of distribution to strengthen and reduce loss in the transmission and distribution system
  • 8. India Infrastructure: A Boon… www.ijbmi.org 14 | P a g e  Reducing the gestation period for power projects  Reforms in State Electricity Boards 3.2.Roads and Bridges India has the 2nd largest road network in the world with about 3.314 million kilometres in length. In the 11th Five-year plan the government embarked upon the massive National Highway Development Project (NHDP) divided in 7 phases. Figure IX: Road Length Apart from the ambitious NHDP, the government has also planned several other projects for road development. Some of them worth mentioning are:  Pradhan Mantri Gram Sadak Yojana and Bharat Nirman  Special Accelerated Road Development Programme for North East (SARDP-NE)  Special Programme for Development of Roads in the Left Wing Extremism (LWE) Affected Areas  Development of other non-NHDP National Highways FDI Policy – 100% FDI under automatic route permitted for all road development projects. Incentives – 100% income tax waiver for a period of first 5 years and 30% relief for next 5 years. Private parties are also allowed to retain toll in case of BOT models. NHAI/government shall assist the players with investment upto 40% of project cost. Also a import duty waiver for high capacity equipment is allowed. Private sector investment - Private sector investment for roads in the 11 th Five-year plan has been around Rs 18,800 crore (as of 2009) against the planned target of Rs 87000 Crore. Problems faced by road development projects:  Low participation of the private sector players  Limited to low participation of foreign players  Long gestation periods  Huge capital requirement  Problems during bidding. Standard Bidding Documents (SBD) and model Concession Agreement (MCA) are problematic in several cases  Problem of land acquisition, forest clearance and environment issue  Labor shortage, unavailability of skilled technicians  Unavailability of unsecured bank loans and very high interest if available 3.3.Solutions  Increased participation from government towards fund  Fastening the process of tendering  Foreign Players encouragement  Streamlining the process of land acquisition process by setting up land bank  Concurrent implementation of projects in all 3 modes of BOT toll, BOT annuity and EPC basis  Higher involvement of IIFCL helping in financing
  • 9. India Infrastructure: A Boon… www.ijbmi.org 15 | P a g e IV. TELECOMMUNICATIONS Telecom sector growth has so far been the most successful story, thanks to the huge participation from the private players. Intense competition was witnessed in this sector due to entry of new players and expansion by existing players, particularly in the wireless segment. Tariff wars by wireless operators to attract customers were one of the key area of customer engagement. Growth of overall telecom subscriber base itself says the story of Indian telecom sector. India has the 2 nd largest telecom network in the world in terms of number of subscriptions. It has grown rapidly at around 45%/year since 2006. Actual investment in the sector is expected to exceed manifold in 12th five year plan. This is due to increase in investment by the private sector.The figure below shows the number of telephone connections in India since the year 2000. An exponential growth in the number of mobile connections is seen all these years. Figure X: Telephone Connnections Looking at the internet, which is a very important means to be connected to the world we can see in the table below the level of penetration in the country, has increased to 8.5 % in the year 2010 as compared to 0.1% in the year 1998. Year % Penetration 1998 0.1 1999 0.3 2000 0.3 2001 0.7 2002 1.6 2003 2.1 2004 3.6 2005 4.5 2006 3.6 2007 3.7 2009 7 2010 8.5 Table 7: Percentage penetration of Internet in India
  • 10. India Infrastructure: A Boon… www.ijbmi.org 16 | P a g e The graph below shows the penetration pattern of internet in the nation. Figure XI: % Penetration of Internet The graph below shows the number of registered internet users since 2008 which has cross 100 million users by 2009 and is showing a massive growth in the ICT sector as a whole. Figure XII: Internet user base in India 4.1.Major concerns  Declining Average revenue per user due to tariff competition, increasing rural subscribers, and increasing number of pre-paid subscribers  Low utilization (40%) of the universal service levy collected from telecom operators for increasing penetration of telecom services in rural and remote areas  Low contribution (9-10%) of VAS (Value Added Services) to the operators’ revenue as compared to developed nations  Delay in implementation of MNP (Mobile Number Portability)  Lack of efficiency and transparency in the process But the presence of TRAI as a regulatory body in telecom has limited the problems and attracted private players unlike other sectors, causing telecom to be a success in India so far. 4.2.Railways India is privileged to have one of the biggest railway networks in the world. The figure below depicts the Railway Route length graph from the year 1951. We can see that the railway route has not only increased but is also getting electrified at a rapid pace. The country will very soon see electrified high performance railway system which will be free from polluting diesel and coal bases locomotives.
  • 11. India Infrastructure: A Boon… www.ijbmi.org 17 | P a g e Figure XIII: Railway Route Length in India It is a known fact that nothing in this world holds interest until and unless a return is generated out of it. Getting benefitted is the bottom line for every business, or work an Individual carries out. The graph below shows nothing else but the revenue earning from railways. We can see a highly steep growth in the earnings. The earnings can be seen plotted from the year 1972 until recently and we can see a net increase in the overall earnings of railways including the increase in both the earnings from Passenger and good carrier. Figure XIV: Revenue Earnings for Railways Despite being highly connected railways is said to lack in efficiency, safety, security. Massive accidents have frightened the common people. Not only this, hygiene is also a matter of concern for the people. 4.3.Solutions:  Maintenance of railways including stations, coaches etc should be outsourced to companies dealing in cleaning and maintenance  Increased security for passengers, goods, etc. Security companies can be hired for the purpose.  Proper checking before boarding of train this will improve ticketing and decrease corruption
  • 12. India Infrastructure: A Boon… www.ijbmi.org 18 | P a g e  Security Check for luggage in a planned, efficient manner  Starting of ultra high speed train between metropolitans and important cities  Portal for online ticket booking to be improved  Goods carrier should be increased and tie ups with companies/industries should be encourage  Intra state connectivity should be improved  Proper help and alarm system to be installed in Trains 4.4.Shipping Shipping is another mode of transport which has a importance of its own. It is basically used for the transportation of the goods from one place to another. The graph below shows the shipping industry details. We can see a rising spree in the total number if ships operated in India. Figure XV: Number of Ship Counts in India Before getting into the details of Gross Register Tonnage and Deadweight Tonnage let us first see the terms independently. Gross register tonnage or GRT as it is known commonly is a ship's total internal volume expressed in "register tons", one of which equals to a volume of 100 cubic feet. Deadweight tonnage (also known DWT) is a measure of how much weight a ship is carrying or can safely carry. It is the sum total of weights of cargo, fuel, fresh water, ballast water, provisions, and passengers and obviously the crew members.The graph below shows the increasing capacity of GRT and DWT since 1987 which is a good sign for the nation. Figure XVI: GRT and DWT Capacity
  • 13. India Infrastructure: A Boon… www.ijbmi.org 19 | P a g e 4.5.Airports The aviation industry is among one of those industries which have seen constant development at rapid pace not only in India but in the world as a whole. The open sky policy of the government has helped a lot of overseas players entering the aviation market in India. The 9th largest aviation market in the world is India. The Indian aviation industry has also seen the investment from private players and rapid head-to-head competition striving for success. Private players has given the industry a new look, which on the whole is growing at a tremendous rate but lot more needs to be done. The Indian Civil Aviation market grew at a CAGR of 18%, being valued round US$ 5.6 billion in 2008. Further statistics revealed that the air traffic in August 2009 was a double digit figure.The figures below give a clearer picture on the state of the industry and its affairs. We can see that the no. of hours flown by the aircrafts in the domestic and international operations has increased drastically since 1951. Figure XVII: Hours Flown Also the figure below depicts the no. of passengers flown since 1951. We can very well see the increasing trend in the passengers flown in domestic operations. Figure XVIII: Passengers Flown The figure below is on the same lines as that of the figure above but it gives a clearer picture of the aircrafts operation. The figure shows the number of kilometres flown by aircraft in both domestic and international operation. We can again see the rising trend in the number of kilometres flown.
  • 14. India Infrastructure: A Boon… www.ijbmi.org 20 | P a g e Figure XIX: Aircraft Operation The figure below shows in detail Passenger, freight, mail tonne km flown case of both domestic and international flights. It can be seen we are growing across the entire sector. Figure XX: Flying Details of International and Domestic Flights 4.6.Ports Ports form an important part in carrying out the business activities in a nation. Imports and exports of goods take place at different ports situated in the country. It thus serves the purpose of linking two or more nations and thus facilitates international trade, which again plays a vital role in the economy of nation as exports and imports relates to Balance of Payment (BoP) and BoP helps in determining the performance of the economy.The graph below shows the import traffic, export traffic at major ports. Also it shows the transhipment traffic and total commodity traffic at ports. We can see a rising trend in all the four indicators and mainly in terms of commodity it’s the highest.
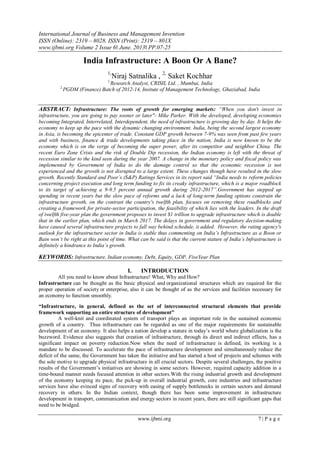
  • 15. India Infrastructure: A Boon… www.ijbmi.org 21 | P a g e Figure XXI: Ports in India 4.7.Approach to 12th Year Plan The Indian economy which is now on the verge of releasing the Twelfth Five Year Plan for the period of 2012-2017, can be characterized by strong macro i.e., the overall fundamentals and is also characterized by a successful and good performance over the ongoing Eleventh Plan period. At the same time looking at the other side of the coin the economy can be seen clouded by some slowdown in growth in the current year which can be accounted to the fact of continuously growing concern about inflation and a sudden increase in uncertainty about the global economy. 4.8.Plan of Action: The twelfth year plan commencing April 1, 2012 projects a total investment of Rs 41 trillion (at 2006- 07 prices) in infrastructure. This would account to approximately 10% of India’s GDP during the period and is twice the targeted levels during the eleventh five year plan. The planning commission plans to raise the said fund by a contribution to an extent of 50% investment coming from the private sector (as stated earlier India enjoys the #1 position in the world to have the maximum and largest number of Public Private Partnership Projects).Deputy Chairman of Planning Commission, Dr. Montek Singh Ahluwalia said that financing the infrastructure projects, which is aimed at an investment of 1 trillion USD, is not a constraint but the constraint is we have long gestation period, return on investment is spread over a long period and a huge investment is required.It was pointed out that the environment is attractive for foreign investment and there is a need of pool of capital inflow so that the current a/c deficit of 3% can also be financed. Also the wealth with Indian banks which is more than 1.1 trillion USD as reserve against the need of 1 trillion USD is sufficient enough to finance the projects but in order to avoid the asset liability mismatch the banks are not going in for the financing which in a sense is justified. Also lacking the expertise in infra domain the banks are not very comfortable in taking the risk which would give them RoI on a longer period and not shorter term.Talking of an example we have seen the case of Piramal Health care who despite having a mountain of cash to an extent of 8 billion USD sold its stake as the company failed in finding suitable projects in India to route its cash.So we can see that the funds are not the case but ecosystem, environment and routing of funds appropriately is the problem.Following is the brief intended plan of financing of Infrastructure projects during the Twelfth Five year Plan starting April 1, 2012. The Sources of Financing is categorically divided into two methods:  Equity Financing, and  Debt Financing The total shortfall inclusive of both the Equity and debt financing stands out to be at `365000 Crore which is nearly 15% of the total estimated financing of `2500000 Crore. Table 8: Source of Equity Financing Sources of Equity Finance Corporates' internal accruals 329 IPOs 93 Private Equities 65 FDI 74 QIP 17 Shortfall 135 Total available sources 578 Total requirement 713
  • 16. India Infrastructure: A Boon… www.ijbmi.org 22 | P a g e Figure XXII: Sources of Equity Financing The equity financing includes IPO’s, private equities, Foreign Direct Investment or the QIP (Qualified Institutional Placement). The equity finance, as per the Planning Commission projection, is expected to raise around 29% of the total amount projected for financing inclusive of both debt and equity. Figure XXIII: Sources of Debt Financing 4.9.Equity Financing For equity financing Reverse-merger can be an option which the government should allow. Better predictability of RoI can bring in more investors. Two years ago the road projects were financed by banks at 10% and now the same is done at 14%, if the predictability of RoI is improved, a pool of untapped investors can be brought in. Foreign investors should be encouraged so that they can provide with the funds which are required immediately. Foreign investors are reluctant due to Political and Country Risk, in such a case Insurance companies should come into picture to build their confidence and get the inflow of money. Also debt market in India is not strong enough to support the long term financing and infrastructure projects require long term financing as the RoI is spread over a long term and cannot be generated immediately at hand. 4.10.Key Challenges: There are several other external challenges arising from the fact that the current stature of the global economic environment is less favorable than it was at the start of the Eleventh Plan. The global slowdown and the European Crisis along with the fear of the double dip recession have added fuel to the fire. Apart from this, the downgrading of US economy from it’s ever since AAA to AA+ by the Standard & Poor’s have done the remaining icing. These global challenges call for renewed efforts on multiple fronts, learning from the experience gained, and keeping in mind global developments. 4.11.Performance and Key areas: As far as the Indian economy performance is considered it has not outperformed though have performed well on the growth front which can be accounted due to the fact that the growth rate averaging 8.2 percent was seen in the first four years where as the growth in the final year of the Eleventh Plan saw a growth of 8.5 percent in contrast to the projected 9 percent. Sources of Debt Finance Commercial banks 931 NBFCs 168 Insurance/pensions 116 ECB 179 Private Placements 158 Shortfall 230 Total available resources 1552 Total requirements 1782 Table 9: Sources of Debt Financing
  • 17. India Infrastructure: A Boon… www.ijbmi.org 23 | P a g e This slight underperformance can be owed to the strong rebound from the crisis thus the actual growth in 2011‐12 is likely to be around 8.0 percent which would lead to achieve an average GDP growth of around 8.2 percent over the Eleventh Plan period, lower than the targeted 9.0 percent, but better than the 7.8 percent growth as seen in the Tenth Plan.This increase accounted for an increase of nearly 35 percent in per‐capita GDP. The slowdown in 2011‐12 is a matter of concern, but can be reversed if the investment climate is turned around and if fiscal policy is strengthen alongside.One of the major shortcomings of 11th Plan was inadequate infrastructure which resulted as a major constraint on rapid growth of the economy. The Plan had, therefore, emphasized the need for a massive expansion in investment in infrastructure based on a combination of public and private investment, the latter through various forms of public‐private‐partnerships. Substantial progress has been made in this respect. The total investment in infrastructure which includes roads, railways, ports, airports, electricity, telecommunications, oil gas pipelines and irrigation is estimated to have increased from 5.7 percent of GDP in the base year of the Eleventh Plan to around 8.0 percent in the last year of the Plan. The pace of investment has been particularly buoyant in some sectors, notably telecommunications, oil & gas pipelines, while falling short of targets in electricity, railways, roads and ports. Efforts to attract private investment into infrastructure through the PPP route have met with considerable success, not only at the level of the Central Government, but also at the level of the individual States. A large number of PPP projects have taken off, and many of them are currently operational in both the Centre and the States. As far as Urbanization is concerned as compared to other developing countries, India has been slow to urbanize, but the pace of urbanization is expected to accelerate over the next two decades. According to the 2011 Census an increase was seen in the urban population from 27.8 percent in 2001 to 31.2 percent in 2011, and is likely to exceed 40 percent by 2030. This would generate a heavy demand for better quality infrastructure in urban areas, especially water, sewerage, public transport and low cost housing. Since it takes time to create urban infrastructure, we must introduce a sufficiently long term focus on urban planning in the Twelfth Plan. 4.12.Public Private Partnerships (PPP) in Infrastructure With the government spending or investment becoming a constraint, the Public Private Partnerships (PPPs) are increasingly becoming the preferred mode for construction and operation of infrastructure projects, both in developed and developing countries. PPPs are expected to augment resource availability as well as improve efficiency of infrastructure service delivery. Time and cost overrun in construction of PPP projects are also expected to be lower compared to traditional public procurement. The adoption of standardized documents such as model concession agreements and bidding documents for award of PPP projects have streamlined and accelerated decision‐making by agencies in a manner that is fair, transparent and competitive. 4.13.How PPP has affected? India currently has 1,017 PPP projects accounting for an investment of Rs. 486,603 Crore. According to the Private Participation in Infrastructure (PPI) database of the World Bank, India is second only to China in terms of number of PPP projects and in terms of investments, it is second to Brazil.Transport is the dominant PPP sector in India both by number of projects and investments, mainly due to the large number of road sector projects. Efforts are needed to mainstream PPPs in areas such as power transmission and distribution, water supply and sewerage and railways and in social sectors, especially health and education. 4.14.Few PPP Projects: Major PPP projects undertaken thus far are: Delhi, Mumbai, Hyderabad and Bangalore airports; 4 ultra‐mega power projects at Sasan (Madhya Pradesh), Mundra (Gujarat), Krishnapatnam (Andhra Pradesh) and Tilaiya (Jharkhand); container terminals at Mumbai, Chennai and Tuticorin ports; 15 concessions for operation of container trains; Jhajjar power transmission project in Haryana and 298 national and state highway projects. As far as current status of projects is concerned, as per our database, there have been 758 PPP projects in our main sectors of focus where a contract has been awarded and projects are underway – in the sense that they are either operational, have reached construction stage, or at least construction/implementation is imminent. The total project cost is estimated to be about Rs. 383,332.06 Crore. S E C T O R W I S E F I G U R E S Sector Total Number of Projects Based on 100 Crore Between 100 to 250 Crore Between 251 to 500 Crore More than 500 Crore Value of Contra cts Airports 5 - - 303.0 18,808.0 19,111. 0 Education 17 424.2 365.5 460.0 600.0 1,849.7 Energy 56 337.6 934.0 3,083.0 62,890.0 67,244.
  • 18. India Infrastructure: A Boon… www.ijbmi.org 24 | P a g e 6 Health Care 8 315.0 343.0 275.0 900.0 1,833.0 Ports 61 86.0 1,745.3 4,304.8 74,902.1 81,038. 2 Railways 4 - 102.2 873.0 594.3 1,569.6 Roads 405 4,364.6 11,696.5 38,520.5 122,143.3 176,72 4.9 Tourism 50 1,132.6 1,503.5 800.0 1,050.0 4,486.1 Urban Developme nt 152 2,812.0 3,136.9 6,688.2 16,838.0 29,475. 0 Total 758 9,471.9 19,826.9 55,307.5 298,725.8 383,33 2.1 Table 10: PPP Projects V. CONCLUSION Thus we can see that there is a drastic change in the Indian Economy since Independence and a lot has been done towards the development of the Nations’ Infrastructure but still a lot more needs to be done so that India can get a stature globally and can move on the path of development. According to the report published by the standards and poor’s, it is said that lack of infrastructure on the face of Transport and lack of funding is a hindrance to the growth of Indian Economy. The report clearly says that the inadequate infrastructure is a major roadblock for the country’s economic development and if the same condition prevails the forecasted economic growth for the coming twelfth five-year plan would be impossible to achieve.Thus we can say that India’s Infrastructure is definitely not a boon for the economy though is not also a bane as it has the potential to be changed and if changed it can change the face of the economy as a whole. Appendix 1 (List of Table) Table 1: Sectorwise Plan for 1st Five year Plan.......................................................................................................9 Table 2: India's GDP ............................................................................................................................................ 10 Table 3: GDP Contribution (Sectorwise) Post LPG ............................................................................................... 11 Table 4: Workforce Distribution ........................................................................................................................... 11 Table 5: Electricity Production in India................................................................................................................. 12 Table 6: Planned generation of energy in 11th Five Year Plan ............................................................................... 12 Table 7: Percentage penetration of Internet in India.............................................................................................. 15 Table 8: Source of Equity Financing..................................................................................................................... 21 Table 9: Sources of Debt Financing ...................................................................................................................... 22 Table 10: PPP Projects ......................................................................................................................................... 24 Appendix 2 (List of Figures) Figure I: Sectorwise Plan for 1st Five year Plan ......................................................................................................8 Figure II: Timeline ............................................................................................................................................... 10 Figure III: India's GDP......................................................................................................................................... 10 Figure IV: GDP Contribution (Sectorwise) ........................................................................................................... 11 Figure V: Workforce Distribution Sector Wise (Post LPG)................................................................................... 11 Figure VI: Ownership Structure for Energy........................................................................................................... 12 Figure VII: Demand Supply Gap .......................................................................................................................... 13 Figure VIII: Electricity Shortage (in Percent)........................................................................................................ 13 Figure IX: Road Length........................................................................................................................................ 14 Figure X: Telephone Connnections....................................................................................................................... 15 Figure XI: % Penetration of Internet ..................................................................................................................... 16 Figure XII: Internet user base in India................................................................................................................... 16 Figure XIII: Railway Route Length in India.......................................................................................................... 17 Figure XIV: Revenue Earnings for Railways......................................................................................................... 17 Figure XV: Number of Ship Counts in India ......................................................................................................... 18 Figure XVI: GRT and DWT Capacity................................................................................................................... 18 Figure XVII: Hours Flown.................................................................................................................................... 19 Figure XVIII: Passengers Flown........................................................................................................................... 19 Figure XIX: Aircraft Operation............................................................................................................................. 20 Figure XX: Flying Details of International and Domestic Flights........................................................................... 20
  • 19. India Infrastructure: A Boon… www.ijbmi.org 25 | P a g e Figure XXI: Ports in India .................................................................................................................................... 21 Figure XXII: Sources of Equity Financing ........................................................................................................... 22 Figure XXIII: Sources of Debt Financing.............................................................................................................. 22 REFERENCE Online Resources [1] Planning Commission, http://www.planningcommission.nic.in [2] Government of India, http://finance.yahoo.com [3] Ministry of Finance, http://finmin.nic.in/ [4] Ministry of Railway, http://www.indianrailways.gov.in/railwayboard/ [5] Centre for Monitoring Indian Economy Database, CMIE Database [6] Secretariat for Infrastructure, Planning Commission, http://infrastructure.gov.in/ [7] Reserve Bank of India, http://www.rbi.org.in/ [8] Business Update, http://business.gov.in/default.php [9] United Nations Development Programme in India, http://www.undp.org.in/ [10] Public Private Partnership in India, http://www.pppinindia.com/ [11] Ministry of Commerce, http://commerce.nic.in/ [12] Ministry of Road Transport and Highway, http://morth.nic.in/ [13] Ministry of Transport and Civil Aviation, http://www.motca.gov.af/ [14] Ministry of Shipping, http://shipping.nic.in/ [15] Ministry of Power, http://powermin.nic.in/ [16] Wikipedia, http://www.wikipedia.org Organization Publications  Annual Report to the People on Infrastructure 2010-11, Planning Commission  Annual Report 2011-12 on The Working of State Power Utilities & Electricity Departments, Planning Commission  Approach Paper for the Twelfth Five Year Plan 2012-17, Planning Commission  Eleventh Five Year Plan (2007-12), Planning Commission  Mid Term Appraisal of the Eleventh Five Year Plan (2007), Planning Commission  Mid Term Appraisal of the Tenth Five Year Plan (2002-2007), Planning Commission  SCENARIOS: Shaping India's Futures, Planning Commission  Monitorable Targets & Milstones for 2010-11 INFRASTRUCTURE SECTOR, Planning Commission  Annual Report 2011, 10, 09, 08, 07 Planning Commission  Annual report 2011, 10, 09, Ministry of Finance  Union Budget 2012, 11, 10, Ministry of Finance  Railway Budget 2012, 11, 10, Ministry of Railway  Indian Infrastructure Report- Standard & Poor’s