Deployment of Debug and Trace for features in RISC-V Core
•
0 likes•5 views

https://www.irjet.net/archives/V9/i7/IRJET-V9I7388.pdf

Recommended
Recommended
More Related Content
Similar to Deployment of Debug and Trace for features in RISC-V Core
Similar to Deployment of Debug and Trace for features in RISC-V Core (20)
More from IRJET Journal
More from IRJET Journal (20)
Recently uploaded
Recently uploaded (20)
Deployment of Debug and Trace for features in RISC-V Core
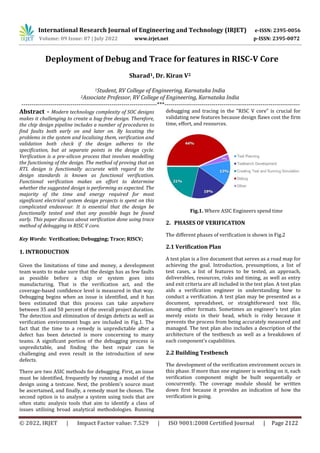
- 1. International Research Journal of Engineering and Technology (IRJET) e-ISSN: 2395-0056 Volume: 09 Issue: 07 | July 2022 www.irjet.net p-ISSN: 2395-0072 © 2022, IRJET | Impact Factor value: 7.529 | ISO 9001:2008 Certified Journal | Page 2122 Deployment of Debug and Trace for features in RISC-V Core Sharad1, Dr. Kiran V2 1Student, RV College of Engineering, Karnataka India 2Associate Professor, RV College of Engineering, Karnataka India ---------------------------------------------------------------------***--------------------------------------------------------------------- Abstract - Modern technology complexity of SOC designs makes it challenging to create a bug-free design. Therefore, the chip design pipeline includes a number of procedures to find faults both early on and later on. By locating the problems in the system and localising them, verification and validation both check if the design adheres to the specification, but at separate points in the design cycle. Verification is a pre-silicon process that involves modelling the functioning of the design. The method of proving that an RTL design is functionally accurate with regard to the design standards is known as functional verification. Functional verification makes an effort to determine whether the suggested design is performing as expected. The majority of the time and energy required for most significant electrical system design projects is spent on this complicated endeavour. It is essential that the design be functionally tested and that any possible bugs be found early. This paper discuss about verification done using trace method of debugging in RISC V core. Key Words: Verification; Debugging; Trace; RISCV; 1. INTRODUCTION Given the limitations of time and money, a development team wants to make sure that the design has as few faults as possible before a chip or system goes into manufacturing. That is the verification act, and the coverage-based confidence level is measured in that way. Debugging begins when an issue is identified, and it has been estimated that this process can take anywhere between 35 and 50 percent of the overall project duration. The detection and elimination of design defects as well as verification environment bugs are included in Fig.1. The fact that the time to a remedy is unpredictable after a defect has been detected is more concerning to many teams. A significant portion of the debugging process is unpredictable, and finding the best repair can be challenging and even result in the introduction of new defects. There are two ASIC methods for debugging. First, an issue must be identified, frequently by running a model of the design using a testcase. Next, the problem's source must be ascertained, and finally, a remedy must be chosen. The second option is to analyse a system using tools that are often static analysis tools that aim to identify a class of issues utilising broad analytical methodologies. Running debugging and tracing in the "RISC V core" is crucial for validating new features because design flaws cost the firm time, effort, and resources. Fig.1. Where ASIC Engineers spend time 2. PHASES OF VERIFICATION The different phases of verification is shown in Fig.2 2.1 Verification Plan A test plan is a live document that serves as a road map for achieving the goal. Introduction, presumptions, a list of test cases, a list of features to be tested, an approach, deliverables, resources, risks and timing, as well as entry and exit criteria are all included in the test plan. A test plan aids a verification engineer in understanding how to conduct a verification. A test plan may be presented as a document, spreadsheet, or straightforward text file, among other formats. Sometimes an engineer's test plan merely exists in their head, which is risky because it prevents the process from being accurately measured and managed. The test plan also includes a description of the architecture of the testbench as well as a breakdown of each component's capabilities. 2.2 Building Testbench The development of the verification environment occurs in this phase. If more than one engineer is working on it, each verification component might be built sequentially or concurrently. The coverage module should be written down first because it provides an indication of how the verification is going.
- 2. International Research Journal of Engineering and Technology (IRJET) e-ISSN: 2395-0056 Volume: 09 Issue: 07 | July 2022 www.irjet.net p-ISSN: 2395-0072 © 2022, IRJET | Impact Factor value: 7.529 | ISO 9001:2008 Certified Journal | Page 2123 2.3 Writing Tests It's time to validate the DUT when the TestBench has been developed and integrated with the DUT. In CDV, the tests are first run at random until about 70% of coverage is obtained or there is no progress in the coverage over a one- day simulation. The coverage reports are analysed, and additional tests are written to fill in the gaps. Randomization is used in these tests to fill in the gaps. Finally, corner cases, or difficult-to-reach events, must be written in a directed verification style. Naturally, debugging is carried out concurrently with DUT fixes. Fig.2. Phases of Verification 2.4 Code Coverage To measure the efficiency of verification implementation and to check whether the testbench has exercised the design completely, code coverage is used. code coverage checks whether: lines of the DUT has been exercised. states in the FSM has been entered. paths within a block have been exercised. branches in Case have been entered. conditions in an if statement is simulated. Types of code coverage are: 2.4.1 Line Coverage: Number of statements (lines) covered in the simulation is measured by statement coverage. It is expected to be 100% for every project. 2.4.2 Block/Segment Coverage: The block which are covered by begin-end, if-else or always, group of statements are counted by the block coverage. 2.4.3 Branch / Decision / Conditional Coverage: Branch coverage will check the true or false of the branch like if-else, case and the ternary operator (? :) statements. The statements in these blocks are exercised by the applied stimulus. 2.4.4 Path Coverage: Different paths are created because of conditional statements, which diverts the flow of stimulus to the specific path. According to the applied stimulus the condition which is satisfied only under those expressions will execute, the path will be diverted according to that. Path coverage covers these paths. 2.4.5 Toggle Coverage Its the ratio of number of nodes toggled to the total number of nodes present. 2.4.6 Functional Coverage Functional coverage will check the overall functionality of the design. It can be done using system verilog. 2.5 Analyze Coverage At last analyzed both the functional coverage and code coverage report and taken necessary steps to achieve coverage goals and running different simulations with different seed values. The overall block diagram is shown in Fig.3. Fig.3. Block Diagram of Test 3. Debugging Finding and removing flaws is a meticulous process called debugging. When a DUT's outputs do not match expectations, a defect may exist in the DUT or occasionally in the testbench. Software tools called debuggers give verification and design engineers the ability to track a program's progress, pause, resume, and run it in interactive mode. The basic steps in debugging are: Recognize the existence of a bug.
- 3. International Research Journal of Engineering and Technology (IRJET) e-ISSN: 2395-0056 Volume: 09 Issue: 07 | July 2022 www.irjet.net p-ISSN: 2395-0072 © 2022, IRJET | Impact Factor value: 7.529 | ISO 9001:2008 Certified Journal | Page 2124 Determine the bug's origin. Find the source of the bug. Find a solution to the bug. After fixing it, test it. 3.1 Pass/Fail Every test simulation should terminate with the generation of a TEST FAILED or TEST PASSED report. It's known as self-checking. If a test fails, log files and a waveform viewer might aid in further debugging. 3.2 Log File The operation is recorded in a text log file. The appropriate information may be transmitted to log files using Display system tasks. Three categories make up the display group of system tasks: the display and write activities, the strobed monitoring duties, and the continuous monitoring jobs. 4. Debug by tracing The term "trace" describes the procedure of gathering data that demonstrates how a design's constituent parts are functioning, carrying out, and performing. The trace facilities that a target gives determine the traceability of that target. For instance, storing trace data on a target for subsequent analysis is only possible if the target has the necessary capacities. 4.1 Instruction Trace Information regarding a core's or processor's execution of instructions is produced via the instruction trace. In a straightforward example, if an instruction trace is enabled and a core runs a loop 10 times, the decoded instruction trace data will display the related loop code ten times as shown in Fig.4. Fig.4. Instruction Trace 4.2 Data Trace Data trace generates details about a core's or processor's data accesses. For instance, the data trace displays a load instruction together with the corresponding load location and value if a memory load instruction is executed and data trace is enabled. The Fig. 5 below illustrates how a data access would look in a data trace: Fig.5. Data Trace 4.3 Instrumentation Trace Operating System (OS), application, and system data are produced through instrumentation traces. The environment might push useful runtime data to the instrumentation trace source for later analysis, for instance, if an event happens when an application runs and instrumentation trace is enabled. 5. Post Simulation Check The data traced by the Trace encoder is not checked in the test itself, it is done by post simulation scripts. The trace data from the trace sink is decoded and the program flow is reconstructed using the test's elf file. The reconstructed trace program flow is then checked against the simulation program flow which comes from internal monitors. The trace on and trace off labels are inserted in the test. These labels are preserved in the elf file, which is then used by the post-sim checker to figure out when trace is enabled or disabled in the test. 6.Result The results from verification of test includes coverage report as shown in Table 1. Based on the coverage report values, it tells whether the debugging is required or not. The overall debug process is done to increase the coverage values. The Traced data in ASCII format is shown in Fig 6. The post simulation checker compares the traced data and the simulation data, if both are same, it reports a text message of OK as shown in Fig.7. Table -1: Coverage Values Line Conditional Toggle Branch 74.6 955/1279 71.19 729/1024 37.69 2205/5850 65.90 1144/1736
- 4. International Research Journal of Engineering and Technology (IRJET) e-ISSN: 2395-0056 Volume: 09 Issue: 07 | July 2022 www.irjet.net p-ISSN: 2395-0072 © 2022, IRJET | Impact Factor value: 7.529 | ISO 9001:2008 Certified Journal | Page 2125 Fig.6. Traced data in ASCII Format Fig.7. Post sim checker result 7.Future scope ASIC and FPGA sizes are getting bigger and bigger, which is increasingly complicating verification. Long verification is being caused by each tiny change in setup. Therefore, 50-70% of the resources allocated for chip development are now being absorbed by verification activities. The difficulty of verification further rises with the inclusion of the CPU in the SoC, Which requires a deep knowledge of architecture. Therefore effective ways of debugging i.e by tracing is required. 8.Conclusion The proper verification steps are defined which involves collecting coverage values and based on coverage value decided to debug. The debug by trace method is followed. The traced data is collected by tracing over the code, and in the post simulation part, the traced data (program counter values) from the trace encoder, is compared with the simulation data and it reports a message OK, if both are same and if there is any mismatch, it will show the report as error. REFERENCES [1] A. Waterman and K. Asanovi, “The risc-v instruction set manual volume i: User-level isa document version 2,” CS Division EECS Department University of California, 2017. [2] X. Z. Linlin Su, “A real-time interactive verification system for asic design,” IEEE, 2009. [3] A. S. Kuen-Jong Lee Chin-Yao Chang, “A unified test and debug platform for soc design,”IEEE 8th International Conference on ASIC, 2009. [4] K. V. A. B. Akshay Birari Piyush Birla, “A risc-v isa compatible processor ip,”IEEE, 2020. [5] D. S. V. D. Aneesh Raveendran Vinayak Baramu Patil, “A risc-v instruction set processor-micro-architecture design and analysis,” IEEE, 2016. [6] E. R. Wilmer Ramirez Marco Sarmiento, “A flexible debugger for a risc-v based 32-bit system-on-chip,” IEEE, 2020. [7] P. M. Kamran Rahmani Sudhi Proch, “Efficient selection of trace and scan signals for post-silicon debug,” IEEE, 2015. [8] Z. N. Fatemeh Refan Bijan Alizadeh, “Bridging presilicon and postsilicon debugging by instruction- based trace signal selection in modern processors,” IEEE, 2017.