IRJET- Fault Detection and Prediction of Failure using Vibration Analysis
•
0 likes•54 views

https://irjet.net/archives/V5/i6/IRJET-V5I6144.pdf

Recommended
Recommended
More Related Content
What's hot
What's hot (20)
Similar to IRJET- Fault Detection and Prediction of Failure using Vibration Analysis
Similar to IRJET- Fault Detection and Prediction of Failure using Vibration Analysis (20)
More from IRJET Journal
More from IRJET Journal (20)
Recently uploaded
Recently uploaded (20)
IRJET- Fault Detection and Prediction of Failure using Vibration Analysis
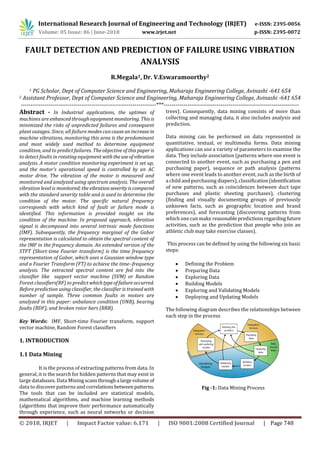
- 1. International Research Journal of Engineering and Technology (IRJET) e-ISSN: 2395-0056 Volume: 05 Issue: 06 | June-2018 www.irjet.net p-ISSN: 2395-0072 © 2018, IRJET | Impact Factor value: 6.171 | ISO 9001:2008 Certified Journal | Page 748 FAULT DETECTION AND PREDICTION OF FAILURE USING VIBRATION ANALYSIS R.Megala1, Dr. V.Eswaramoorthy2 1 PG Scholar, Dept of Computer Science and Engineering, Maharaja Engineering College, Avinashi -641 654 2 Assistant Professor, Dept of Computer Science and Engineering, Maharaja Engineering College, Avinashi -641 654 ---------------------------------------------------------------------***--------------------------------------------------------------------- Abstract - In Industrial applications, the uptimes of machines are enhancedthroughequipment monitoring. Thisis minimized the risks of unpredicted failures and consequent plant outages. Since, all failure modes cancauseanincreasein machine vibrations, monitoring this area is the predominant and most widely used method to determine equipment condition, and to predict failures. The objective of thispaperis to detect faults in rotating equipment withtheuseofvibration analysis. A motor condition monitoring experiment is set up, and the motor’s operational speed is controlled by an AC motor drive. The vibration of the motor is measured and monitored and analyzed using spectrum analysis. The overall vibration level is monitored;thevibrationseverityiscompared with the standard severity table and is used to determine the condition of the motor. The specific natural frequency corresponds with which kind of fault or failure mode is identified. This information is provided insight on the condition of the machine. In proposed approach, vibration signal is decomposed into several intrinsic mode functions (IMF). Subsequently, the frequency marginal of the Gabor representation is calculated to obtain the spectral content of the IMF in the frequency domain. An extended version of the STFT (Short-time Fourier transform) is the time frequency representation of Gabor, which uses a Gaussian window type and a Fourier Transform (FT) to achieve the time–frequency analysis. The extracted spectral content are fed into the classifier like support vector machine (SVM) or Random Forest classifiers(RF) to predict whichtypeoffailureoccurred. Before prediction using classifier, the classifier is trained with number of sample. Three common faults in motors are analyzed in this paper: unbalance condition (UNB), bearing faults (BDF), and broken rotor bars (BRB). Key Words: IMF, Short-time Fourier transform, support vector machine, Random Forest classifiers 1. INTRODUCTION 1.1 Data Mining It is the process of extracting patterns from data. In general, it is the search for hidden patterns that may exist in large databases. Data Miningscansthrougha largevolume of data to discover patterns and correlationsbetweenpatterns. The tools that can be included are statistical models, mathematical algorithms, and machine learning methods (algorithms that improve their performance automatically through experience, such as neural networks or decision trees). Consequently, data mining consists of more than collecting and managing data, it also includes analysis and prediction. Data mining can be performed on data represented in quantitative, textual, or multimedia forms. Data mining applications can use a variety of parameters to examine the data. They include association (patterns where one event is connected to another event, such as purchasing a pen and purchasing paper), sequence or path analysis (patterns where one event leads to another event, such as the birth of a child and purchasing diapers), classification(identification of new patterns, such as coincidences between duct tape purchases and plastic sheeting purchases), clustering (finding and visually documenting groups of previously unknown facts, such as geographic location and brand preferences), and forecasting (discovering patterns from which one can make reasonablepredictionsregardingfuture activities, such as the prediction that people who join an athletic club may take exercise classes). This process can be defined by using the following six basic steps: Defining the Problem Preparing Data Exploring Data Building Models Exploring and Validating Models Deploying and Updating Models The following diagram describes the relationships between each step in the process Fig -1: Data Mining Process
- 2. International Research Journal of Engineering and Technology (IRJET) e-ISSN: 2395-0056 Volume: 05 Issue: 06 | June-2018 www.irjet.net p-ISSN: 2395-0072 © 2018, IRJET | Impact Factor value: 6.171 | ISO 9001:2008 Certified Journal | Page 749 Defining the Problem The first step described in Fig -1, in the data mining process is to clearly define the business problem. This step includes analyzing business requirements, defining the scope of the problem, defining the metrics by which the model will be evaluated, and defining the final objective for the data mining project. Preparing Data The second step described in Fig -1, in the data mining process is to consolidate and clean the data that was identified in the Defining the Problem step. Data can be scattered across a company and stored in different formats, or may contain inconsistencies such as flawed or missing entries. Exploring Data The third step described in Fig -1, in the data miningprocess is to explore the prepared data. Exploration techniques include calculating the minimum and maximum values, calculating mean and standard deviations,andlookingatthe distribution of the data. After you explore the data, you can decide if the dataset contains flawed data, and then you can devise a strategy for fixing the problems. Building Models The fourth step described in Fig -1, in the data mining process is to build the mining models. Before you build a model, you must randomly separate the prepared data into separate training and testing datasets. You use the training dataset to build the model, and the testing dataset to test the accuracy of the model by creating prediction queries. Exploring and Validating Models The fifth step described in Fig -1, in the data mining process is to explore the models that you have built and test their effectiveness. Deploying and Updating Models The last step described in Fig -1, in the data mining process is to deploy to a production environment the models that performed the best. 1.2 Scope of Data Mining Automated prediction of trends and behaviors Data mining automates the process of finding predictive information in large databases. Questions that traditionally required extensive hands-on analysis can now be answered directly from the data — quickly. A typical example of a predictive problem is targeted marketing. Data mining uses data on past promotional mailings to identify the targets most likely to maximize return on investment in future mailings. Other predictive problems include forecasting bankruptcy and other forms of default, and identifying segments of a population likely to respond similarlytogiven events. Automated discovery of the previously unknown patterns Data mining tools sweep through databases and identify previously hidden patterns in one step. An example of pattern discovery is the analysis of retail sales data to identify seemingly unrelated products that are often purchased together. Other pattern discovery problems include detecting fraudulent credit card transactions and identifying anomalous data that could represent data entry keying errors. Data mining techniques can yield the benefits of automation on existing software and hardware platforms, and can be implemented on new systems as existing platforms are upgraded and new products developed. When data mining tools are implemented on high performance parallel processing systems, they can analyze massive databases in minutes. Faster processing means that users can automatically experiment with more models to understand complex data. High speed makes it practical for users to analyze huge quantities of data. Typically, these patterns cannot be discovered by traditional data exploration because the relationships are too complex or because there is too much data. Knowledge discovery in databases process, or KDD is relatively young and interdisciplinary field of computerscienceistheprocess of discovering new patterns from large data sets involving methods at the intersection of artificial intelligence,machine learning, statistics and database systems. The goal of data mining is to extract knowledge from a data set in a human- understandable structure. Data mining is the entire process of applying computer-based methodology, including new techniques for knowledge discovery, from data. Databases, Text Documents, Computer Simulations, and Social Networks are the Sources of Data for Mining. 1.3 Data Mining Techniques The most important data techniques are Decision Trees Decision tree algorithms (Quinlan1993;Breiman et al. 1984) are a very popular class of learning algorithms for classification tasks. Tree-shaped structures are represented the sets of decisions. Decision tree algorithms are very popular. The main reason for this is that the induced decision tree model is easy to understand. These decisions generate rules for the classification of a dataset. Specific decision tree methods include Classification and Regression Trees (CART) and Chi Square Automatic Interaction Detection (CHAID).
- 3. International Research Journal of Engineering and Technology (IRJET) e-ISSN: 2395-0056 Volume: 05 Issue: 06 | June-2018 www.irjet.net p-ISSN: 2395-0072 © 2018, IRJET | Impact Factor value: 6.171 | ISO 9001:2008 Certified Journal | Page 750 Genetic Algorithms Optimization techniques that use process such as genetic combination, mutation, and natural selection in a design based on the concepts of evolution. Artificial Neural Networks An ANN is composed of an interconnected set of nodes that includes an input layer, zero or more hidden layers, and an output layer. The links between nodes have weights associated with them. Non-linear predictivemodels are learning through training and resemblebiological neural networks in structure. Nearest Neighbor Method Nearest neigh borealgorithmsaretypicallyusedfor classification tasks, although they can also be used for regression tasks. These algorithms also have a great deal of expressive power. Nearest neigh bore algorithms generate no explicit model and hence have no training time. Support Vector Machines A support vector machine (SVM) is a supervised learning technique from the field of machine learning applicable to both classification and regression. Rooted in the Statistical Learning Theory developed by Vladimir Vapnik and co-workers at AT&T Bell Laboratories in 1995, SVMs are based on the principle of Structural Risk Minimization. • Non-linearly map the input space into a very high dimensional feature space (the “kernel trick”). • In the case of classification, construct an optimal separating hyperplane in this space (a maximal margin classifier); or • In the case of regression, perform linear regression in this space, but without penalizing small errors. Random Forest Random forest or random decision forests are an ensemble learning method for classification, regression and other tasks, that operate by constructing a multitude of decision trees at training time and outputting the class that is the mode of the classes (classification) or meanprediction (regression) of the individual trees.Randomdecisionforests correct for decision trees' habit of over fitting to their training set. The first algorithm for random decision forests was created by using the random subspace method, which, in Ho's formulation, is a way to implement the "stochastic discrimination" approach to classification proposed by Eugene Kleinberg. An extension of the algorithm was developed by Leo Breiman and Adele Cutler, and Random Forests is their trademark. The extension combines Breiman's "bagging" idea and random selection of features, introduced first by Ho[1] and later independently by Amit and Geman in order to construct a collection of decision trees with controlled variance. Rule Induction The extraction of useful if-then rules from data based on statistical significance 1.4 Introduction to Vibration Analysis for Predictive Maintenance Industrial vibration analysis is a measure to detect, predict, and prevent failures in rotating machinery. Analysis programs are used throughout worldwide industries to detect faults in machinery, plan machinery repairs, and keep machinery functioning foras long as possiblewithoutfailure. Machines Machines include motors, pumps, fans, gear boxes, compressors, turbines, conveyors, rollers, engines, and machine tools that have rotational elements.Theseelements produce vibrations at particularfrequenciesthatidentify the rotating elements. The amplitude of the vibration indicates the performance of machine. An increase in the vibration amplitude is a result of failing rotational elements such as bearings or gears. Based on the machine speed, the rotational frequenciescanbe calculatedandcomparedtothe measurements to identify the failure mode. Types Induction Motor Single Phase Induction Motor Split phase induction motor Capacitor start induction motor Capacitor start capacitor run induction motor Shaded pole induction motor Three Phase Induction Motor Squirrel cage induction motor Slip ring induction motor When the machine starts running automatically without any external force to the machine, then it iscalledas self-starting. For example we see that when we put on the switch the fan starts to rotate automatically, so it is self- starting. Point to be noted that fan used in home appliances is single phase induction motor which is inherently not self- starting.
- 4. International Research Journal of Engineering and Technology (IRJET) e-ISSN: 2395-0056 Volume: 05 Issue: 06 | June-2018 www.irjet.net p-ISSN: 2395-0072 © 2018, IRJET | Impact Factor value: 6.171 | ISO 9001:2008 Certified Journal | Page 751 Finding Problems with Bearings and Rotating Equipment Using Vibration Analysis Bearings with rolling elements generate several frequencies which can be calculated and detected if you know the physical dimensions of the bearings and the RPM at which they are running. These frequencies can be recorded with an accelerometer and a spectrum analyzer. Many companies sell equipment and software for trending of these data. When there is a difference from bearing fault frequencies, a person experienced in reading these printed charts and trends can predict when a bearing may fail. Four Stages in Bearing Failure Are Detected with Vibration Analysis. The first stage (normal operation) appears at ultrasonic frequencies from about1,200Kto3,600K CPM (cycles per minute). At this point the frequencies are evaluated by Spike Energy and Shock pulse instruments which listen to these frequencies. Trending this information can tell a person if there is a change or not. The second stage of bearing failure defects begin to ring bearingcomponentsnatural frequencies,which are picked up with a spectrum analyzer in the middle of the spectrum, 3OK-12OK CPM. In the third stage of failure, bearing defect frequencies and harmonics appear on thespectrum as BEARING DEFECT FREQUENCIES. At this time if you remove the bearing, you can see the defects in the rolling elements. Stage four appears toward the end of bearing life. It shows up as random high frequency vibration spikes on the spectrum, all running together. With vibration analysis, many other problems with rotating equipment can be diagnosed without taking equipment out of service. This can savehoursofdowntimeandthousandsof dollars. 1.5 METHOD OF DETECTION OF THE FAULT IN INDUCTION MOTORS Global Analysis This type of measure is easy to use and it’s efficient for the detection of the defect level. The generally used value is the vibratory amplitude that permits to situate the defect in relation to a level of alert but doesn't inform on the origin of the problem. Therefore the global analysis consists in measuring the value efficient of the vibratory signal and to compare it at thresholds defined by norms (standards) that depend on the power of the machine and the industrial sector. The Spectral Analysis The temporal signals are often uncertain and therefore difficult signals to analyze; on the other hand, their spectra are very simple and easy to exploit. This type of measure permits to distribute the vibratory energy according to the frequency and to give different amplitudes for different frequencies. We will notice that a type of defect always occurs to a particular frequency. Thus, according to the amplitude at a certain frequency, we will be able to determine of where comes the defect. The spectral measure is used therefore to diagnose the origin of electrical and the unbalance defects. Envelope Analysis The envelope detection (amplitude demodulation) is consisted in filtering pass-band of temporal signal, and then performs the Fourier transform of the signal obtained envelope. The method thus allows overcoming the low frequency interference signals issued by other defectsofthe machine (unbalance, misalignment, etc...), and to keep only the signals emitted by the defects of the bearings (high frequency). It’s better thanspectral analysisforthedetection of bearing defects. Gabor Filter Approach The Gabor filter was originally introduced by Dennis Gabor; we used it for 2D images (CT images). The Gabor function has been recognized as a very useful tool in computer vision and image processing, especially for texture analysis, due to its optimal localization properties in both spatial and frequency domain. The image presentation based on Gabor function constitutes an excellent local and multi-scale decomposition in terms of logons that are simultaneously (and optimally) localization in space and frequency domain. A Gabor filter is a linear filter whose impulse response is defined by a harmonic function multiplied by a Gaussian function. Because of the multiplicationconvolutionproperty (Convolution theorem), the Fourier transform of a Gabor filter's impulse response is the convolution of the Fourier transform of the harmonic function and the Fourier transform of the Gaussian function. 2. ANALYSIS 2.1 Existing Model The Existing System is used to minimize the risks of unpredicted failures and consequent plant outages through equipment monitoring. Since, all failure modes cancausean increase in machine vibrations, monitoring this area is the predominant and most widely used method to determine equipment condition and to predict failures. A motor condition monitoring experiment is set up and the motor’s operational speed is controlled by an AC motor drive. The vibration of the motor is measured and monitored. The
- 5. International Research Journal of Engineering and Technology (IRJET) e-ISSN: 2395-0056 Volume: 05 Issue: 06 | June-2018 www.irjet.net p-ISSN: 2395-0072 © 2018, IRJET | Impact Factor value: 6.171 | ISO 9001:2008 Certified Journal | Page 752 measured vibration data is analyzed using spectrum analysis. The overall vibration level is monitored; the vibration severity is compared with the standard severity table and is used to determine the condition of the motor. The specific natural frequency corresponds with whichkind of fault or failure mode is identified. This information is provided insight on the condition of the machine. Drawbacks Less Efficiency. Difficult to control the motor speed. 2.2 Proposed Model The Proposed system is used fordetectingfaultsinmotorsin steady-state operation based on the analysis of vibration signals. In proposed approach, vibration signal is decomposed into several intrinsic mode functions (IMF). Subsequently, the frequency marginal of the Gabor representation is calculated to obtain the spectral content of the IMF in the frequency domain. An extended versionof the STFT (Short-time Fourier transform) is the time frequency representation of Gabor,whichusesa Gaussianwindowtype and a Fourier Transform (FT) to achieve thetime–frequency analysis. The extracted spectral content are fed into the classifier like support vector machine (SVM) or Random Forest classifiers(RF) to predict which type of failure occurred. Before prediction using classifier, the classifier is trained with number of sample. Three common faults in motors are analyzed in this project: unbalance condition (UNB), bearing faults (BDF), and broken rotor bars (BRB). Merits Increase fault detect ability. Reduce interferences. Reducing the Maintenance cost. 2.3 Proposed Architecture Fig -2: Proposed Architecture 2.4 INTRODUCTION TO MATLAB MATLAB was first adopted by researchers and practitioners in control engineering, It is now also used in education, in particular the teaching of linear algebra and numerical analysis, and is popular amongst scientists involved in imageprocessing.Moreover,MATLABshouldnot be used to simulate computer architectures, systems software and computer networks unless while solvingsome numeric problem. MATLAB Features Simple programming environmentincludingcontrol structures like loops and selections Linear algebraic system solvers for vectors, matrices and functionality like computing products and inverses, scaling, summing, multiplications, factorizations, and so on Simple graphic interface for visualization and simulation. Open component system based on toolboxes which can be created, modified, customized and shared by the users High-level language for technical computing Development environment for managingcode,files, and data Interactive tools for iterative exploration, design, and problem solving Mathematical functions for linear algebra, statistics, Fourier analysis, filtering, optimization, and numerical integration 2-D and 3-D graphics functions for visualizing data Tools for building custom graphical user interfaces .Functions for integrating MATLAB based algorithms with external applications and languages, such as C, C++, Fortran, Java, COM, and Microsoft Excel Development Environment(5:02) Ability to zip and unzip files and folders in the Current Folder browser to simplify sharing of files New visual cues in the Current Folder browser to show directories on the MATLAB path Enhanced tab completion in the MATLAB Editor with support for local variables, sub functions, and nested functions Expanded access in the plot selector to plots from the Curve Fitting, Filter Design, Image Processing, and Signal Processing Toolboxes Enhanced File and Folder Comparison Tool, highlighting changes within lines in file comparisons, and sorting results by name, type, size, or timestamp in folder comparisons Performance and Large Data Set Handling Multithreaded computation support for longvector fft, conv2, integer conversion, and integer arithmetic functions Performance improvements for mrdivide, convn, histc, sortrows, and sparse matrix indexed assignment
- 6. International Research Journal of Engineering and Technology (IRJET) e-ISSN: 2395-0056 Volume: 05 Issue: 06 | June-2018 www.irjet.net p-ISSN: 2395-0072 © 2018, IRJET | Impact Factor value: 6.171 | ISO 9001:2008 Certified Journal | Page 753 3. DESIGN Module Vibration data analysis Classify the faults by support vector machine classifier and random forest classifier Performance Analysis Module Description In this section, the audios are given as inputintothe Gabor filter which is used to filter the input audios. The Support Vector Machine (SVM) and Random Forest (RF) classifiers are presented to classify the given audio. The 11 Numbers of audios are given as inputs which contain 4 Numbers of unbalanced condition motor audio, 4 Numbers of bearing faults motor audio and 3Numbersofbrokenrotor audio. The experimental result demonstrates, the proposed Random Forest (RF) algorithm is provided good performance through the performance metrics such as accuracy, precision and recall. 3.1 Vibration Data Analysis An extended version of the STFT (Short-time Fourier transform) is the time–frequency representation of Gabor which uses a Gaussian window type and a Fourier Transform (FT) to achieve the time–frequency analysis. The representation of Gabor has a trade off drawback as the STFT caused by the fixed width of the window; however it has better resolution in frequency than the STFT. The representation of Gabor is described by the following equation, (1) As in the continuous case, the discrete representation of Gabor is identical to discrete STFT, with the particular characteristic of the Gaussian window. The discrete representation of Gabor can expand as a linear combination of Gabor coefficients and basic functions. For a finite set of data x[n], the Gabor expansion is obtained from, (2) In the above equation, the array , denotes periodic in k and with period K. The sequence g(n) is known as the synthesis window. The array of Gabor coefficients , can be found by the representation of Gabor, (3) In equation 3, the sequence is the analysis window. The Zak transform is used to obtain the Gabor coefficients. The discrete Zak transform of a periodical window is defined as one dimensional discrete Fourier transform of the sequence . (4) Equation 4, are represented as adjustment parameters, is the period, is the sample length. Frequency marginal of a time–frequencyrepresentation The marginal’s of the time–frequency representations can provide important information about the signal as the instantaneous frequency or spectral power density. For the case of a time–frequency representationcan be considered the calculation of two marginal’s. A marginal associated to the time and other to the frequency. These marginal’s are defined as, (5) (6) In the above equation, is the time marginal, is the frequency marginal, is the time–frequency representation, is the time and is the frequency. This means that by integrating the representational on gone variable, the energy is distributed along the other variable. The marginal obtained by integrating with respect to the frequency is the time marginal and corresponds to the instantaneous power of the signal. Integrating the time– frequency representation along to the time is obtained the frequency marginal and this corresponds to the energy spectral density, (7) (8) Complete Ensemble Empirical Mode Decomposition The Complete Ensemble Empirical Mode Decomposition (CEEMD) is a noise-assisted method, having the following procedure, First, a fixed percentage of Gaussian white noise is added to the target signal to obtain the first Empirical Mode De- composition (EMD) component of the data with noise. The decomposition is repeated I times using different noise realizations. Then, it is computed the ensemble average to define it as the first IMF1 of the target signal. Then, (9) Where IMF1 is the firstEMDcomponentofthetarget signal x (t), is zero-mean Gaussian white noise with unit variance, ε is a fixed coefficient, produces the ith IMF component and I is the number of realizations.
- 7. International Research Journal of Engineering and Technology (IRJET) e-ISSN: 2395-0056 Volume: 05 Issue: 06 | June-2018 www.irjet.net p-ISSN: 2395-0072 © 2018, IRJET | Impact Factor value: 6.171 | ISO 9001:2008 Certified Journal | Page 754 Then the first signal residue r1 is calculated as follows (10) Next, decompose realizations are carried out until they reach their first IMF conditionsand definetheensembleaverage as the second IMF2. (11) For k=2,3,.....k the k th residue is calculated: ,thenthefirstIMF componentof is extracted and their ensemble average is computed again to obtain of the target signal: (12) The sifting process is continued until the last residue does not have more than two extrema, producing (13) Where R is the final residual and K is the total number of IMF. Therefore, the target signal can then be expressed as +R (14) The previous equation makes the CEEMD a complete decomposition method, and compared with EMD and EEMD methods, the CEEMD not only solves the mode mixing problem, but also providesanexactreconstructionof the original signal. 3.2 Classify the Faults by Support Vector Machine (SVM) and Random Forest (RF) Classifiers The both Support Vector Machine (SVM) and Random Forest (RF) Classifiers are used to classify the vibration signals. Support Vector Machine (SVM) The initial idea of SVM is to use a linear separating hyper plane to divide the training samples into two classes. Generally, there are two types of methods suitable to accomplish this task. The first one is finding out the optimal decision hyper plane which bisects the two closest samples into two convex hulls. The second one is to research the optimal decision hyperplane which makes the margin between the two parallel supporting planes maximum. Both these two methods can produce the optimal decision hyperplane and the support points (support vectors). Linear classification The linear classification function of SVM is used to separate the training data into two classes with a linear separating hyperplane. The SVM tries to put a linear boundaryinthemiddle of the two classes. The maximum margin is represented as the distance between two imaginary lines. The points, located on the imaginary lines, are called support vectors. Support vectors are the most significant samples as they contain all the information used to design the classifier. The training data represented by, (15) can be divided by a hyperplane equation, (16) If hyperplane, can make sure the distance between different classes of samples is maximum, this hyperplane is the optimal hyperplane. We can explain the separating hyperplane using the form below, (17) (18) Or equivalently (19) Then the problem of searching for the optimal hyperplane could be transferred into the problem of obtaining the minimum of the function below subject to the constraints in the below equation, (20) Therefore, the optimal hyperplane can be obtained by solving a simple quadratic programming problem. According to the optimization theory of convex quadratic pro- gramming method, this problem can be solved by converting it into a Wolfe dual problem.Lagrangefunctionis constructed in the below equation, (21) is represented the Lagrange multiplier, which should satisfy the constraint . When condition (20) reaches its extremum, the corresponding points should satisfy in below two equations, (22) (23)
- 8. International Research Journal of Engineering and Technology (IRJET) e-ISSN: 2395-0056 Volume: 05 Issue: 06 | June-2018 www.irjet.net p-ISSN: 2395-0072 © 2018, IRJET | Impact Factor value: 6.171 | ISO 9001:2008 Certified Journal | Page 755 Substitute the above equations into Lagrange function and eliminate w and b. (24) The above equation should under the constraint and . Those with are termed support vectors (SVs). The label of a testing data can then be obtained by, (25) Where (26) Non-linear classification Non-linear is always caused by nonlinearities or noise, which is the source of non-linear data. In the case of the training samples are not linearly separable, Cortes introduced non negative variables and penalty function in order to promote the optimal hyper planetogeneral situation. (27) The general classification hyper plane is minimum value of Eq (27) under the constrain (28). (28) The condition can decide the value of the penalty term(c).The formula used in the Non-linear SVM is the same as the one used in the linear SVM, but the constraint α is different, which shouldsatisfytheconstrain0rαirC.Based on the theory of functional, as long as a kernel function satisfy the Mercer condition, it is the inner product of one transformationspace. Therefore,usinganappropriate inner product function in the optimal classification plane can achieve linear classification after a nonlinear transformation and the computational complexity is not increased. The objective function is represented below. (29) The kernel is always used in input space because it can map the input samples into feature space and apply dot product in that space. There are many different kinds of kernel, such as Polynomial Kernel Function, Linear Kernel Function, Sigmoid Kernel Function and Radian Basis Function (RBF), which are commonly used. Random Forest Classifier The random forest (RF) model is based on the grouping of trees for classification and regression (CART) and introduced by Breiman. The method is based on the tree- type classifier. Each tree classifier is named a component predictor. A large number tree makes RF from sub-dataset. Random Forest (RF) tool is one of the widely used classifiers in data mining techniques due to its accuracy among other learning algorithm. RF can improve classification accuracy resulting from growing an ensemble of trees and making them vote for the most promising class. A convenient method to build the ensembles is by random vectors which are generated via random selection procedure from integrated training set. The constituent in this method is that we prepare k random vectors, , which are independent of the past random vectors , , ,.......... but with the same distribution to construct the trees among the RF. The corresponding individual classifier is noted by C (X, ). For example,inthe bagging processing the random vector as the N observations randomly draws out from entire training data proportionally where N is the number of observations of training data. And they vote for the most popular class. It is more efficient when working with large database. RF is a combination of many decision trees. Decision trees are grown by a binary partitioning method to make easy interpretation. The tree should be grown with the followingconditions: Number of training sets be ‘N’ and variables in the classifier be ‘M’. Let ‘m’ be the input variable which is used to find the decision at the node, with m M. Training case ‘N’ is replaced by ‘n’ times and also choose ‘m’ variable random out of the ‘M’ at each node of the tree. Best split is used at the nodes. The value ‘m’ should be maintained constantly while growing the forest. Each tree is grown to maximum extent. The error rate of the forest is based on the correlationof the two trees and strength of the individual tree. Generalization error is defined as Where - is an average correlation among the trees. S is a measure of strength of tree classifier. 3.3 Performance Analysis Fault diagnose is methods based on SVM regard the diagnosis problem as a classification one. They use the Vibration dataset for each fault and run time faults to train the classifiers and predicts the faults. Three common faults in motors are analyzed in this project: unbalance condition (UNB), bearing faults (BDF) and broken rotor bars (BRB).
- 9. International Research Journal of Engineering and Technology (IRJET) e-ISSN: 2395-0056 Volume: 05 Issue: 06 | June-2018 www.irjet.net p-ISSN: 2395-0072 © 2018, IRJET | Impact Factor value: 6.171 | ISO 9001:2008 Certified Journal | Page 756 4. RESULTS This section is demonstrated the performance of support vector machine (SVM) and random forest (RF) classifier to know the effectiveness of the proposed methodology. Both SVM and RF classifiers are evaluated in terms of accuracy, precision and recall. The experimental result shows, the RF provides the better performance than the SVM. Description of Collected Data The following number of data is collected as inputs which are 11 Numbers of audios, 4 Numbers of unbalanced condition motor audio, 4 Numbers of bearing faults motor audio and 3 Numbers of broken rotor audio . 4.1 Accuracy The Accuracy of the system is calculated via the values of the True Negative, True Positive, False Positive, False negative actual class and predicted class outcome it is defined as follows, Fig -3: Comparison of Accuracy Figure 3 shows thecomparisonofaccuracybetween support vector machine (SVM) and random forest (RF) classifier in terms of accuracy values. The proposed RF is provided the accuracy of 0.9091 values and the SVM is provided the accuracy of 0.8182 values. 4.2 Precision Precision is defined as the fraction of accurate predicted results from the input. Fig -4: Comparison of Precision Figure 4 shows the comparison of precision between support vector machine (SVM) and random forest (RF) classifier in terms of precisionvalues.Theexperimental result shows the performance of the random forest (RF) classifier is provided better performance in predicting the fault. 4.3 Recall The recall or true positive rate (TP) isdefinedasthe percentage of positive cases that were accurately identified, as calculated using the equation: Fig -5: Comparison of Recall Figure 5 shows the comparison of recall between support vector machine (SVM) and random forest (RF) classifier in terms of recall values. The experimental result shows the performance of the random forest (RF) classifier is provided better performance than the support vector machine (SVM) classifier.
- 10. International Research Journal of Engineering and Technology (IRJET) e-ISSN: 2395-0056 Volume: 05 Issue: 06 | June-2018 www.irjet.net p-ISSN: 2395-0072 © 2018, IRJET | Impact Factor value: 6.171 | ISO 9001:2008 Certified Journal | Page 757 Table 1 Comparison of Accuracy, Precision and Recall Classifiers Accuracy Precision Recall SVM 0.8182 0.7500 0.7500 RF 0.9091 0.8000 1 5. CONCLUSIONS AND FUTURE WORK 5.1 Conclusion The proposed work is demonstrated the feasibility of detecting faults, such as broken rotor bars, defects in bearings or mechanical unbalance, in induction motors operating at steady-state by analyzing acoustic sound signals. The results using vibration signals corroborate the ones based on acoustic sound signals. The use of CEEMD helps to separate the signal into IMF. It is possible to select those specific IMF that contain thenecessaryinformationfor detecting the faults and eliminating, at the same time, undesirable signal components. CEEMD is used as a preprocessing stage and improves the estimation of the spectrum obtained by calculating the frequency marginal. The choice of calculating the marginal frequency of the Gabor representation is justified by the following facts: (i) it has a better noise tolerance than the FFT; (ii) the resulting spectrum is smoothed, which eases his interpretation; (iii) there are less spurious frequencies, which is a disadvantage present in other methods. As a result, the characteristics of the obtained spectra facilitate the observation and identification of spectral components associated with the analyzed faults. This methodology proves to be extremely useful in cases where the acoustic sound or vibration signals are the only signals available. Additionally, the analysis of acoustic sound signals is a non-invasive technique, resulting in a great advantage since it is not necessary to intervene in any way with the operation of the motor. Based on the obtained results, the proposed methodology could be used to identify other types of faults in induction motors and generally, in any equipment in which the sound and vibrations are emitted as an unequivocal consequence of malfunctioning. 5.2 Future Work However, the proposed methodology has some limitations. The first one is associated with the use of the CEEMD. It is not possible to know a priori the number of modes in which the signal is decomposed and which mode or IMF will contain the spectral components of interest either. All this makes necessary to analyze each IMF, or most of them, to identify the spectral content. There isanotherlimitationthat is also present in many works related to fault detection in IM. The localization of fault frequencies depends on the knowledge of the motor speed or the slip. In field applications, motor speedis notalwaysavailable,anditmust be estimated through the identification of the principal slot harmonics or the frequency components associated to mixed-eccentricity. REFERENCES [1]. Dalvand, F., Dalvand, S., Sharafi, F., & Pecht, M. (2017), ‘Current Noise Cancellation for Bearing Fault Diagnosis Using Time-Shifting’, IEEE Transactions on Industrial Electronics, 64 (10), 8138-8147. [2]. Gao, Z., Colby, R. S., Turner, L., & Leprettre, B. (2011), ‘Filter design for estimating parameters of induction motors with time-varying loads’, IEEE Transactions on Industrial Electronics58 (5),1518- 1529. [3]. Henao, H., Fatemi, S. M. J. R., Capolino, G. A., & Sieg- Zieba, S. (2011), ‘Wire rope fault detection in a hoisting winch system by motor torque andcurrent signature analysis’ ,IEEE Transactions onIndustrial Electronics, 58(5), 1727-1736. [4]. Immovilli, F., & Cocconcelli, M. (2017), ‘Experimental Investigation of Shaft Radial Load Effect on Bearing Fault Signatures Detection’, IEEE Transactions onIndustryApplications, 53(3),2721- 2729. [5]. Ince, T., Kiranyaz, S., Eren, L., Askar, M., & Gabbouj, M. (2016), ‘Real-time motor fault detection by 1-D convolutional neural networks’, IEEE Transactions on Industrial Electronics, 63(11), 7067-7075. [6]. Kim, B., Lee, K., Yang, J., Lee, S. B., Wiedenbrug, E. J., & Shah, M. R. (2011), ‘Automated detection of rotor faults for inverter-fed induction machines under standstill conditions’ ,IEEE Transactions on Industry Applications, 47(1), 55-64. [7]. Rabbi, S. F., Little, M. L., Saleh, S. A., & Rahman, M. A. (2017), ‘A Novel Technique Using Multiresolution Wavelet Packet Decomposition for Real Time Diagnosis of Hunting inLineStartIPMMotorDrives’ ,IEEE Transactions on Industry Applications, 53(3), 3005-3019. [8]. Sapena-Bano, A., Burriel-Valencia, J., Pineda- Sanchez, M., Puche-Panadero, R., & Riera-Guasp, M. (2017), ‘The Harmonic Order Tracking Analysis Method for the Fault Diagnosis in Induction Motors under Time-Varying Conditions’, IEEETransactions on Energy Conversion, 32(1), 244-256. [9]. Sapena-Bano, A., Pineda-Sanchez, M., Puche- Panadero, R., Martinez-Roman, J., & Kanović, Ž. (2015), ‘Low-cost diagnosis ofrotorasymmetriesin
- 11. International Research Journal of Engineering and Technology (IRJET) e-ISSN: 2395-0056 Volume: 05 Issue: 06 | June-2018 www.irjet.net p-ISSN: 2395-0072 © 2018, IRJET | Impact Factor value: 6.171 | ISO 9001:2008 Certified Journal | Page 758 induction machines working at a verylowslipusing the reduced envelope of the stator current’ ,IEEE Transactions on Energy Conversion, 30(4), 1409- 1419. [10]. Sapena-Bano, A., Riera-Guasp, M., Puche-Panadero, R., Martinez-Roman, J., Perez-Cruz, J., & Pineda- Sanchez, M. (2016), ‘Harmonic order tracking analysis: A speed-sensorless method for condition monitoring of wound rotor induction generators’, IEEE Transactions on Industry Applications, 52(6), 4719-4729. [11]. Sapena-Bano,Angel,Manuel Pineda-Sanchez,Ruben Puche-Panadero, JuanPerez-Cruz,JoseRoger-Folch, Martin Riera-Guasp, and Javier Martinez-Roman, ‘Harmonic order tracking analysis: A novel method for fault diagnosis in induction machines’ ,IEEE Transactions on Energy Conversion 30, no. 3 (2015): 833-841. [12]. Singh, S., & Kumar, N. (2017), ‘Detection of Bearing Faults in Mechanical Systems Using Stator Current Monitoring’, IEEE Transactions on Industrial Informatics, 13(3), 1341-1349. [13]. Soualhi, A., Clerc, G., & Razik, H. (2013), ‘Detection and diagnosis of faults in induction motor using an improved artificial ant clustering technique’, IEEE Transactions on Industrial Electronics, 60(9),4053- 4062. [14]. Soualhi, A., Clerc, G., Razik, H., & Ondel, O. (2011, November), ‘Detection of induction motor faults by an improved artificial ant clustering’, In IECON 2011-37th Annual Conference on IEEE Industrial Electronics Society (pp. 3446-3451). IEEE. [15]. Wolkiewicz,M.,Tarchała,G.,Orłowska-Kowalska,T., & Kowalski, C. T. (2016), ‘Online stator inter turn short circuits monitoring in the DFOC induction- motor drive’, IEEE Transactions on Industrial Electronics, 63(4), 2517-2528.