
Recomendados
Más contenido relacionado
La actualidad más candente
La actualidad más candente (20)
Similar a Wind energy
Similar a Wind energy (20)
Último
Último (20)
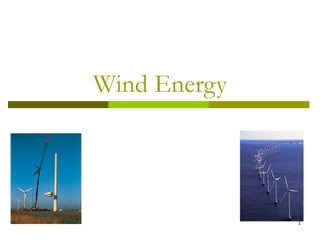
Wind energy
- 2. 2 Ancient Resource Meets 21st Century
- 3. 3 Wind Turbines Power for a House or City
- 4. 4 Wind Energy Outline History and Context Advantages Design Siting Disadvantages Economics Future
- 6. 6 Wind Energy History 1850’s Multiblade turbines for water pumping made and marketed in U.S. 1882 Thomas Edison commissions first commercial electric generating stations in NYC and London 1900 Competition from alternative energy sources reduces windmill population to fewer than 10,000 1936+ Rural Electrification Administration extends the grid to most formerly isolated rural sites Grid electricity rapidly displaces multiblade turbine uses
- 7. 7 Increasingly Significant Power Source Wind could generate 6% of nation’s electricity by 2020.Wind currently produces less than 1% of the nation’s power. Source: Energy Information Agency
- 8. 8
- 10. 10 Advantages of Wind Power Environmental Fuel Diversity & Conservation Cost Stability
- 11. 11 Environmental Benefits No air pollution No greenhouse gasses Does not pollute water No water needed for operations
- 12. 12 Fuel Diversity Benefits Domestic energy source Inexhaustible supply Small and easy design for power supply reduces supply risk
- 13. 13 Cost Stability Benefits Flat-rate pricing Wind electricity is inflation-proof
- 15. 15 Wind Energy Natural Characteristics Wind Speed Wind energy increases with the cube of the wind speed 10% increase in wind speed translates into 30% more electricity 2X the wind speed translates into 8X the electricity Height Wind energy increases with height to the 1/7 power 2X the height translates into 10.4% more electricity
- 16. 16 Wind Energy Natural Characteristics Air density Wind energy increases proportionally with air density Humid climates have greater air density than dry climates Wind energy on earth surface is about 6% less than at sea level Blade swept area Wind energy increases proportionally with swept area of the blades So blades are shaped like airplane wings 10% increase in swept diameter leads into 21% greater swept area
- 17. 17 0 500 1000 1500 2000 2500 KW MPH 5040302010 Wind Turbine Power Curve Vestas V80 2 MW Wind TurbineVestas V80 2 MW Wind Turbine
- 18. 18 2003 1.8 MW 350’2000 850 kW 265’ 2006 5 MW 600’ Recent Capacity Enhancements
- 19. 19 Turbines Improvements Larger turbines Specialized blade design Computer modeling produces more efficient design Manufacturing improvements
- 21. 21 Factors determining location Winds Speed and direction Transmission Distance of grid from project site Permit approval Land-use compatibility Public acceptance Visual, noise, and bird impacts are biggest concern Land area Economics of scale in construction as a large area is needed to apply a good project
- 23. 23 Wind Energy and the Grid Pros One time investment Low maintainance cost Cons Generally remote location Grid connectivity -- lack of transmission capability Not a continuous output Only When the wind blows (night? Day?)
- 24. 24 Birds - A Serious Obstacle Birds of Prey (hawks, eagles)
- 26. 26 Construction Cost Elements Turbines, FOB USA 49% Construction 22% Towers (tubular steel) 10% Interest During Construction 4% Interconnect/ Subsation 4% Land Transportation 2% Development Activity 4% Design & Engineering 2% Financing & Legal Fees 3%
- 27. 27 Wind Farm Cost Components
- 28. 28 Improved Capacity Factor Performance Improvements due to: Better siting Larger turbines/energy capture Technology Advances Higher reliability Capacity factors > 35% at good sites
- 29. 29 Future Trends
- 30. 30 Expectations for Future Growth 20,000 total turbines installed by 2010 6% of electricity supply by 2020 100,000 MW of wind power installed by 2020
Notas del editor
- The power of the wind has been used throughout human history, to power sailboats, to mill grain, and to pump water. The steel-bladed water pumper was the workhorse of the American farm until the country’s electricity infrastructure was built in the twentieth century. Inventors first used wind power to create electricity late in the nineteenth century. Engineers have been refining the design ever since, especially in the post-war period. Today’s wind turbines are sophiticated machines that use state-of-the-art technology to convert raw power from the wind into electricity that can be contribute to the country’s power needs.
- Wind turbines technology generally falls into two categories: small, or distributed turbines that provide power directly to their owner, and large, or utility-scale turbines that provide wholesale power. The small turbines (such as the one of the far right of this page), range from several watts in capacity to 10-50 kilowatts. The utility-scale turbines range from about 660 kilowatts to 1.8 megawatts. Offshore turbines can be larger, in the 2-megawatt range. A 10-kW turbine has a rotor diameter of 7 meters (23 feet). It is usually mounted on a 50-60-foot tower, and can produce about 16,000 kWh annually, more than enough to power a typical household. A 1.5-MW turbine has a rotor diameter of 65 - 77 meters (213-253 feet). They are typically installed on towers that are at least 65 meters (213 feet) tall. A 1.5-Mw turbine can produce more than 4.3 million kWh per year, enough to power more than 400 average U.S. housesholds.
- As of October, 2002, there is more than 4,300 MW of wind power capacity installed in the U.S. The 10 billion kWh currently generated by wind plants in the U.S. each year displaces some 13.5 billion pounds (6.7 million tons) of carbon dioxide, 35,000 tons of sulfur dioxide, and 21,000 tons of nitrogen oxides. The power that is produced from the wind is still less than 1% of the country’s total electricity production. With the right policy and market incentives, wind power technology can provide more than 6% of the nation’s electricity by 2020, which is roughly equal to an installed capacity base of 100,000 MW. That would produce enough electricity for 25 million homes and displace approximately 160 million tons of carbon dioxide, 840,000 tons of sulfur dioxide, and 503,000 tons of nitrogen oxides.
- The fact that electricity produced with wind power does not emit harmful pollutants or burn resources is an obvious advantage of the technology. In addition, it can provide cost stability to a utilty’s resource portfolio and bring income and tax benefits to rural communities.
- Wind energy system operations do not generate air or water emissions and do not produce hazardous waste. Nor do they deplete natural resources such as coal, oil, or gas, or cause environmental damage through resource extraction and transportation. Wind's pollution-free electricity can help reduce the environmental damage caused by power generation in the U.S. and worldwide. Sulfur dioxide and nitrogen oxides cause acid rain. Acid rain harms forests and the wildlife they support. Many lakes in the U.S. Northeast have become biologically dead because of this form of pollution. Acid rain also corrodes buildings and economic infrastructure such as bridges. Nitrogen oxides (which are released by otherwise clean-burning natural gas) are also a primary component of smog. Carbon dioxide (CO2) is a greenhouse gas--its buildup in the atmosphere contributes to global warming by trapping the sun's rays on the earth as in a greenhouse. The U.S., with 5% of the world's population, emits 23% of the world's CO2. The build-up of greenhouse gases is not only causing a gradual rise in average temperatures, but also seems to be increasing fluctuations in weather patterns and causing more severe droughts. Particulate matter is of growing concern because of its impacts on health. Its presence in the air along with other pollutants has contributed to make asthma one of the fastest growing childhood ailments in industrial and developing countries alike, and it has also recently been linked to lung cancer. Similarly, urban smog has been linked to low birth weight, premature births, stillbirths and infant deaths. In the United States, the research has documented ill effects on infants even in cities with modern pollution controls. Toxic heavy metals accumulate in the environment and up the biological food chain. Development of just 10% of the wind potential in the 10 windiest U.S. states would provide more than enough energy to displace emissions from the nation's coal-fired power plants and eliminate the nation's major source of acid rain; reduce total U.S. emissions of CO2 by almost a third and world emissions of CO2 by 4%; and help contain the spread of asthma and other respiratory diseases aggravated or caused by air pollution in this country. One 750-kW wind turbine would displace: 3 million lbs of carbon dioxide per year, equivalent to nearly 2 million miles driven in an SUV 14,172 lbs of sulfur dioxide & 8,688 lbs of nitrous oxides
- US winds could generate more electricity in 15 years than all of Saudi Arabia’s oil—without being depleted. Wind facilities consist of small generators that cannot be easily be damaged at the same time and are easy to replace. If a wind facility is damaged, there is no secondary risk to the public, such as in the release of radioactivity, explosions, or the breaching of a dam. Wind plants can be built quickly to respond to electricity supply shortages.
- One of the most attractive features of wind power projects is the fact that, with good wind resource estimates, the cost of the project is almost all in the up-front construction costs, and therefore constant over the life of the project. Utilities and electricity users are starting to value the hedge benefit that a wind plant can offer, especially as natural gas prices rise and become more volatile.
- Vestas V52 – 850 kW, 52 m rotor diameter, avg. 55 m hub height Vestas V80 – 1.8 MW, 80 m rotor diameter, avg. 67 m hub height REPower Systems 5M – 5 MW, 126 m rotor diameter, up to 120 m hub height Statue of Liberty – 305 feet from ground to torch
- Larger turbines produce exponentially more power, which reduces unit cost of electricity Rotor blade airfoils specially designed for wind turbines Power electronics improve turbine operations and maintenance Computer modeling produces more efficient design
- The main things to look for when siting a wind farm are the wind resource, the proximity to transmission lines, the ease of permitting, and the land use. Siting for a wind farm can usually be done much faster than for traditional generation, in a time period of 6 months to a year. Land-use Guidelines Ridges: Ranges from 7.5 MW per mile for 660-kW turbines to 11.8 MW per mile for 1.5-MW turbines Arrays: For a multi-rowed array (spaced 3x10 rotor diameters), 15-20 of acres of land is needed per MW of capacity. Only 5% of this area is needed for turbines, access roads, and other equipment.
- Sometimes it is also helpful to discuss the full cost of construction. Since wind plants do not require any fuel, the construction costs are the full costs of the project over its life, Subtract operation and maintenance costs. The industry benchmark is $1 million per megawatt of installed capacity, but has been reported in some cases at less than $900 per megawatt. Of that $1 million, approximately half is for the cost of the turbine itself. The other half is spent on construction, towers, financing, design, and legal fees. Controlling construction costs can have a large impact on keeping the full project costs low.
- The capacity factor assess the productivity of a wind turbine, comparing the actual production with the amount of power the plant would have produced if it had run at full capacity the same amount of time. Since a wind plant uses the wind for its fuel, and the wind does not constantly blow at full speed, modern wind turbines have capacity factors that range from 25%-40%, although they will probably achieve higher capacity factors during windy months. It is important to note that while capacity factor is almost entirely a matter of reliability for a fueled power plant, it is not for a wind plant—for a wind plant, it is a matter of economical turbine design. With a very large rotor and a very small generator, a wind turbine would run at full capacity whenever the wind blew and would have a 60-80% capacity factor—but it would produce very little electricity. The most electricity per dollar of investment is gained by using a larger generator and accepting the fact that the capacity factor will be lower as a result. Wind turbines are fundamentally different from fueled power plants in this respect. If a wind turbine's capacity factor is 33%, it does not mean that it is only running one-third of the time. A wind turbine at a typical location in the Midwestern U.S. should run about 65-80% of the time. However, much of the time it will be generating at less than full capacity (see previous answer), making its capacity factor lower.