Webster Texas Homes Market Report - 1st Quarter 2013
•
0 likes•142 views

A report on single family home sales activity in Webster, Texas for the first quarter of 2013.

Recommended
Recommended
More Related Content
What's hot
What's hot (20)
Viewers also liked
Viewers also liked (11)
Similar to Webster Texas Homes Market Report - 1st Quarter 2013
Similar to Webster Texas Homes Market Report - 1st Quarter 2013 (20)
Recently uploaded
Recently uploaded (20)
Webster Texas Homes Market Report - 1st Quarter 2013
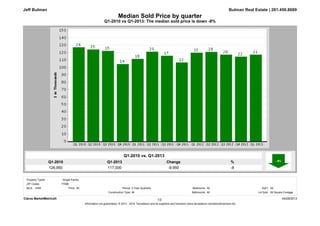
- 1. Q1-2013 117,000 Q1-2010 126,950 % -8 Change -9,950 Q1-2010 vs Q1-2013: The median sold price is down -8% Median Sold Price by quarter Bulman Real Estate | 281.450.8689 Q1-2010 vs. Q1-2013 Jeff Bulman Clarus MarketMetrics® 04/29/2013 Information not guaranteed. © 2013 - 2014 Terradatum and its suppliers and licensors (www.terradatum.com/about/licensors.td). 1/2 MLS: HAR Bedrooms: All All Construction Type: All3 Year Quarterly SqFt: Bathrooms: Lot Size:All All Square Footage Period:All ZIP Codes: Property Types: : Single-Family 77598 Price:
- 2. Median Sold Price by quarter Q1-2010 vs Q1-2013: The median sold price is down -8% Bulman Real Estate | 281.450.8689Jeff Bulman Sold Median Price Units Avg DOMTime Period Q1 2013 117,000 31 55 Q4 2012 114,250 22 54 Q3 2012 117,000 28 84 Q2 2012 120,700 28 107 Q1 2012 119,600 15 85 Q4 2011 106,500 12 79 Q3 2011 115,500 17 96 Q2 2011 121,000 20 68 Q1 2011 111,250 18 86 Q4 2010 104,250 14 62 Q3 2010 122,007 15 66 Q2 2010 124,000 35 45 Q1 2010 126,950 24 66 Clarus MarketMetrics® 04/29/2013 Information not guaranteed. © 2013 - 2014 Terradatum and its suppliers and licensors (www.terradatum.com/about/licensors.td). 22/
- 3. Q1-2013 31 Q1-2010 24 % 29 Change 7 Q1-2010 vs Q1-2013: The number of Sold properties is up 29% Sold Properties by quarter Bulman Real Estate | 281.450.8689 Q1-2010 vs. Q1-2013 Jeff Bulman Clarus MarketMetrics® 04/29/2013 Information not guaranteed. © 2013 - 2014 Terradatum and its suppliers and licensors (www.terradatum.com/about/licensors.td). 1/2 MLS: HAR Bedrooms: All All Construction Type: All3 Year Quarterly SqFt: Bathrooms: Lot Size:All All Square Footage Period:All ZIP Codes: Property Types: : Single-Family 77598 Price:
- 4. Sold Properties by quarter Q1-2010 vs Q1-2013: The number of Sold properties is up 29% Bulman Real Estate | 281.450.8689Jeff Bulman Time Period Full Market Units Median Price Avg DOM Bank Properties Units % Bank Median Price Non-Bank Properties Units % Non-Bank Median Price Q1 2013 117,00031 55 5 16.1 100,000 26 83.9 119,900 Q4 2012 114,25022 54 4 18.2 88,891 18 81.8 117,247 Q3 2012 117,00028 84 4 14.3 83,450 24 85.7 124,950 Q2 2012 120,70028 107 3 10.7 85,000 25 89.3 122,000 Q1 2012 119,60015 85 3 20.0 85,199 12 80.0 121,750 Q4 2011 106,50012 79 4 33.3 73,200 8 66.7 112,450 Q3 2011 115,50017 96 1 5.9 58,000 16 94.1 116,250 Q2 2011 121,00020 68 5 25.0 79,900 15 75.0 125,000 Q1 2011 111,25018 86 9 50.0 75,100 9 50.0 120,671 Q4 2010 104,25014 62 5 35.7 85,500 9 64.3 120,500 Q3 2010 122,00715 66 0 0.0 15 100.0 122,007 Q2 2010 124,00035 45 6 17.1 83,579 29 82.9 128,000 Q1 2010 126,95024 66 3 12.5 93,000 21 87.5 128,000 Clarus MarketMetrics® 04/29/2013 Information not guaranteed. © 2013 - 2014 Terradatum and its suppliers and licensors (www.terradatum.com/about/licensors.td). 22/
- 5. Q1-2010 vs Q1-2013: The number of for sale properties is down -11% and the number of sold properties is up 29% Bulman Real Estate | 281.450.8689 Q1-2010 vs. Q1-2013 89 -11 Jeff Bulman 79 Q1-2013 Supply & Demand by quarter ChangeQ1-2010 % -10 Q1-2010 Q1-2013 % 24 29 Q1-2010 vs. Q1-2013 31 Change 7 Clarus MarketMetrics® 04/29/2013 Information not guaranteed. © 2013 - 2014 Terradatum and its suppliers and licensors (www.terradatum.com/about/licensors.td). 1/2 MLS: HAR Bedrooms: All All Construction Type: All3 Year Quarterly SqFt: Bathrooms: Lot Size:All All Square Footage Period:All ZIP Codes: Property Types: : Single-Family 77598 Price:
- 6. Supply & Demand by quarter Q1-2010 vs Q1-2013: The number of for sale properties is down -11% and the number of sold properties is up 29% Jeff Bulman Bulman Real Estate | 281.450.8689 For Sale Sold # Properties Avg DOM Avg DOM # Properties Time Period Q1 2013 76 5579 31 Q4 2012 91 5483 22 Q3 2012 92 8483 28 Q2 2012 103 10780 28 Q1 2012 119 8580 15 Q4 2011 125 7970 12 Q3 2011 117 9690 17 Q2 2011 120 6897 20 Q1 2011 120 8676 18 Q4 2010 128 6276 14 Q3 2010 113 6682 15 Q2 2010 81 4588 35 Q1 2010 67 6689 24 Clarus MarketMetrics® 04/29/2013 Information not guaranteed. © 2013 - 2014 Terradatum and its suppliers and licensors (www.terradatum.com/about/licensors.td). 22/
- 7. Q1-2013 49 Q1-2010 53 % -8 Change -4 Q1-2010 vs Q1-2013: The average days on market is down -8% The Average Days on Market by quarter Bulman Real Estate | 281.450.8689 Q1-2010 vs. Q1-2013 Jeff Bulman 77598 All 3 Year Quarterly ZIP Codes: Period:Price: Property Types: : Single-Family 04/29/20131/2Clarus MarketMetrics® All Square Footage Bedrooms: All AllSqFt: All Lot Size:Bathrooms:AllConstruction Type: MLS: HAR
- 8. The Average Days on Market by quarter Q1-2010 vs Q1-2013: The average days on market is down -8% Bulman Real Estate | 281.450.8689Jeff Bulman # UC UnitsAvg DOMTime Period Q1 2013 4149 Q4 2012 1955 Q3 2012 2462 Q2 2012 30102 Q1 2012 2697 Q4 2011 1192 Q3 2011 1274 Q2 2011 2682 Q1 2011 1370 Q4 2010 1581 Q3 2010 1482 Q2 2010 3148 Q1 2010 3153 Clarus MarketMetrics® 2/2 04/29/2013 Information not guaranteed. © 2013 - 2014 Terradatum and its suppliers and licensors (www.terradatum.com/about/licensors.td).