STKI IT Market Study 2019 version 2
•
4 recomendaciones•5,159 vistas

STKI researches and publishes once a year a complete Market Study about the Israeli Information Technology Scene. This is a version 2 that includes changes that were found after companies presented (again) their 2018 results and STKI analysts accepted the changes.

Recomendados
Recomendados
Más contenido relacionado
La actualidad más candente
La actualidad más candente (20)
Similar a STKI IT Market Study 2019 version 2
Similar a STKI IT Market Study 2019 version 2 (20)
Más de Dr. Jimmy Schwarzkopf
Más de Dr. Jimmy Schwarzkopf (12)
Último
Último (20)
STKI IT Market Study 2019 version 2
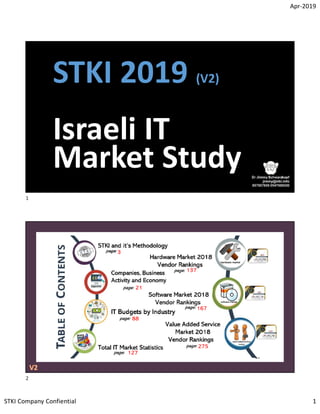
- 1. Apr-2019 STKI Company Confiential 1 1 Copyright@STKI_2019 Do not remove source or attribution from any slide, graph or portion of graph STKI 2019 (V2) Israeli IT Market Study 2 Copyright@STKI_2019 Do not remove source or attribution from any slide, graph or portion of graph 3 21 88 127 275 167 137 1 2
- 2. Apr-2019 STKI Company Confiential 2 3 Copyright@STKI_2019 Do not remove source or attribution from any slide, graph or portion of graph • Over 28 years of experience in the IT analyst sector and thousands of annual face-to-face interviews with key industry participants have enabled STKI analysts to establish solid, long- standing relationships with customers. • STKI customers include major IT organizations (government, financial institutions, telecoms, manufacturing, medical, education, etc.) and IT suppliers/vendors (infrastructure and software suppliers, consulting and professional services firms). • STKI works closely with vendor senior management (strategy, business development, and marketing). Where end users are concerned, analysts meet with CEOs, CFOs, CMOs, CDOs and CIOs (as with all levels of IT decision making) thereby attaining complete information of their technology as well as their business needs. STKI's mission is to advise and analyze users of business technologies as well as their suppliers while conducting original research and providing advisory services regarding all parts of the technology puzzle. • Founded in 1992, STKI is the leading business technologies market research and strategic analyst firm in Israel. Founded in 1992, STKI is the leading business technologies market research and strategic analyst firm in Israel. 3 4 Copyright@STKI_2019 Do not remove source or attribution from any slide, graph or portion of graph • Dr. Schwarzkopf has worked during the last 40 years in all areas of Computer Information Services: • As an Industry Analyst at META Group (Israeli Research Manager) and was named a META Group Research Fellow. • As an academic researcher in Entrepreneurship Sciences; has published and presented in several international IT and Management Conferences • Editorial Board Member of the academic journal "International Journal of Opportunity, Growth and Value Creation". • As a consultant in Arthur Andersen Consulting (USA), Booz Allen (USA) and Kesselman & Kesselman (Israel) • As a systems professional in SCS Computers and the R&D Unit of the Israel Defense Forces. • As a marketing professional in Digital Equipment Corporation. • As a teacher/mentor in the MIS department / Tel-Aviv Yafo Academic College and the Computer School of the IDF. • As an entrepreneur founding three companies in the IT arena: STKI and companies in the areas of store/forward mail and office systems. • Dr. Schwarzkopf served on the Board of Directors of Ashot Ashkelon Industries, served as President of the Gymnasia Herzelia Association, Co-founder of the Mashov Political Movement and was a member of the Central Committee of the Labor Party. Major (Rav-Seren) in the reserves, Israel Defense Forces (where he served in an elite unit and later in the R&D unit). Registered Engineer (IS22881), member of MENSA Israel. • Dr. Schwarzkopf received BSE and MSE degrees (Systems Engineering) from the University of Central Florida. Received a MSIA (Management Information Systems) and ABD (PhD Program) in Systems Science (received (twice) the William Larimer Mellon Scholarship/Award) from Carnegie Mellon University. His doctorate (DM-Management/ Entrepreneurship) he received from Weatherhead School of Management at Case Western Reserve University. Dr. Jimmy Schwarzkopf, Research Fellow , STKIDr. Jimmy Schwarzkopf, Research Fellow , STKI 4 3 4
- 3. Apr-2019 STKI Company Confiential 3 5 Copyright@STKI_2019 Do not remove source or attribution from any slide, graph or portion of graph Face-to-face meetings STKI Analyst House Calls (for both users and vendors) CIO STKI "Help Desk" Inquiries Surveys Strategic Marketing & Positioning Round Tables for users Vendor Discovery Series (Newsletters and workshops) Vendor Innovation Workshops In-house Workshops CIO Annual Bootcamp CTO Annual Bootcamp Brainstorming (based on Design Thinking) Workshops STKI Annual Summit STKI services include 5 6 Copyright@STKI_2019 Do not remove source or attribution from any slide, graph or portion of graph 6 5 6
- 4. Apr-2019 STKI Company Confiential 4 7 Copyright@STKI_2019 Do not remove source or attribution from any slide, graph or portion of graph STKI Research Results: 1. IT Trends 2. Surveys about organizational issues 3. Round Table Summaries 4. Industry IT Budgets 5. IT Market Forecasts by category 6. Vendor Tiers by category 7. Product Positioning 8. Staffing Ratios http://index.stki.info/ 7 8 Copyright@STKI_2019 Do not remove source or attribution from any slide, graph or portion of graph STKI Methodology: equilibrium model The sum of all IT expenditures (from users) has to be equal to all IT sales (from vendors). most research firms are either a "demand-based" (market information based on data from users of IT) "supply-based" (market information based on data from IT vendors). STKI is one of the only research firms using an equilibrium model and the only one in Israel. 8 7 8
- 5. Apr-2019 STKI Company Confiential 5 9 Copyright@STKI_2019 Do not remove source or attribution from any slide, graph or portion of graph In order to calculate the “IT Market” (what is bought/sold in Israel) What users bought? From whom? Why? What users bought? From whom? Why? Technology Users Technology Users Technology Vendors how much did they sell? to whom? for how much? competitors? how much did they sell? to whom? for how much? competitors? 10 Copyright@STKI_2019 Do not remove source or attribution from any slide, graph or portion of graph › Yearly revenues of hardware sales and hardware maintenance › Yearly revenues of software licenses, software maintenance and cloud usage. › We are learning how to account only for enterprise cloud usage in Israel for IT departments. › Differentiation between new projects and continuing projects (New projects count more) › Distinguish between work done by the vendor's employees and work outsourced to other vendors. The revenue should be transferred to the vendor actually doing the work. › Differentiate revenues from projects done in fixed price, cost plus (SLA defined) , managed services and those done by staff augmentation (non SLA) projects. › Differentiate value of work done by high level internal professionals in a project versus that done by staff augmentation employees in the clients IT department. › We do not include any work/ products for OEMs and military non-IT projects. Our study looks at any vendor value (products/services) sold to enterprises (also government & security) in Israel; taking into account the client’s view/mindshare of value delivered 10 9 10
- 6. Apr-2019 STKI Company Confiential 6 11 Copyright@STKI_2019 Do not remove source or attribution from any slide, graph or portion of graph 11 12 Copyright@STKI_2019 Do not remove source or attribution from any slide, graph or portion of graph Israeli Positioning 12 11 12
- 7. Apr-2019 STKI Company Confiential 7 13 Copyright@STKI_2019 Do not remove source or attribution from any slide, graph or portion of graph Over 150 categories Over 150 categories 13 14 Copyright@STKI_2019 Do not remove source or attribution from any slide, graph or portion of graph 456 IT VENDORS in Israel 456 IT VENDORS in Israel 14 13 14
- 8. Apr-2019 STKI Company Confiential 8 15 Copyright@STKI_2019 Do not remove source or attribution from any slide, graph or portion of graph Manufacturers/Software Houses, Distributors, VARs NO double bookings for IT Market Size Forecasts Resellers (VARs) get credit only for their value added unless the manufacturer/software house is not present in Israel, then they get full credit. Integrators and other Value Added Service Providers get credit only for the “services-work” they contributed to the project. 15 16 Copyright@STKI_2019 Do not remove source or attribution from any slide, graph or portion of graph DISTRIBUTORS (usually are not shown in our study) are intermediary reseller entities; between the original MANUFACTURERS OF HARDWARE PRODUCTS or SOFTWARE HOUSES and other entities in the distribution channel (VARs and INTEGRATORS). VALUE-ADDED RESELLERS (VARs) offer third party software and hardware to the end user or integrators at a markup, along with a limited combination of procurement consulting, configuration, and customization services (shown under HARDWARE or SOFTWARE) INTEGRATORS offer professional’s services (consulting, developing, implementing or sourcing manpower) in order to deliver enterprise computer services to the organization. (shown under VALUE ADDED SERVICES ). 15 16
- 9. Apr-2019 STKI Company Confiential 9 17 Copyright@STKI_2019 Do not remove source or attribution from any slide, graph or portion of graph 17 18 Copyright@STKI_2019 Do not remove source or attribution from any slide, graph or portion of graph Area company occupies in the circle is not relevant and has no meaning. STKI has signed NDAs with the vendors (revenues, projects) and we tried to minimize opportunities for backward engineering of the data . 17 18
- 10. Apr-2019 STKI Company Confiential 10 19 Copyright@STKI_2019 Do not remove source or attribution from any slide, graph or portion of graph Methodology for “Israeli Positioning” This is NOT a technological or functional positioning and SHOULD NOT be used as such. This positioning is intendent to reflect ONLY THE DEGREE to which a product is PRESENT AND SUPPORTED IN ISRAEL Focused on the enterprise sector (not SMB) X axis (Market Presence): Installed base; New sales; Mindshare Y axis (Local Support): Number and quality of Sis; localization; local R&D Vendors to watch: New players that only recently entered the market and therefore cannot be evaluated against longtime players Global leaders: marked according to international analyst firms 20 Copyright@STKI_2019 Do not remove source or attribution from any slide, graph or portion of graph stki 20 19 20
- 11. Apr-2019 STKI Company Confiential 11 21 Copyright@STKI_2019 Do not remove source or attribution from any slide, graph or portion of graph 21 ISRAEL 2019 02 Companies, Business Activity and Economy 22 Copyright@STKI_2019 Do not remove source or attribution from any slide, graph or portion of graph 22 21 22
- 12. Apr-2019 STKI Company Confiential 12 23 Copyright@STKI_2019 Do not remove source or attribution from any slide, graph or portion of graph 23 lsrael's economy is performing strongly Real GDP developments lndex 2000 = 100 180 lsrael Israel's economy continues to register remarkable macroeconomic and fiscal performance. Growth is strong and unemployment low and falling. With low interest rates and price stability, financial policy is 170 160 150 140 130 120 110 100 OECD prudent, and public debt is comparatively low and declining. The external position is solid, thanks to a dynamic high-tech sector. The average standard of living is improving, mainly due to higher employment rates. Continued accommodative macro policies and planned investments in the offshore gas fields in the 2000 2002 2004 2006 2008 2010 2012 2014 2016 Source: OECD, Economic Outlook Database. 1 2 http://dx.doi.org/10.1787/888933672743 coming years will spur further growth. Against this backdrop, Israelis remain on average more satisfied with their lives than residents of most other OECD countries. lncome inequality has fallen, but economic disparities and a lack of social cohesion persist • The economy is strong • Growth will continue in 2019 (despite a temporary slowdown in mid-2018), and will cool down in 2020. • Reforms needed of the public transport infrastructure • Income inequality has fallen, but economic disparities and a lack of social cohesion persist • Expansionary fiscal policy and low interest rates (0.25%) will boost domestic demand. • Growing regional geopolitical tensions could stop GDP growth • Faster-than-expected development of offshore gas fields andnew gas export deals could boost GDP growth 24 Copyright@STKI_2019 Do not remove source or attribution from any slide, graph or portion of graph 24 23 24
- 13. Apr-2019 STKI Company Confiential 13 25 Copyright@STKI_2019 Do not remove source or attribution from any slide, graph or portion of graph 25Economic Data for Israel 2 26 Copyright@STKI_2019 Do not remove source or attribution from any slide, graph or portion of graph 26 Economic Data for Israel 3 25 26
- 14. Apr-2019 STKI Company Confiential 14 27 Copyright@STKI_2019 Do not remove source or attribution from any slide, graph or portion of graph 27The Global Risk Landscape 2019 28 Copyright@STKI_2019 Do not remove source or attribution from any slide, graph or portion of graph 28 27 28
- 15. Apr-2019 STKI Company Confiential 15 29 Copyright@STKI_2019 Do not remove source or attribution from any slide, graph or portion of graph 29 30 Copyright@STKI_2019 Do not remove source or attribution from any slide, graph or portion of graph 30 29 30
- 16. Apr-2019 STKI Company Confiential 16 31 Copyright@STKI_2019 Do not remove source or attribution from any slide, graph or portion of graph 31 32 Copyright@STKI_2019 Do not remove source or attribution from any slide, graph or portion of graph 32 Global Competitiveness Report 31 32
- 17. Apr-2019 STKI Company Confiential 17 33 Copyright@STKI_2019 Do not remove source or attribution from any slide, graph or portion of graph 33 • The country has grown to become one of the world’s innovation hubs (10th globally). • Israel spends the most of any country in the index on R&D (4.3% of GDP), and is where entrepreneurial failure is most accepted and innovative companies grow the fastest. • It can also rely on an extremely educated workforce, with an average of 13 years of schooling (8th globally) and where people acquire the appropriate skills that employers are looking for (2nd globally). • This pool of talent is well integrated into the job market thanks to the low level of taxes on labor (5.9% of companies’ profits), near-equal participation of women (6th globally) and reliance on professional management (19th). • A well-developed financial sector (22nd), with the second-best availability of venture capital in the world, also supports a flourishing and innovative private sector. • Dynamism of domestic markets could be hindered by the presence of large groups (51st globally in terms of dominance of few large companies), although competition within the service sector, particularly in professional services, remains vibrant (31st). Global Competitiveness Report Israel score of 76.6 (20th globally) 34 Copyright@STKI_2019 Do not remove source or attribution from any slide, graph or portion of graph 34 trade facilitation comparison Israel 2019: 33 34
- 18. Apr-2019 STKI Company Confiential 18 35 Copyright@STKI_2019 Do not remove source or attribution from any slide, graph or portion of graph 35 Israel 2019: exports 36 Copyright@STKI_2019 Do not remove source or attribution from any slide, graph or portion of graph 36 Figure 2. Well-being outcomes are mixed A. Better Life lndex,1 2017 edition B. Gap vis-a-vis the OECD upper half2 Subjective well-being Income and wealth 10 Jobs and earnings Israel % points 0 8 6 Personal security 4 2 0 Environmental quality Civic engag. & governance Social connections Housing Work-life balance Health status Education and skills OECD Labour utilisation GDP per capita Hourly productivity 2000 2005 2010 2015 -5 -10 -15 -20 -25 -30 -35 -40 -45 : OECD (2018), Economic Policy Reforms: Going for Growth (forthcoming Well-being Data Outcomes (confusing) %underOECDaverage OECD average 35 36
- 19. Apr-2019 STKI Company Confiential 19 37 Copyright@STKI_2019 Do not remove source or attribution from any slide, graph or portion of graph 37 38 Copyright@STKI_2019 Do not remove source or attribution from any slide, graph or portion of graph 38 Tunisia Arab system Brazil Indonesia Jordan Turkey Albania lsrael1 European Union OEC D Hebrew system1 productivity 500 475 450 425 400 375 350 Education outcomes are poor for disadvantaged groups Average overall PISA score, 2015 To foster stronger social co complementa ry re form s infrastructure and educatio strengthening product marke productivity in sheltered sec infrastructure deficit, especi which causes considerable ro air quality, impedes access to accentuates spatial segrega groups living in peripheral zo in disadvantaged areas, espe improve job prospects and 1. Haredi boys did not participate in the PISA test, as they do not study the required material. Results are thus overestimated. Source: OECD, PISA Database; Shoresh (2017), Shoresh Handbook 2017: Education and its impact in Israel. 1 2 http://dx.doi.org/10.1787/888933672724 reforms and more public in would improve the skills of H especially women, allowing th in high value-added sectors. 1. Defined as the S90IS10 disposable income share ratio, i.e. the share of all disposable income received by the top decile divided by the share of the bottom decile. 2. Poverty rate relative to threshold of 50% of median disposable income. Source: OECD (2017), Income Distribution Database, Israel 2019: Inequality and poverty remain high 37 38
- 20. Apr-2019 STKI Company Confiential 20 39 Copyright@STKI_2019 Do not remove source or attribution from any slide, graph or portion of graph 39 poverty in Israel Israel 2019: 40 Copyright@STKI_2019 Do not remove source or attribution from any slide, graph or portion of graph 40 OECD, Economic Outlook Database; Bank of Israel. 1 2 http://dx.doi.org/10.1787/888933672895 Figure 10. The labour market continues to tighten A. Cyclical slack has been used up B. Wage growth and job vacancies % of labour force 5.0 4.5 4.0 3.5 3.0 2.5 2.0 1.5 Involuntary part-time workers Marginally attached workers Unemployment rate NAIRU1 % of labour force 16 14 12 10 8 6 4 2 % change2 6 5 4 3 2 1 0 -1 -2 Nominal wage growth Real3 wage growth Job vacancy ratio % of total employees 5.0 4.5 4.0 3.5 3.0 2.5 2.0 1.5 1.0 2000 2002 2004 2006 2008 2010 2012 2014 2016 2010 2011 2012 2013 2014 2015 2016 2017 Labor MarketIsrael 2019: 39 40
- 21. Apr-2019 STKI Company Confiential 21 41 Copyright@STKI_2019 Do not remove source or attribution from any slide, graph or portion of graph 41 participation in labor force Israel 2019: 42 Copyright@STKI_2019 Do not remove source or attribution from any slide, graph or portion of graph 42 The leading items ordered by Israelis were clothing and footwear, vitamins, cosmetics, kitchen accessories, electronics, computers and gadgets. The leading retailer was Ali Express (50 percent of orders). Followed by eBay, while the biggest jump in orders was identified in Amazon , Asos and British clothing merchants Next (Next even has a Hebrew website and is a particular favorite among Israeli moms buying clothes for their kids). Most packages arriving in Israel originated in China, the United States and the United Kingdom. Residents of Israel’s 20 largest cities got around 43 million packages Tel Aviv residents ordered the largest net amount of packages in 2018 (5.1 million, averaging 9.53 parcels per person). 2018 was a record-breaker in the field of online commerce (from abroad) During 2018 more than 65 million packages were delivered from abroad, weighing a total of 14,100 tons 41 42
- 22. Apr-2019 STKI Company Confiential 22 43 Copyright@STKI_2019 Do not remove source or attribution from any slide, graph or portion of graph 43 TOURISM 44 Copyright@STKI_2019 Do not remove source or attribution from any slide, graph or portion of graph 44 • 7.6 million one-time departures in 2017 • That’s up 12% from the 2016. • Nearly half the population, or 3.8 million Israelis, departed the country at least once in 2017. • That stands among the highest rate of international travel in the world, signs of the increasing number of low-cost airlines servicing the market (look at the graph) 43 44
- 23. Apr-2019 STKI Company Confiential 23 45 Copyright@STKI_2019 Do not remove source or attribution from any slide, graph or portion of graph 45Israel 2019: Jobs dashboard of labor market performance 46 Copyright@STKI_2019 Do not remove source or attribution from any slide, graph or portion of graph 46 Israel 2019: 45 46
- 24. Apr-2019 STKI Company Confiential 24 47 Copyright@STKI_2019 Do not remove source or attribution from any slide, graph or portion of graph 47 48 Copyright@STKI_2019 Do not remove source or attribution from any slide, graph or portion of graph 48 • 6,740,287 Internet users in Dec, 2018, 78.5% penetration • 5,800,000 Facebook subscribers in Dec, 2017, 67.6% penetration • Mobile Speed: 20.79 Mbps Down load - 12.58 Mbps Up load (2018 Avg.) • Fixed Broadband Speed: 52.54 Mbps Down load - 10.69 Mbps Up load 47 48
- 25. Apr-2019 STKI Company Confiential 25 49 Copyright@STKI_2019 Do not remove source or attribution from any slide, graph or portion of graph 49Bank of Israel Annual Report 2018 50 Copyright@STKI_2019 Do not remove source or attribution from any slide, graph or portion of graph 50 49 50
- 26. Apr-2019 STKI Company Confiential 26 51 Copyright@STKI_2019 Do not remove source or attribution from any slide, graph or portion of graph 51 52 Copyright@STKI_2019 Do not remove source or attribution from any slide, graph or portion of graph 52 51 52
- 27. Apr-2019 STKI Company Confiential 27 53 Copyright@STKI_2019 Do not remove source or attribution from any slide, graph or portion of graph 53 54 Copyright@STKI_2019 Do not remove source or attribution from any slide, graph or portion of graph 54 Israel 2019: 53 54
- 28. Apr-2019 STKI Company Confiential 28 55 Copyright@STKI_2019 Do not remove source or attribution from any slide, graph or portion of graph 55Number of Companies (paying employee taxes) in Israel 56 Copyright@STKI_2019 Do not remove source or attribution from any slide, graph or portion of graph 56 small size of firms (market) affects productivity Israel 2019: theoretically this small market has to carry a price penalty but….. 55 56
- 29. Apr-2019 STKI Company Confiential 29 57 Copyright@STKI_2019 Do not remove source or attribution from any slide, graph or portion of graph 57 State of the Economy Index* Copyright@STKI_2019 Do not remove source or attribution from any slide, graph or portion of graph 58 Copyright@STKI_2019 Do not remove source or attribution from any slide, graph or portion of graph 58 State of the Economy Index reflects the economy’s difficulty in increasing the volume of production, (low supply of qualified workers) so the country needs to provide a larger share of the demand from outside sources. 57 58
- 30. Apr-2019 STKI Company Confiential 30 59 Copyright@STKI_2019 Do not remove source or attribution from any slide, graph or portion of graph 59 60 Copyright@STKI_2019 Do not remove source or attribution from any slide, graph or portion of graph 60 ISRAEL 2019 Startup Scene in Israel 59 60
- 31. Apr-2019 STKI Company Confiential 31 61 Copyright@STKI_2019 Do not remove source or attribution from any slide, graph or portion of graph 61 Israel’s Innovation Special Sauce 62 Copyright@STKI_2019 Do not remove source or attribution from any slide, graph or portion of graph 62 • #1 country with Nasdaq-listed companies except the U.S. and China • #1 country in terms of VC Investment per Capita and as a % of GDP • #1 country in terms of startups concentration: there’s 1 startup for every 400 people and 1 startup each 19km2 • #1 startup ecosystem after the US according to the Compass Global Startup Ecosystem Ranking • #1 country in terms of R&D employees concentration: 140 per 10,000 (the U.S. comes in second with 85 per 10,000) • #1 country in terms of high-tech employees concentration: 250 000 high tech employees (around 1 per 10 working people) • #1 in the production of scientific papers • #1 out of 148 economies in innovation abilities, #2 in entrepreneurship and #3 in global innovation according to the IMD Competitiveness Yearbook • #1 out of 60 leading economies around the world for technological and scientific abilities according to the annual Global Dynamism Index (GDI) • #2 on the World Economic Forum • #2 most highly educated country in the world according to WSJ • #4 in its ability to attract foreign investors according to Deloitte • #5 in the number of patents per capita • #10 on the Bloomberg Index Israel 2019 Startup and R&D Ecosystem ResultsIsrael 2019 Startup and R&D Ecosystem Results 61 62
- 32. Apr-2019 STKI Company Confiential 32 63 Copyright@STKI_2019 Do not remove source or attribution from any slide, graph or portion of graph 63 • It has grown from 7% of total employment in 1995 to 9% in 2014, (12% of employment in the business sector), which is more than double the OECD-country median. • Its share of GDP increased from 6.5% to 11.4% during this period, • It experienced stronger growth in services than in goods. • Services accounted for two-thirds of the value added produced in the high-tech sector • Since 2010 high-tech industry expansion has been about half that of the rest of the economy. It is no longer been the engine of growth. • Production in this sector, which exceeded 13% of GDP in 2009, fell by 1.7 percentage points and its share in exports stopped increasing. • Many Israeli tertiary graduates are employed in jobs not matching their field of studies (there is no public quality analysis concerning colleges & universities outcomes) • The most significant challenge facing the sector is the lack of supply of skilled labor • The government is trying to increase the number of college & university students with technology- oriented majors by 40% within five years (Israel Innovation Authority, 2017). The high-tech sector share of the Israeli economy 64 Copyright@STKI_2019 Do not remove source or attribution from any slide, graph or portion of graph 64Only four of 100 startups succeed; Only four of 500 are successful growing independently The good news: It is not necessary to raise capital to build a successful startup – 17% of successful startups did not raise capital from investors The bad news: Investment does not a guarantee success for a startup – 41% of venture-backed startups shut down or are sold at a loss; and fewer than 9% prove successful, 46% of Israeli startups stop operating within 3.5 years on average, 71% of successful companies are acquired; Only 139 companies that are active today can be considered successful https://www.ivc-online.com 63 64
- 33. Apr-2019 STKI Company Confiential 33 65 Copyright@STKI_2019 Do not remove source or attribution from any slide, graph or portion of graph 65 66 Copyright@STKI_2019 Do not remove source or attribution from any slide, graph or portion of graph 66 65 66
- 34. Apr-2019 STKI Company Confiential 34 67 Copyright@STKI_2019 Do not remove source or attribution from any slide, graph or portion of graph 67IVC-ZAG Analysis of Israel 2018 High-Tech Capital Raising Trends • Six-year consecutive growth in Israeli high-tech capital raising—120% more compared to 2013 • 5 financing rounds (each over $100m) captured 13% of the annual amount • VC-backed deals totaled $4.7 billion in 2018—number of VC-backed deals dropped first time since 2014 • Sluggish investment activity of Israeli VC funds - lowest since 2014 68 Copyright@STKI_2019 Do not remove source or attribution from any slide, graph or portion of graph 68Israel Hightech Funding Landscape 67 68
- 35. Apr-2019 STKI Company Confiential 35 69 Copyright@STKI_2019 Do not remove source or attribution from any slide, graph or portion of graph 69 70 Copyright@STKI_2019 Do not remove source or attribution from any slide, graph or portion of graph 70Israel Fintech Landscape 69 70
- 36. Apr-2019 STKI Company Confiential 36 71 Copyright@STKI_2019 Do not remove source or attribution from any slide, graph or portion of graph 71 72 Copyright@STKI_2019 Do not remove source or attribution from any slide, graph or portion of graph 72 71 72
- 37. Apr-2019 STKI Company Confiential 37 73 Copyright@STKI_2019 Do not remove source or attribution from any slide, graph or portion of graph 73 74 Copyright@STKI_2019 Do not remove source or attribution from any slide, graph or portion of graph 74 73 74
- 38. Apr-2019 STKI Company Confiential 38 75 Copyright@STKI_2019 Do not remove source or attribution from any slide, graph or portion of graph 75Israel’s Mobility Landscape 76 Copyright@STKI_2019 Do not remove source or attribution from any slide, graph or portion of graph 76 75 76
- 39. Apr-2019 STKI Company Confiential 39 77 Copyright@STKI_2019 Do not remove source or attribution from any slide, graph or portion of graph 77 78 Copyright@STKI_2019 Do not remove source or attribution from any slide, graph or portion of graph 78 77 78
- 40. Apr-2019 STKI Company Confiential 40 79 Copyright@STKI_2019 Do not remove source or attribution from any slide, graph or portion of graph 79 80 Copyright@STKI_2019 Do not remove source or attribution from any slide, graph or portion of graph 80 79 80
- 41. Apr-2019 STKI Company Confiential 41 81 Copyright@STKI_2019 Do not remove source or attribution from any slide, graph or portion of graph 81 82 Copyright@STKI_2019 Do not remove source or attribution from any slide, graph or portion of graph 82 81 82
- 42. Apr-2019 STKI Company Confiential 42 83 Copyright@STKI_2019 Do not remove source or attribution from any slide, graph or portion of graph 83 84 Copyright@STKI_2019 Do not remove source or attribution from any slide, graph or portion of graph 84 83 84
- 43. Apr-2019 STKI Company Confiential 43 85 Copyright@STKI_2019 Do not remove source or attribution from any slide, graph or portion of graph 85 86 Copyright@STKI_2019 Do not remove source or attribution from any slide, graph or portion of graph 86 85 86
- 44. Apr-2019 STKI Company Confiential 44 87 Copyright@STKI_2019 Do not remove source or attribution from any slide, graph or portion of graph 87 88 Copyright@STKI_2019 Do not remove source or attribution from any slide, graph or portion of graph 88 ISRAEL 2019 IT Budgets by Industry 87 88
- 45. Apr-2019 STKI Company Confiential 45 89 Copyright@STKI_2019 Do not remove source or attribution from any slide, graph or portion of graph 89IT Budgets according to INDUSTRIES 1 90 Copyright@STKI_2019 Do not remove source or attribution from any slide, graph or portion of graph 90 industry change from 2018 fin other 29.03% telecomm 13.04% media 11.11% banks 10.87% IT local vendors 9.09% transport 7.35% high tech 7.01% government 5.95% insurance 3.70% security 2.29% education 1.03% manuf -1.71% utilities -2.33% health -2.86% retail -3.36% SMB/SME -6.10% industry Budgets 2019 government $1,727 banks $1,020 high tech $901 manuf $860 security $537 insurance $420 fin other $400 SMB/SME $385 transport $365 health $340 education $295 telecomm $260 retail $230 utilities $210 media $200 IT local vendors $180 IT Budgets according to INDUSTRIES 2 89 90
- 46. Apr-2019 STKI Company Confiential 46 91 Copyright@STKI_2019 Do not remove source or attribution from any slide, graph or portion of graph 91 industry Market size public $2,899 financial $1,840 manuf/ retail $1,090 high tech/ IT $1,081 utilities/ transport $575 telecomm/ media $460 SMB $385 IT Budgets according to INDUSTRIES 3 92 Copyright@STKI_2019 Do not remove source or attribution from any slide, graph or portion of graph 92 91 92
- 47. Apr-2019 STKI Company Confiential 47 93 Copyright@STKI_2019 Do not remove source or attribution from any slide, graph or portion of graph 93 What is Happening in Israeli IT (from the STKI Summit 2019 presentations) 94 Copyright@STKI_2019 Do not remove source or attribution from any slide, graph or portion of graph 94 Israel IT Market 2019-2022 GAME CHANGERS IN INDUSTRIES FINANCIAL HEALTH GOVERNMENT AGENTS OF TRANSFORMATION NEW BREED OF : CIOS VENDORS BIG PROJECTS FOR 2019-2022 ERP V2020 CORE REPLACEMTS 93 94
- 48. Apr-2019 STKI Company Confiential 48 95 Copyright@STKI_2019 Do not remove source or attribution from any slide, graph or portion of graph 95 96 Copyright@STKI_2019 Do not remove source or attribution from any slide, graph or portion of graph 96 1. Advances in computing power together with societally changes 2. Usually at the same time a new “ecosystem of agents of transformation” is born: a. New breed of CIOs b. New breed of tech vendors 3. This “Agents of Transformation” are primed and equipped to drive change through innovation, culture and technology. What sets in motion an “IT TRANSFORMATION” 95 96
- 49. Apr-2019 STKI Company Confiential 49 97 Copyright@STKI_2019 Do not remove source or attribution from any slide, graph or portion of graph 97 Lost decade 98 Copyright@STKI_2019 Do not remove source or attribution from any slide, graph or portion of graph 98Agents of Transformation v1 Tech Vendors 1975 - 1998 1. Around 1974-5, the abrupt transfer of US military equipment, aid, and technological ties, gave birth to local IT vendors 2. Birth of the independent software integrator houses 3. Birth of independent software distributors representing international and local software firms selling tools 4. Several internal “software departments” are sold to private hands (ie. Malam, Yael, Tadiran Information Systems) 5. Introduction of the concept of a multi-vendor IT environment 6. Introduction of PCs and Minis (DG Nova & Eclipse; DEC VAX & PDP, IBM S/36 & S/38 and others) 97 98
- 50. Apr-2019 STKI Company Confiential 50 99 Copyright@STKI_2019 Do not remove source or attribution from any slide, graph or portion of graph 99Agents of Transformation v1 Tech Vendors 1975 - 1998 1. Around 1974-5, the abrupt transfer of US military equipment, aid, and technological ties, gave birth to local IT vendors 2. Birth of the independent software integrator houses 3. Birth of independent software distributors representing international and local software firms selling tools 4. Several internal “software departments” are sold to private hands (ie. Malam, Yael, Tadiran Information Systems) 5. Introduction of the concept of a multi-vendor IT environment 6. Introduction of PCs and Minis (DG Nova & Eclipse; DEC VAX & PDP, IBM S/36 & S/38 and others) 100 Copyright@STKI_2019 Do not remove source or attribution from any slide, graph or portion of graph 100Agents of Transformation v1 CIOs 1975 -1998 1. IDF employed exceptionally gifted youngsters with mathematics and cybernetics talents, for the development of first generation IDF IT. 2. Using Octal, PL/1, Adabas/Natural, Assembler and chinese gibberish (Hebrew letters) they developed clever programs and algorithms (some of which work until today) 3. Most IT units sat in one building and that pollinated innovation. 4. Highly experienced professionals in Mamram and other computer units entered the civilian market and wrote most of the “core” business applications that are working even today (finance, health, government, etc.) 5. Large groups of Mamram Alumni became CIOs of big organizations and CEOs of vendors. 99 100
- 51. Apr-2019 STKI Company Confiential 51 101 Copyright@STKI_2019 Do not remove source or attribution from any slide, graph or portion of graph 101Agents of Transformation v1 CIOs 1975 -1998 1. IDF employed exceptionally gifted youngsters with mathematics and cybernetics talents, for the development of first generation IDF IT. 2. Using Octal, PL/1, Adabas/Natural, Assembler and chinese gibberish (Hebrew letters) they developed clever programs and algorithms (some of which work until today) 3. Most IT units sat in one building and that pollinated innovation. 4. Highly experienced professionals in Mamram and other computer units entered the civilian market and wrote most of the “core” business applications that are working even today (finance, health, government, etc.) 5. Large groups of Mamram Alumni became CIOs of big organizations and CEOs of vendors. 102 Copyright@STKI_2019 Do not remove source or attribution from any slide, graph or portion of graph 102Agents of Transformation v2 Tech Vendors from 2011 1. At the end of 2018 we have over 500 vendors (range from small boutiques, large supermarket vendors, holding companies that manage several vendors, global hardware, software and services vendors and global & local consulting firms) 2. Top 5 vendor’s revenues are close to 60% of the market and have kept their management teams together for several years. Regulators have allowed a series of M&As that help the big companies form an oligopoly. 3. Although most of the global companies are American, we start to see Indian vendors entering the market. 4. Global consulting firms have entered very successfully into the market 5. Given the small market and high cost of localization (language and regulation) we see very few global ERP and core applications 101 102
- 52. Apr-2019 STKI Company Confiential 52 103 Copyright@STKI_2019 Do not remove source or attribution from any slide, graph or portion of graph 103Agents of Transformation v2 Tech Vendors from 2011 1. At the end of 2018 we have over 500 vendors (range from small boutiques, large supermarket vendors, holding companies that manage several vendors, global hardware, software and services vendors and global & local consulting firms) 2. Top 5 vendor’s revenues are close to 60% of the market and have kept their management teams together for several years. Regulators have allowed a series of M&As that help the big companies form an oligopoly. 3. Although most of the global companies are American, we start to see Indian vendors entering the market. 4. Global consulting firms have entered very successfully into the market 5. Given the small market and high cost of localization (language and regulation) we see very few global ERP and core applications 104 Copyright@STKI_2019 Do not remove source or attribution from any slide, graph or portion of graph 104Agents of Transformation v2 CIOs From 2011 1. The new “super” genius of the Israeli Tech Scene is a 8200 alumni. They are screened and picked because of their ability to learn quickly, adapt to change, succeed on a team and tackle what others see as impossible (so goes the legend). At the end of their service they usually go to one of the 5000 startups or start their own. 2. Another group that doesn’t come to IT are the alumni of the Technion, Hebrew, Tel-Aviv and Ben Gurion Universities. They go to research groups or startups. 3. IT recruits from other units in the IDF and of the several colleges that offer IT and CS degrees. 4. CEOs have started to find qualified CIOs from the business side and by doing this the culture of the IT departments is changing. 103 104
- 53. Apr-2019 STKI Company Confiential 53 105 Copyright@STKI_2019 Do not remove source or attribution from any slide, graph or portion of graph 105Agents of Transformation v2 CIOs From 2011 1. The new “super” genius of the Israeli Tech Scene is a 8200 alumni. They are screened and picked because of their ability to learn quickly, adapt to change, succeed on a team and tackle what others see as impossible (so goes the legend). At the end of their service they usually go to one of the 5000 startups or start their own. 2. Another group that doesn’t come to IT are the alumni of the Technion, Hebrew, Tel-Aviv and Ben Gurion Universities. They go to research groups or startups. 3. IT recruits from other units in the IDF and of the several colleges that offer IT and CS degrees. 4. CEOs have started to find qualified CIOs from the business side and by doing this the culture of the IT departments is changing. 106 Copyright@STKI_2019 Do not remove source or attribution from any slide, graph or portion of graph 106 this digital native individuals and their companies have created a gap between their rate of absorption of technology and the technology absorbed by enterprise IT 105 106
- 54. Apr-2019 STKI Company Confiential 54 107 Copyright@STKI_2019 Do not remove source or attribution from any slide, graph or portion of graph 107 108 Copyright@STKI_2019 Do not remove source or attribution from any slide, graph or portion of graph 108 Finance Industry Health Services IndustryGovernment IT Everything as a Service GAME CHANGERS that cause technology to adapt, disrupt and transform enterprises 107 108
- 55. Apr-2019 STKI Company Confiential 55 109 Copyright@STKI_2019 Do not remove source or attribution from any slide, graph or portion of graph 109 Pushing the market into developing new financial and technological instruments that will contribute to competition in the credit market and increased consumer well-being as they advance. Removing information gaps, leveraging existing information, and utilizing technological ability for informed analysis and learning in real time about the credit market will enable more correct pricing that is more in line with the risk to various layers of the credit market— households and small and medium businesses—thereby contributing to development of the market. Bank Israel changing the game in the Financial Services Industry Remarks by Bank of Israel Governor Prof. Amir Yaron (02/04/2019) 110 Copyright@STKI_2019 Do not remove source or attribution from any slide, graph or portion of graph 110 Pushing the market into developing new financial and technological instruments that will contribute to competition in the credit market and increased consumer well-being as they advance. Removing information gaps, leveraging existing information, and utilizing technological ability for informed analysis and learning in real time about the credit market will enable more correct pricing that is more in line with the risk to various layers of the credit market— households and small and medium businesses—thereby contributing to development of the market. Bank Israel changing the game in the Financial Services Industry Remarks by Bank of Israel Governor Prof. Amir Yaron (02/04/2019) 109 110
- 56. Apr-2019 STKI Company Confiential 56 111 Copyright@STKI_2019 Do not remove source or attribution from any slide, graph or portion of graph 111 • Requiring the banks to establish a board of directors committee for technology and innovation • Enabling banking corporations to implement cloud computing technology without obtaining a permit • Implementing regulation of an Open Banking Standard in israel. • Allowing open banking for data aggregation from the customer’s accounts at various banks, cost comparison of financial services, etc. • Allowing banks to become aggregators (platforms) by offering financial value to the customer and financial intermediation, consulting regarding financial behavior, initiated financial actions (payments, savings, and so forth), and more • Customers will be able to use their bank’s website to access information on a nonbank payment card • Implementation of the EMV standard in the payment card settlement market. • Adoption of contactless payments via mobile phones, removing barriers for new payment players from Israel and abroad and • forcing keying in a PIN code when paying with debit or credit cards • Allowing banks and credit card companies to increase their use of outsourcing • Allowing small banks, new credit card companies, and new digital banks to compensate for the ‘disadvantages of small size’ through outsourcing.” • Allowing for hosting new financial institutions on computer infrastructures of existing institutions • Customers will be able to open a first bank account digitally from the age of 16 The Banking Supervision Department (Bank of Israel) is 112 Copyright@STKI_2019 Do not remove source or attribution from any slide, graph or portion of graph 112 • Requiring the banks to establish a board of directors committee for technology and innovation • Enabling banking corporations to implement cloud computing technology without obtaining a permit • Implementing regulation of an Open Banking Standard in israel. • Allowing open banking for data aggregation from the customer’s accounts at various banks, cost comparison of financial services, etc. • Allowing banks to become aggregators (platforms) by offering financial value to the customer and financial intermediation, consulting regarding financial behavior, initiated financial actions (payments, savings, and so forth), and more • Customers will be able to use their bank’s website to access information on a nonbank payment card • Implementation of the EMV standard in the payment card settlement market. • Adoption of contactless payments via mobile phones, removing barriers for new payment players from Israel and abroad and • forcing keying in a PIN code when paying with debit or credit cards • Allowing banks and credit card companies to increase their use of outsourcing • Allowing small banks, new credit card companies, and new digital banks to compensate for the ‘disadvantages of small size’ through outsourcing.” • Allowing for hosting new financial institutions on computer infrastructures of existing institutions • Customers will be able to open a first bank account digitally from the age of 16 The Banking Supervision Department (Bank of Israel) is 111 112
- 57. Apr-2019 STKI Company Confiential 57 113 Copyright@STKI_2019 Do not remove source or attribution from any slide, graph or portion of graph 113 Government offices (local and central) will attempt the following projects ( ממשלה החלטת1933 ) (30.08.2016) which have to be finished by 2022: a. Data must be open for citizens/companies to use (open by default) b. Interconnection between all government bodies (ask it only once) c. Personal page for individuals and companies that includes all local and central pertinent information (cuts all bureaucracy) d. Central cloud for all infrastructure DC e. Several bodies (Bituach Leumi, Shaam and others) will modernize their systems f. Most software projects done by the government will publish their code into the open source world g. All offices are starting new customer facing projects (digital)in the next 24 months מס ממשלה החלטת'1933: לציבור ממשלתיים מידע מאגרי והנגשת הממשלתי המידע העברת שיפור 114 Copyright@STKI_2019 Do not remove source or attribution from any slide, graph or portion of graph 114 Government offices (local and central) will attempt the following projects ( ממשלה החלטת1933 ) (30.08.2016) which have to be finished by 2022: a. Data must be open for citizens/companies to use (open by default) b. Interconnection between all government bodies (ask it only once) c. Personal page for individuals and companies that includes all local and central pertinent information (cuts all bureaucracy) d. Central cloud for all infrastructure DC e. Several bodies (Bituach Leumi, Shaam and others) will modernize their systems f. Most software projects done by the government will publish their code into the open source world g. All offices are starting new customer facing projects (digital)in the next 24 months מס ממשלה החלטת'1933: לציבור ממשלתיים מידע מאגרי והנגשת הממשלתי המידע העברת שיפור 113 114
- 58. Apr-2019 STKI Company Confiential 58 115 Copyright@STKI_2019 Do not remove source or attribution from any slide, graph or portion of graph 115 HMOs are preparing to use wearable device data, AI ( ML/DL0), Telemedicine and other tech that can help in early diagnosis, in treatment and even reduce health care costs 1. Personalized Medicine and “patient at home” require new data centric initiatives 2. Programable wearables that produce and transmit real time massive amounts of data a) Real-time analytics initiative to store and react to data coming in b) Artificial Intelligence initiative in order to make sense of that data, and track small changes as they happen and together with medical staff make personal diagnosis and treatment 3. Automating most of the processes (RPAs) in the backoffice and in the interaction between medical staff and patients 4. Many more 116 Copyright@STKI_2019 Do not remove source or attribution from any slide, graph or portion of graph 116 HMOs are preparing to use wearable device data, AI ( ML/DL0), Telemedicine and other tech that can help in early diagnosis, in treatment and even reduce health care costs 1. Personalized Medicine and “patient at home” require new data centric initiatives 2. Programable wearables that produce and transmit real time massive amounts of data a) Real-time analytics initiative to store and react to data coming in b) Artificial Intelligence initiative in order to make sense of that data, and track small changes as they happen and together with medical staff make personal diagnosis and treatment 3. Automating most of the processes (RPAs) in the backoffice and in the interaction between medical staff and patients 4. Many more 115 116
- 59. Apr-2019 STKI Company Confiential 59 117 Copyright@STKI_2019 Do not remove source or attribution from any slide, graph or portion of graph 117 Hybrid IT is THE real game changer: • Array of à la carte technological options such as hardware, software, or services sourced from a blend of in-house and cloud vendors. • Open Source based solutions will best meet the needs of Hybrid IT environments . 118 Copyright@STKI_2019 Do not remove source or attribution from any slide, graph or portion of graph 118 1250 companies/ organizations with IT departments most of them will introduce hybrid cloud solutions SMBs that will make sure that they have all IT as “cloud” solutions most companies with older versions ERP CRM IT that will migrate to “cloud first” solutions organizations that will go to the cloud in next 5 years 117 118
- 60. Apr-2019 STKI Company Confiential 60 119 Copyright@STKI_2019 Do not remove source or attribution from any slide, graph or portion of graph 119 1250 companies/ organizations with IT departments most of them will introduce hybrid cloud solutions SMBs that will make sure that they have all IT as “cloud” solutions most companies with older versions ERP CRM IT that will migrate to “cloud first” solutions organizations that will go to the cloud in next 5 years 120 Copyright@STKI_2019 Do not remove source or attribution from any slide, graph or portion of graph 120On-Prem, Hosted, PaaS and SaaS applications are not the same, very different 119 120
- 61. Apr-2019 STKI Company Confiential 61 121 Copyright@STKI_2019 Do not remove source or attribution from any slide, graph or portion of graph 121On-Prem, Hosted, PaaS and SaaS applications are not the same, very different 122 Copyright@STKI_2019 Do not remove source or attribution from any slide, graph or portion of graph 122 OPEN-SOURCE SOFTWARE is quickly becoming standard among developers (they see how many other developers trust the specific software and so assess if will work for them) Vendors (although anyone can use, download, or modify the code for free) have 3 profitable options with this products: 1. implement and support the product, 2. teach about the product 3. make the product better in some way OPEN-SOURCE-CENTRIC software companies at the center of some major M&As • Salesforce acquired Mulesoft • Microsoft acquired GitHub • VMware acquired Heptio • IBM acquired Red Hat • Cloudera and Hortonworks merged • Elastic went public • Others…. Open Source is king in the Hybrid IT World 121 122
- 62. Apr-2019 STKI Company Confiential 62 123 Copyright@STKI_2019 Do not remove source or attribution from any slide, graph or portion of graph 123 OPEN-SOURCE SOFTWARE is quickly becoming standard among developers (they see how many other developers trust the specific software and so assess if will work for them) Vendors (although anyone can use, download, or modify the code for free) have 3 profitable options with this products: 1. implement and support the product, 2. teach about the product 3. make the product better in some way OPEN-SOURCE-CENTRIC software companies at the center of some major M&As • Salesforce acquired Mulesoft • Microsoft acquired GitHub • VMware acquired Heptio • IBM acquired Red Hat • Cloudera and Hortonworks merged • Elastic went public • Others…. Open Source is king in the Hybrid IT World 124 Copyright@STKI_2019 Do not remove source or attribution from any slide, graph or portion of graph 124 123 124
- 63. Apr-2019 STKI Company Confiential 63 125 Copyright@STKI_2019 Do not remove source or attribution from any slide, graph or portion of graph 125 25 financial companies will either attempt to change their financial core systems or do a modernization of their present systems. All this companies have started or will start in the next 24 months customer facing systems (usually cloud) 5-7 new financial (credit, insurance and banking) (completely digital) will re-build their complete Backoffice and customer centric systems Most projects will start in 2019-2020 although some have started already Modernization of CORE Financial Systems 126 Copyright@STKI_2019 Do not remove source or attribution from any slide, graph or portion of graph 126 Oracle, Microsoft, Priority and SAP Business One users will move their ERP/CRM systems to new versions and move to the cloud . • There will be move from larger ERP systems to NetSuite and Priority • SAP Business One will retain most of its clients • Most SMBs will move their ERP to the cloud • Many of the other “local” ERPs will lose ground to the top 4 (NetSuite, Priority, SAP Business one , Microsoft) 120 companies in Israel have SAP (most of them have moved from R/3 to ECC EHP7 or ECC EHP8). a. By 2025 most if not all will have moved or will be in the process of moving into S4Hana (around 200k users at 3kUSD each) and hybrid ERP model b. A minority ( smaller companies where SAP is not part of the core business systems) will decide to move into cloud-based systems . Not more than 15-20 companies c. The start of projects will be like a bell distribution with the center around 2022, starting 2020 and finishing in 2027 ERP V 2020 125 126
- 64. Apr-2019 STKI Company Confiential 64 127 Copyright@STKI_2019 Do not remove source or attribution from any slide, graph or portion of graph 127 ISRAEL 2019 Total IT Market Statistics 128 Copyright@STKI_2019 Do not remove source or attribution from any slide, graph or portion of graph 128 127 128
- 65. Apr-2019 STKI Company Confiential 65 129 Copyright@STKI_2019 Do not remove source or attribution from any slide, graph or portion of graph 129 130 Copyright@STKI_2019 Do not remove source or attribution from any slide, graph or portion of graph 130 129 130
- 66. Apr-2019 STKI Company Confiential 66 131 Copyright@STKI_2019 Do not remove source or attribution from any slide, graph or portion of graph 131 132 Copyright@STKI_2019 Do not remove source or attribution from any slide, graph or portion of graph 132 131 132
- 67. Apr-2019 STKI Company Confiential 67 133 Copyright@STKI_2019 Do not remove source or attribution from any slide, graph or portion of graph DISTRIBUTORS (usually are not shown in our study) are intermediary reseller entities; between the original MANUFACTURERS OF HARDWARE PRODUCTS or SOFTWARE HOUSES and other entities in the distribution channel (VARs and INTEGRATORS). VALUE-ADDED RESELLERS (VARs) offer third party software and hardware to the end user or integrators at a markup, along with a limited combination of procurement consulting, configuration, and customization services (shown under HARDWARE or SOFTWARE) INTEGRATORS offer professional’s services (consulting, developing, implementing or sourcing manpower) in order to deliver enterprise computer services to the organization. (shown under VALUE ADDED SERVICES ). 134 Copyright@STKI_2019 Do not remove source or attribution from any slide, graph or portion of graph Area company occupies in the circle is not relevant and has no meaning. STKI has signed NDAs with the vendors (revenues, projects) and we tried to minimize opportunities for backward engineering of the data . 133 134
- 68. Apr-2019 STKI Company Confiential 68 135 Copyright@STKI_2019 Do not remove source or attribution from any slide, graph or portion of graph “Israeli Positioning” slides This is NOT a technological or functional positioning and SHOULD NOT be used as such. This positioning is intendent to reflect ONLY THE DEGREE to which a product is PRESENT AND SUPPORTED IN ISRAEL 136 Copyright@STKI_2019 Do not remove source or attribution from any slide, graph or portion of graph X axis (Market Presence) Installed base; New sales; Mindshare Y axis (Local Support): Number and quality of support experts, it’s localization and language support and if there is local R&D Israeli Product Positioning Slides Vendors to watch New players that only recently entered the market and therefore cannot be evaluated against longtime players Global leaders according to international analyst firms 135 136
- 69. Apr-2019 STKI Company Confiential 69 137 Copyright@STKI_2019 Do not remove source or attribution from any slide, graph or portion of graph 137 HARDWARE MARKET 2018 138 Copyright@STKI_2019 Do not remove source or attribution from any slide, graph or portion of graph 138 137 138
- 70. Apr-2019 STKI Company Confiential 70 139 Copyright@STKI_2019 Do not remove source or attribution from any slide, graph or portion of graph 139TOP VENDORS: Hardware Markets manufacturers local VARS 140 Copyright@STKI_2019 Do not remove source or attribution from any slide, graph or portion of graph 140 141 156 149 152 162 165 139 140
- 71. Apr-2019 STKI Company Confiential 71 141 Copyright@STKI_2019 Do not remove source or attribution from any slide, graph or portion of graph 141 servers 142 Copyright@STKI_2019 Do not remove source or attribution from any slide, graph or portion of graph 142 Servers: manufacturers 141 142
- 72. Apr-2019 STKI Company Confiential 72 143 Copyright@STKI_2019 Do not remove source or attribution from any slide, graph or portion of graph 143 Servers: VARS 144 Copyright@STKI_2019 Do not remove source or attribution from any slide, graph or portion of graph 144General Purpose Intel Server: Positioning 143 144
- 73. Apr-2019 STKI Company Confiential 73 145 Copyright@STKI_2019 Do not remove source or attribution from any slide, graph or portion of graph 145 Servers: Legacy (non-x86) manufacturers local VARS 146 Copyright@STKI_2019 Do not remove source or attribution from any slide, graph or portion of graph 146Servers: DB/DW, Converged HW and Appliances manufacturers 145 146
- 74. Apr-2019 STKI Company Confiential 74 147 Copyright@STKI_2019 Do not remove source or attribution from any slide, graph or portion of graph 147 VARS Servers: DB/DW, Converged HW and Appliances 148 Copyright@STKI_2019 Do not remove source or attribution from any slide, graph or portion of graph 148HCI Hyper Converged Solutions – Positioning 147 148
- 75. Apr-2019 STKI Company Confiential 75 149 Copyright@STKI_2019 Do not remove source or attribution from any slide, graph or portion of graph 149 clients (PCs) (commercial use only) 150 Copyright@STKI_2019 Do not remove source or attribution from any slide, graph or portion of graph 150clients (PCs) (commercial use only) 149 150
- 76. Apr-2019 STKI Company Confiential 76 151 Copyright@STKI_2019 Do not remove source or attribution from any slide, graph or portion of graph 151clients (PCs) (commercial use only) VARS 152 Copyright@STKI_2019 Do not remove source or attribution from any slide, graph or portion of graph 152 storage appliances 151 152
- 77. Apr-2019 STKI Company Confiential 77 153 Copyright@STKI_2019 Do not remove source or attribution from any slide, graph or portion of graph 153Enterprise Storage HW (Drives, VTL's, Tapes, Storage Networking) 154 Copyright@STKI_2019 Do not remove source or attribution from any slide, graph or portion of graph 154Enterprise Storage HW (Drives, VTL's, Tapes, Storage Networking) VARS 153 154
- 78. Apr-2019 STKI Company Confiential 78 155 Copyright@STKI_2019 Do not remove source or attribution from any slide, graph or portion of graph 155Enterprise Storage Solutions: Positioning 156 Copyright@STKI_2019 Do not remove source or attribution from any slide, graph or portion of graph 156 networking, VoIP, security appliances 2017 2018 2019 2020 Enterprise Networking 215,000 2.33% 220,000 2.27% 225,000 2.27% 230,100 Security / Cyber 138,000 7.25% 148,000 5.41% 156,000 3.85% 162,000 VoIP/Call Center Equipment 49,500 4.04% 51,500 2.91% 53,000 3.77% 55,000 total 402,500 4.22% 419,500 3.46% 434,000 3.02% 447,100 2017 2018 2019 2020 155 156
- 79. Apr-2019 STKI Company Confiential 79 157 Copyright@STKI_2019 Do not remove source or attribution from any slide, graph or portion of graph 157Enterprise Networking manufacturers 158 Copyright@STKI_2019 Do not remove source or attribution from any slide, graph or portion of graph 158Enterprise Networking VARS 157 158
- 80. Apr-2019 STKI Company Confiential 80 159 Copyright@STKI_2019 Do not remove source or attribution from any slide, graph or portion of graph 159Security / Cyber Appliances manufacturers 160 Copyright@STKI_2019 Do not remove source or attribution from any slide, graph or portion of graph 160Security / Cyber Appliances VARS 159 160
- 81. Apr-2019 STKI Company Confiential 81 161 Copyright@STKI_2019 Do not remove source or attribution from any slide, graph or portion of graph 161VoIP/Call Center Equipment manufacturers local VARS 162 Copyright@STKI_2019 Do not remove source or attribution from any slide, graph or portion of graph 162 self-service & data-center equipment 161 162
- 82. Apr-2019 STKI Company Confiential 82 163 Copyright@STKI_2019 Do not remove source or attribution from any slide, graph or portion of graph 163 Data Center Physical Equipment 164 Copyright@STKI_2019 Do not remove source or attribution from any slide, graph or portion of graph 164 POS +Self Service (ATM/Kiosks/other) 163 164
- 83. Apr-2019 STKI Company Confiential 83 165 Copyright@STKI_2019 Do not remove source or attribution from any slide, graph or portion of graph 165 miscellaneous products (for enterprises only) 166 Copyright@STKI_2019 Do not remove source or attribution from any slide, graph or portion of graph 166Printers, Video, Monitors, Cassettes, others manufacturers local VARS 165 166
- 84. Apr-2019 STKI Company Confiential 84 167 Copyright@STKI_2019 Do not remove source or attribution from any slide, graph or portion of graph 167 SOFTWARE MARKET 2018 168 Copyright@STKI_2019 Do not remove source or attribution from any slide, graph or portion of graph 168 167 168
- 85. Apr-2019 STKI Company Confiential 85 169 Copyright@STKI_2019 Do not remove source or attribution from any slide, graph or portion of graph 169TOP VENDORS: Software Markets Software Companies Software VARS 170 Copyright@STKI_2019 Do not remove source or attribution from any slide, graph or portion of graph 170 171 253235 208 191 196 177 183 169 170
- 86. Apr-2019 STKI Company Confiential 86 171 Copyright@STKI_2019 Do not remove source or attribution from any slide, graph or portion of graph 171 System Infrastructure Tools 172 Copyright@STKI_2019 Do not remove source or attribution from any slide, graph or portion of graph 172Infrastructure Software (OS, Middleware Virtualization, backup, infra automation, private cloud) Software Companies 171 172
- 87. Apr-2019 STKI Company Confiential 87 173 Copyright@STKI_2019 Do not remove source or attribution from any slide, graph or portion of graph 173Infrastructure Software (OS, Middleware Virtualization, backup, infra automation, private cloud) Software VARS 174 Copyright@STKI_2019 Do not remove source or attribution from any slide, graph or portion of graph 174Enterprise Backup Solutions: Positioning 173 174
- 88. Apr-2019 STKI Company Confiential 88 175 Copyright@STKI_2019 Do not remove source or attribution from any slide, graph or portion of graph 175 Software Companies Databases (SQL NO-SQL) 176 Copyright@STKI_2019 Do not remove source or attribution from any slide, graph or portion of graph 176 Software VARS Databases (SQL NO-SQL) 175 176
- 89. Apr-2019 STKI Company Confiential 89 177 Copyright@STKI_2019 Do not remove source or attribution from any slide, graph or portion of graph 177 Middleware Tools 2017 2018 2019 2020 AppWEB server,API, ESB, SOA, BPM, ETL, FTP, Emulation, Messaging, BRMS etc. 56,000 4.46% 58,500 3.42% 60,500 4.13% 63,000 2017 2018 2019 2020 178 Copyright@STKI_2019 Do not remove source or attribution from any slide, graph or portion of graph 178 Software Companies AppWEB Server, ESB, SOA, BPM, ETL, FTP, Emulation, Messaging, BRMS API Mngt. APaaS, …….. 177 178
- 90. Apr-2019 STKI Company Confiential 90 179 Copyright@STKI_2019 Do not remove source or attribution from any slide, graph or portion of graph 179 Software VARS AppWEB Server, ESB, SOA, BPM, ETL, FTP, Emulation, Messaging, BRMS API Mngt. APaaS, …….. 180 Copyright@STKI_2019 Do not remove source or attribution from any slide, graph or portion of graph 180Application Platform as a Service (APaaS): Positioning 179 180
- 91. Apr-2019 STKI Company Confiential 91 181 Copyright@STKI_2019 Do not remove source or attribution from any slide, graph or portion of graph 181 APaaS Solutions 182 Copyright@STKI_2019 Do not remove source or attribution from any slide, graph or portion of graph 182API Management : Positioning 181 182
- 92. Apr-2019 STKI Company Confiential 92 183 Copyright@STKI_2019 Do not remove source or attribution from any slide, graph or portion of graph 183 IT Management Tools IT Service (ITSM) Business Service Management (BSM) 184 Copyright@STKI_2019 Do not remove source or attribution from any slide, graph or portion of graph 184IT Operations (Asset Management, APM, Monitoring) and Workload-Scheduling excluding ITSM Software Companies 183 184
- 93. Apr-2019 STKI Company Confiential 93 185 Copyright@STKI_2019 Do not remove source or attribution from any slide, graph or portion of graph 185Job Scheduling Solutions: Positioning 186 Copyright@STKI_2019 Do not remove source or attribution from any slide, graph or portion of graph 186IT Operations (Asset Management, APM, Monitoring) and Workload-Scheduling excluding ITSM Software VARS 185 186
- 94. Apr-2019 STKI Company Confiential 94 187 Copyright@STKI_2019 Do not remove source or attribution from any slide, graph or portion of graph 187Software CompaniesITSM - Service Desk 188 Copyright@STKI_2019 Do not remove source or attribution from any slide, graph or portion of graph 188Software VARSITSM - Service Desk 187 188
- 95. Apr-2019 STKI Company Confiential 95 189 Copyright@STKI_2019 Do not remove source or attribution from any slide, graph or portion of graph 189Dedicated IT Service Desk– Positioning 190 Copyright@STKI_2019 Do not remove source or attribution from any slide, graph or portion of graph 190 189 190
- 96. Apr-2019 STKI Company Confiential 96 191 Copyright@STKI_2019 Do not remove source or attribution from any slide, graph or portion of graph 191 Security Software Tools 192 Copyright@STKI_2019 Do not remove source or attribution from any slide, graph or portion of graph 192 Software Companies Security/ Cyber Software Vendors 191 192
- 97. Apr-2019 STKI Company Confiential 97 193 Copyright@STKI_2019 Do not remove source or attribution from any slide, graph or portion of graph 193 Software Companies Small Boutiques Security/ Cyber Software Vendors 194 Copyright@STKI_2019 Do not remove source or attribution from any slide, graph or portion of graph 194 Software VARS Security/ Cyber Software Vendors 193 194
- 98. Apr-2019 STKI Company Confiential 98 195 Copyright@STKI_2019 Do not remove source or attribution from any slide, graph or portion of graph 195 Software VARS Small Boutiques Security/ Cyber Software Vendors 196 Copyright@STKI_2019 Do not remove source or attribution from any slide, graph or portion of graph 196 Office of the CIO & Governance Tools 195 196
- 99. Apr-2019 STKI Company Confiential 99 197 Copyright@STKI_2019 Do not remove source or attribution from any slide, graph or portion of graph 197 Software Companies Project & Portfolio Management 198 Copyright@STKI_2019 Do not remove source or attribution from any slide, graph or portion of graph 198 Software VARS Project & Portfolio Management 197 198
- 100. Apr-2019 STKI Company Confiential 100 199 Copyright@STKI_2019 Do not remove source or attribution from any slide, graph or portion of graph 199PPM: Positioning 200 Copyright@STKI_2019 Do not remove source or attribution from any slide, graph or portion of graph 200PPM Tools & Integrators 199 200
- 101. Apr-2019 STKI Company Confiential 101 201 Copyright@STKI_2019 Do not remove source or attribution from any slide, graph or portion of graph 201 20 1 PPM 2 Tools & Integrators 202 Copyright@STKI_2019 Do not remove source or attribution from any slide, graph or portion of graph 202 Software Companies Enterprise Governance, Risk and Compliance (EGRC) 201 202
- 102. Apr-2019 STKI Company Confiential 102 203 Copyright@STKI_2019 Do not remove source or attribution from any slide, graph or portion of graph 203 Software VARS Enterprise Governance, Risk and Compliance (EGRC) 204 Copyright@STKI_2019 Do not remove source or attribution from any slide, graph or portion of graph 204 Development Tools 203 204
- 103. Apr-2019 STKI Company Confiential 103 205 Copyright@STKI_2019 Do not remove source or attribution from any slide, graph or portion of graph 205 Software Companies Development and ALM (including Testing Tools) for all environments (including Mobile) 206 Copyright@STKI_2019 Do not remove source or attribution from any slide, graph or portion of graph 206 Software VARS Development and ALM (including Testing Tools) for all environments (including Mobile) 205 206
- 104. Apr-2019 STKI Company Confiential 104 207 Copyright@STKI_2019 Do not remove source or attribution from any slide, graph or portion of graph 207 Dedicated Low Code platforms 208 Copyright@STKI_2019 Do not remove source or attribution from any slide, graph or portion of graph 208 Information Management Applications 207 208
- 105. Apr-2019 STKI Company Confiential 105 209 Copyright@STKI_2019 Do not remove source or attribution from any slide, graph or portion of graph 209 Software Companies Knowledge Management (Enterprise Portals, ECM, Search, Collaboration Tools, E-service Knowledge Bases) 210 Copyright@STKI_2019 Do not remove source or attribution from any slide, graph or portion of graph 210 Software VARS Knowledge Management (Enterprise Portals, ECM, Search, Collaboration Tools, E-service Knowledge Bases) 209 210
- 106. Apr-2019 STKI Company Confiential 106 211 Copyright@STKI_2019 Do not remove source or attribution from any slide, graph or portion of graph 211ECM Platform: Positioning 212 Copyright@STKI_2019 Do not remove source or attribution from any slide, graph or portion of graph 212Internal ECM Players 211 212
- 107. Apr-2019 STKI Company Confiential 107 213 Copyright@STKI_2019 Do not remove source or attribution from any slide, graph or portion of graph 213Enterprise Portals: Positioning 214 Copyright@STKI_2019 Do not remove source or attribution from any slide, graph or portion of graph 214 Enterprise Portals 213 214
- 108. Apr-2019 STKI Company Confiential 108 215 Copyright@STKI_2019 Do not remove source or attribution from any slide, graph or portion of graph 215Dedicated E-service Knowledge-Bases: Positioning 216 Copyright@STKI_2019 Do not remove source or attribution from any slide, graph or portion of graph 216 Dedicated E-service Knowledgebases 215 216
- 109. Apr-2019 STKI Company Confiential 109 217 Copyright@STKI_2019 Do not remove source or attribution from any slide, graph or portion of graph 217Enterprise Collaboration Tools (Partial list) : Part 1 218 Copyright@STKI_2019 Do not remove source or attribution from any slide, graph or portion of graph 218 Open source Enterprise Collaboration Tools (Partial list) : Part 2 217 218
- 110. Apr-2019 STKI Company Confiential 110 219 Copyright@STKI_2019 Do not remove source or attribution from any slide, graph or portion of graph 219 Enterprise Search Open source 220 Copyright@STKI_2019 Do not remove source or attribution from any slide, graph or portion of graph 220BI, Analytics , Fraud, Risk and Data Mgmt. Tools Aqurate 219 220
- 111. Apr-2019 STKI Company Confiential 111 221 Copyright@STKI_2019 Do not remove source or attribution from any slide, graph or portion of graph 221BI and Discovery Analysis : Positioning 222 Copyright@STKI_2019 Do not remove source or attribution from any slide, graph or portion of graph 222BI General Platforms - Part 1 221 222
- 112. Apr-2019 STKI Company Confiential 112 223 Copyright@STKI_2019 Do not remove source or attribution from any slide, graph or portion of graph 223 BI General Platforms - Part 2 224 Copyright@STKI_2019 Do not remove source or attribution from any slide, graph or portion of graph 224Analytics & Data Science Platforms: Positioning 223 224
- 113. Apr-2019 STKI Company Confiential 113 225 Copyright@STKI_2019 Do not remove source or attribution from any slide, graph or portion of graph 225Data Science Platforms – Part 1 226 Copyright@STKI_2019 Do not remove source or attribution from any slide, graph or portion of graph 226Data Science Platforms – Part 2 225 226
- 114. Apr-2019 STKI Company Confiential 114 227 Copyright@STKI_2019 Do not remove source or attribution from any slide, graph or portion of graph 227Data Virtualization Tools 228 Copyright@STKI_2019 Do not remove source or attribution from any slide, graph or portion of graph 228Data Preparation & Data Catalog Tools 227 228
- 115. Apr-2019 STKI Company Confiential 115 229 Copyright@STKI_2019 Do not remove source or attribution from any slide, graph or portion of graph 229 DMP – Players 230 Copyright@STKI_2019 Do not remove source or attribution from any slide, graph or portion of graph 230 CDP – Players 229 230
- 116. Apr-2019 STKI Company Confiential 116 231 Copyright@STKI_2019 Do not remove source or attribution from any slide, graph or portion of graph 231Digital Output Management Customer Communication Management 232 Copyright@STKI_2019 Do not remove source or attribution from any slide, graph or portion of graph 232Web Accessibility Software 231 232
- 117. Apr-2019 STKI Company Confiential 117 233 Copyright@STKI_2019 Do not remove source or attribution from any slide, graph or portion of graph 233Web Accessibility: Positioning 234 Copyright@STKI_2019 Do not remove source or attribution from any slide, graph or portion of graph 234 Web Accessibility Platforms 233 234
- 118. Apr-2019 STKI Company Confiential 118 235 Copyright@STKI_2019 Do not remove source or attribution from any slide, graph or portion of graph 235 Business Applications 1 236 Copyright@STKI_2019 Do not remove source or attribution from any slide, graph or portion of graph 236ERP software (on-prem, hosted, cloud, SaaS) 235 236
- 119. Apr-2019 STKI Company Confiential 119 237 Copyright@STKI_2019 Do not remove source or attribution from any slide, graph or portion of graph 237Large-Scale ERP Positioning 238 Copyright@STKI_2019 Do not remove source or attribution from any slide, graph or portion of graph 238SMB + Mid-Large ERP: Positioning 237 238
- 120. Apr-2019 STKI Company Confiential 120 239 Copyright@STKI_2019 Do not remove source or attribution from any slide, graph or portion of graph 239 ERP Packages & Integrators: Part 1 240 Copyright@STKI_2019 Do not remove source or attribution from any slide, graph or portion of graph 240 ERP Packages & Integrators: Part 2 239 240
- 121. Apr-2019 STKI Company Confiential 121 241 Copyright@STKI_2019 Do not remove source or attribution from any slide, graph or portion of graph 241CRM/XRM software (on-prem, hosted, cloud, SaaS) 242 Copyright@STKI_2019 Do not remove source or attribution from any slide, graph or portion of graph 242CRM Platforms: Positioning 241 242
- 122. Apr-2019 STKI Company Confiential 122 243 Copyright@STKI_2019 Do not remove source or attribution from any slide, graph or portion of graph 243 CRM Packages - Part 1 244 Copyright@STKI_2019 Do not remove source or attribution from any slide, graph or portion of graph 244CRM Packages - Part 2 243 244
- 123. Apr-2019 STKI Company Confiential 123 245 Copyright@STKI_2019 Do not remove source or attribution from any slide, graph or portion of graph 245Core vertical business applications (on-prem, hosted, cloud, PaaS, SaaS) (such as billing, core banking etc.) 246 Copyright@STKI_2019 Do not remove source or attribution from any slide, graph or portion of graph 246Core vertical business applications (on-prem, hosted, cloud, PaaS, SaaS) (such as billing, core banking etc.) Small Boutiques 245 246
- 124. Apr-2019 STKI Company Confiential 124 247 Copyright@STKI_2019 Do not remove source or attribution from any slide, graph or portion of graph 247HR/ Talent Mgmt. / LMS/ Payroll (on-prem, hosted, cloud, PaaS, SaaS) 248 Copyright@STKI_2019 Do not remove source or attribution from any slide, graph or portion of graph 248HR, Talent Mngt. and Payroll Suites: Positioning 247 248
- 125. Apr-2019 STKI Company Confiential 125 249 Copyright@STKI_2019 Do not remove source or attribution from any slide, graph or portion of graph 249HCM, Payroll & Talent Management Suites: part 1 250 Copyright@STKI_2019 Do not remove source or attribution from any slide, graph or portion of graph 250 HCM, Payroll & Talent Management Suites: part 2 249 250
- 126. Apr-2019 STKI Company Confiential 126 251 Copyright@STKI_2019 Do not remove source or attribution from any slide, graph or portion of graph 251LMS only (Learning Management Systems) LMS module as part of HCM/Talent Management suites 252 Copyright@STKI_2019 Do not remove source or attribution from any slide, graph or portion of graph 252 HCM Analytics 251 252
- 127. Apr-2019 STKI Company Confiential 127 253 Copyright@STKI_2019 Do not remove source or attribution from any slide, graph or portion of graph 253 Business Applications 2 254 Copyright@STKI_2019 Do not remove source or attribution from any slide, graph or portion of graph 254Contact Center And Multi Channel Engagement Tools (Chatbots, Virtual IVR, Video, etc.…) 253 254
- 128. Apr-2019 STKI Company Confiential 128 255 Copyright@STKI_2019 Do not remove source or attribution from any slide, graph or portion of graph 255Contact Center And Multi Channel Engagement Tools (Chatbots, Virtual IVR, Video, etc.…) Small Boutiques 256 Copyright@STKI_2019 Do not remove source or attribution from any slide, graph or portion of graph 256 Omni – Channel Platforms 255 256
- 129. Apr-2019 STKI Company Confiential 129 257 Copyright@STKI_2019 Do not remove source or attribution from any slide, graph or portion of graph 257Bots Platforms and Products: Part1 258 Copyright@STKI_2019 Do not remove source or attribution from any slide, graph or portion of graph 258Bots Platforms and Products: Part 2 257 258
- 130. Apr-2019 STKI Company Confiential 130 259 Copyright@STKI_2019 Do not remove source or attribution from any slide, graph or portion of graph 259Web Content Management + e-Commerce Platforms 260 Copyright@STKI_2019 Do not remove source or attribution from any slide, graph or portion of graph 260Web Content Management Tools - Part 1 259 260
- 131. Apr-2019 STKI Company Confiential 131 261 Copyright@STKI_2019 Do not remove source or attribution from any slide, graph or portion of graph 261 Open source Web Content Management Tools - Part 2 262 Copyright@STKI_2019 Do not remove source or attribution from any slide, graph or portion of graph 262e-Commerce Packages 261 262
- 132. Apr-2019 STKI Company Confiential 132 263 Copyright@STKI_2019 Do not remove source or attribution from any slide, graph or portion of graph 263 IoT Tools and Platforms 264 Copyright@STKI_2019 Do not remove source or attribution from any slide, graph or portion of graph 264 Blockchain Software Platforms 263 264
- 133. Apr-2019 STKI Company Confiential 133 265 Copyright@STKI_2019 Do not remove source or attribution from any slide, graph or portion of graph 265 Robotic Process Automation (RPA) Tools 266 Copyright@STKI_2019 Do not remove source or attribution from any slide, graph or portion of graph 266 RPA Solutions: Positioning 265 266
- 134. Apr-2019 STKI Company Confiential 134 267 Copyright@STKI_2019 Do not remove source or attribution from any slide, graph or portion of graph 267RPA Tools & Integrators 267 Global leader 268 Copyright@STKI_2019 Do not remove source or attribution from any slide, graph or portion of graph 268Marketing Automation Software (on-prem, hosted, cloud, SaaS) 267 268
- 135. Apr-2019 STKI Company Confiential 135 269 Copyright@STKI_2019 Do not remove source or attribution from any slide, graph or portion of graph 269Marketing Automation Solutions: Positioning 270 Copyright@STKI_2019 Do not remove source or attribution from any slide, graph or portion of graph 270 Marketing Automation Platforms – Part 1 269 270
- 136. Apr-2019 STKI Company Confiential 136 271 Copyright@STKI_2019 Do not remove source or attribution from any slide, graph or portion of graph 271 Marketing Automation Platforms – Part 2 272 Copyright@STKI_2019 Do not remove source or attribution from any slide, graph or portion of graph 272 Package Israeli rep/Partner SAP - Qualtrics SAP Israel, B-Pro Verint Verint Nice Nice Howazit Howazit Almago Voco Matrix VOC (Voice of the Customer) Players 271 272
- 137. Apr-2019 STKI Company Confiential 137 273 Copyright@STKI_2019 Do not remove source or attribution from any slide, graph or portion of graph 273 (Real time) Engagement Decision Hubs 274 Copyright@STKI_2019 Do not remove source or attribution from any slide, graph or portion of graph 274 Customer Experience/ Journey Analytics 273 274
- 138. Apr-2019 STKI Company Confiential 138 275 Copyright@STKI_2019 Do not remove source or attribution from any slide, graph or portion of graph 275 VALUE ADDED MARKET 2018 276 Copyright@STKI_2019 Do not remove source or attribution from any slide, graph or portion of graph 276 275 276
- 139. Apr-2019 STKI Company Confiential 139 277 Copyright@STKI_2019 Do not remove source or attribution from any slide, graph or portion of graph 277TOP 10 VENDORS: Value-Added Services Markets 278 Copyright@STKI_2019 Do not remove source or attribution from any slide, graph or portion of graph 278 340 306 279 316 324 291 309 313 294 327 351 335 346 277 278
- 140. Apr-2019 STKI Company Confiential 140 279 Copyright@STKI_2019 Do not remove source or attribution from any slide, graph or portion of graph 279 Enterprise Consulting 280 Copyright@STKI_2019 Do not remove source or attribution from any slide, graph or portion of graph 280IT Strategy Consulting & IT Analyst Firms 279 280
- 141. Apr-2019 STKI Company Confiential 141 281 Copyright@STKI_2019 Do not remove source or attribution from any slide, graph or portion of graph 281 Digital Transformation & Innovation Consulting 282 Copyright@STKI_2019 Do not remove source or attribution from any slide, graph or portion of graph 282 Digital Transformation & Innovation Consulting Small Boutiques 281 282
- 142. Apr-2019 STKI Company Confiential 142 283 Copyright@STKI_2019 Do not remove source or attribution from any slide, graph or portion of graph 283Data Consulting 284 Copyright@STKI_2019 Do not remove source or attribution from any slide, graph or portion of graph 284Data Consulting Small Boutiques 283 284
- 143. Apr-2019 STKI Company Confiential 143 285 Copyright@STKI_2019 Do not remove source or attribution from any slide, graph or portion of graph 285 IT Infrastructure, Delivery, Licensing Consulting 286 Copyright@STKI_2019 Do not remove source or attribution from any slide, graph or portion of graph 286 IT Infrastructure, Delivery, Licensing Consulting Small Boutiques 285 286
- 144. Apr-2019 STKI Company Confiential 144 287 Copyright@STKI_2019 Do not remove source or attribution from any slide, graph or portion of graph 287IT Application Consulting 288 Copyright@STKI_2019 Do not remove source or attribution from any slide, graph or portion of graph 288 CX (Customer Experience) Consulting and Design 287 288
- 145. Apr-2019 STKI Company Confiential 145 289 Copyright@STKI_2019 Do not remove source or attribution from any slide, graph or portion of graph 289Cyber/ Security Consulting 290 Copyright@STKI_2019 Do not remove source or attribution from any slide, graph or portion of graph 290Cyber/ Security Consulting Small Boutiques 289 290
- 146. Apr-2019 STKI Company Confiential 146 291 Copyright@STKI_2019 Do not remove source or attribution from any slide, graph or portion of graph 291 Hardware & Software 3rd Party Maintenance 292 Copyright@STKI_2019 Do not remove source or attribution from any slide, graph or portion of graph 292 Third Party Maintenance : Hardware 291 292
- 147. Apr-2019 STKI Company Confiential 147 293 Copyright@STKI_2019 Do not remove source or attribution from any slide, graph or portion of graph 293 Third Party Maintenance : Software Rimini Street Spinnaker Support 294 Copyright@STKI_2019 Do not remove source or attribution from any slide, graph or portion of graph 294 Infrastructure Projects 293 294
- 148. Apr-2019 STKI Company Confiential 148 295 Copyright@STKI_2019 Do not remove source or attribution from any slide, graph or portion of graph 295IMPLEMENTATION OF TOOLS (Consolidation, Virtualization, Monitoring, BSM) IMPLEMENTATION PROJECTS (Storage, other Hardware, Data Center Environment and Networking) 296 Copyright@STKI_2019 Do not remove source or attribution from any slide, graph or portion of graph 296 IMPLEMENTATION OF TOOLS (Consolidation, Virtualization, Monitoring, BSM) IMPLEMENTATION PROJECTS (Storage, other Hardware, Data Center Environment and Networking) Small Boutiques 295 296
- 149. Apr-2019 STKI Company Confiential 149 297 Copyright@STKI_2019 Do not remove source or attribution from any slide, graph or portion of graph 297Maintenance & Implementation for Legacy Systems MVS, OS400, VMS, others 298 Copyright@STKI_2019 Do not remove source or attribution from any slide, graph or portion of graph 298Implementation of Software Tools (Cloud Integration, Middleware, SOA, BPM, ALM, Testing) 297 298
- 150. Apr-2019 STKI Company Confiential 150 299 Copyright@STKI_2019 Do not remove source or attribution from any slide, graph or portion of graph 299Implementation of Software Tools (Cloud Integration, Middleware, SOA, BPM, ALM, Testing) Small Boutiques 300 Copyright@STKI_2019 Do not remove source or attribution from any slide, graph or portion of graph 300 Implementation of DevOps Services 299 300
- 151. Apr-2019 STKI Company Confiential 151 301 Copyright@STKI_2019 Do not remove source or attribution from any slide, graph or portion of graph 301Cyber Security Product Implementation 302 Copyright@STKI_2019 Do not remove source or attribution from any slide, graph or portion of graph 302 Cyber Security Product Implementation Small Boutiques 301 302
- 152. Apr-2019 STKI Company Confiential 152 303 Copyright@STKI_2019 Do not remove source or attribution from any slide, graph or portion of graph 303 Unified Communication (IM, Video, Voice) 304 Copyright@STKI_2019 Do not remove source or attribution from any slide, graph or portion of graph 304 Unified Communication (IM, Video, Voice) Small Boutiques 303 304
- 153. Apr-2019 STKI Company Confiential 153 305 Copyright@STKI_2019 Do not remove source or attribution from any slide, graph or portion of graph 305 PaaS And IaaS Implementation & Maintenance 306 Copyright@STKI_2019 Do not remove source or attribution from any slide, graph or portion of graph 306 PMO Managed Services (with SLA) 305 306
- 154. Apr-2019 STKI Company Confiential 154 307 Copyright@STKI_2019 Do not remove source or attribution from any slide, graph or portion of graph 307Office of the CIO/ PMO Implementations & Services 308 Copyright@STKI_2019 Do not remove source or attribution from any slide, graph or portion of graph 308 ALM Q/A & Testing (only enterprise clients) 307 308
- 155. Apr-2019 STKI Company Confiential 155 309 Copyright@STKI_2019 Do not remove source or attribution from any slide, graph or portion of graph 309 Professional Education, Skill Training, Mentoring, Coaching, Fruition and Implementation הטמעה( ) 310 Copyright@STKI_2019 Do not remove source or attribution from any slide, graph or portion of graph 310 Professional Education , Skill Training, Mentoring and Coaching 309 310
- 156. Apr-2019 STKI Company Confiential 156 311 Copyright@STKI_2019 Do not remove source or attribution from any slide, graph or portion of graph 311Professional Education , Skill Training, Mentoring and Coaching PLUS Online Learning Platforms: Coursera, LinkedIn, Lynda, Udemy, Edx, Skillsoft, Pularsight, etc.. PLUS Online Learning Platforms: Coursera, LinkedIn, Lynda, Udemy, Edx, Skillsoft, Pularsight, etc.. 312 Copyright@STKI_2019 Do not remove source or attribution from any slide, graph or portion of graph 312 Fruition, Implementation (הטמעה) 311 312
- 157. Apr-2019 STKI Company Confiential 157 313 Copyright@STKI_2019 Do not remove source or attribution from any slide, graph or portion of graph 313 Auditing, Governance & Risk Management Projects 314 Copyright@STKI_2019 Do not remove source or attribution from any slide, graph or portion of graph 314Auditing, Governance & Risk Management Implementation & Services 313 314
- 158. Apr-2019 STKI Company Confiential 158 315 Copyright@STKI_2019 Do not remove source or attribution from any slide, graph or portion of graph 315Auditing, Governance & Risk Management Implementation & Services Small Boutiques 316 Copyright@STKI_2019 Do not remove source or attribution from any slide, graph or portion of graph 316 Business Application & Implementation Projects 315 316
- 159. Apr-2019 STKI Company Confiential 159 317 Copyright@STKI_2019 Do not remove source or attribution from any slide, graph or portion of graph 317 ERP Assessments & Implementations 318 Copyright@STKI_2019 Do not remove source or attribution from any slide, graph or portion of graph 318 CRM-XRM Implementations 317 318
- 160. Apr-2019 STKI Company Confiential 160 319 Copyright@STKI_2019 Do not remove source or attribution from any slide, graph or portion of graph 319 Contact Center and Multi-Channel Engagement Projects 320 Copyright@STKI_2019 Do not remove source or attribution from any slide, graph or portion of graph 320 Contact Center and Multi-Channel Engagement Projects Small Boutiques 319 320
- 161. Apr-2019 STKI Company Confiential 161 321 Copyright@STKI_2019 Do not remove source or attribution from any slide, graph or portion of graph 321Web & eCommerce Implementation Projects 322 Copyright@STKI_2019 Do not remove source or attribution from any slide, graph or portion of graph 322Web & eCommerce Implementation Projects Small Boutiques 321 322
- 162. Apr-2019 STKI Company Confiential 162 323 Copyright@STKI_2019 Do not remove source or attribution from any slide, graph or portion of graph 323 HR , Talent Mngt & Payroll Projects 324 Copyright@STKI_2019 Do not remove source or attribution from any slide, graph or portion of graph 324 Information Management Projects 323 324
- 163. Apr-2019 STKI Company Confiential 163 325 Copyright@STKI_2019 Do not remove source or attribution from any slide, graph or portion of graph 325Knowledge Management Projects (ECM, Portals, Collaboration) 326 Copyright@STKI_2019 Do not remove source or attribution from any slide, graph or portion of graph 326Knowledge Management Projects (ECM, Portals, Collaboration) Small Boutiques 325 326
- 164. Apr-2019 STKI Company Confiential 164 327 Copyright@STKI_2019 Do not remove source or attribution from any slide, graph or portion of graph 327 "Digital " Applications Projects 328 Copyright@STKI_2019 Do not remove source or attribution from any slide, graph or portion of graph 328 UX Design Projects 327 328
- 165. Apr-2019 STKI Company Confiential 165 329 Copyright@STKI_2019 Do not remove source or attribution from any slide, graph or portion of graph 329 UX Design Projects Small Boutiques 330 Copyright@STKI_2019 Do not remove source or attribution from any slide, graph or portion of graph 330Data, BI, Analytics (fraud analytics & other special cases) 329 330
- 166. Apr-2019 STKI Company Confiential 166 331 Copyright@STKI_2019 Do not remove source or attribution from any slide, graph or portion of graph 331 Small Boutiques Data, BI, Analytics (fraud analytics & other special cases) 332 Copyright@STKI_2019 Do not remove source or attribution from any slide, graph or portion of graph 332Marketing Automation Implementation Projects 331 332
- 167. Apr-2019 STKI Company Confiential 167 333 Copyright@STKI_2019 Do not remove source or attribution from any slide, graph or portion of graph 333RPA Implementation Projects 334 Copyright@STKI_2019 Do not remove source or attribution from any slide, graph or portion of graph 334Blockchain Implementation Projects 333 334
- 168. Apr-2019 STKI Company Confiential 168 335 Copyright@STKI_2019 Do not remove source or attribution from any slide, graph or portion of graph 335 Development Implementation Projects 336 Copyright@STKI_2019 Do not remove source or attribution from any slide, graph or portion of graph 336General Software Development (Web, Mobile, Legacy) 335 336
- 169. Apr-2019 STKI Company Confiential 169 337 Copyright@STKI_2019 Do not remove source or attribution from any slide, graph or portion of graph 337 Small Boutiques General Software Development (Web, Mobile, Legacy) Aqurate Small Boutiques 338 Copyright@STKI_2019 Do not remove source or attribution from any slide, graph or portion of graph 338New Core Projects (Modernization and/or Package Implementation) 337 338
- 170. Apr-2019 STKI Company Confiential 170 339 Copyright@STKI_2019 Do not remove source or attribution from any slide, graph or portion of graph 339 IoT Implementation Projects 340 Copyright@STKI_2019 Do not remove source or attribution from any slide, graph or portion of graph 340Outsourcing & Managed Services 339 340
- 171. Apr-2019 STKI Company Confiential 171 341 Copyright@STKI_2019 Do not remove source or attribution from any slide, graph or portion of graph 341Complete and/or Application Outsourcing (Client Owns HW) Application Support Outsourcing (SLA Based) 342 Copyright@STKI_2019 Do not remove source or attribution from any slide, graph or portion of graph 342 Infrastructure Types of Outsourcing (infrastructure operations, Storage Mngt, DBA services) 341 342
- 172. Apr-2019 STKI Company Confiential 172 343 Copyright@STKI_2019 Do not remove source or attribution from any slide, graph or portion of graph 343Off-site Data Center includes Operations and DRP (Client owns the HW) 344 Copyright@STKI_2019 Do not remove source or attribution from any slide, graph or portion of graph 344 Help Desk Outsourcing Services 343 344
- 173. Apr-2019 STKI Company Confiential 173 345 Copyright@STKI_2019 Do not remove source or attribution from any slide, graph or portion of graph 345 Cyber Security Managed Services (ie: SIEM Service) 346 Copyright@STKI_2019 Do not remove source or attribution from any slide, graph or portion of graph 346 Cloud Services for Enterprises (only) 345 346
- 174. Apr-2019 STKI Company Confiential 174 347 Copyright@STKI_2019 Do not remove source or attribution from any slide, graph or portion of graph 347 1711 companies/ organizations with IT departments most of them will introduce hybrid cloud solutions SMBs that will make sure that they have all IT as “cloud” solutions most companies with older versions ERP CRM IT that will migrate to “cloud first” solutions organizations that will go to the cloud in next 5 years 348 Copyright@STKI_2019 Do not remove source or attribution from any slide, graph or portion of graph 348Business Services as a Service BSaaS for IT in Enterprises (Salaries, Payments, BPO, etc) 347 348
- 175. Apr-2019 STKI Company Confiential 175 349 Copyright@STKI_2019 Do not remove source or attribution from any slide, graph or portion of graph 349Platform as a Service (PaaS) and Infrastructure as a Service (IaaS) Public & Enterprises only 350 Copyright@STKI_2019 Do not remove source or attribution from any slide, graph or portion of graph 350Disaster Recovery as a Service (DRaaS) 349 350