

Recomendados
Recomendados
Más contenido relacionado
La actualidad más candente
La actualidad más candente (7)
Similar a Consolidated lfa
Similar a Consolidated lfa (20)
Último
Último (20)
Consolidated lfa
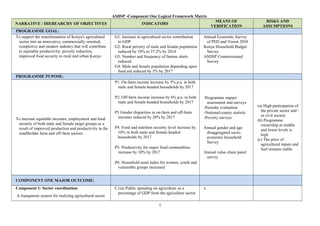
- 1. ASDSP -Component One Logical Framework Matrix NARRATIVE / HIEREARCHY OF OBJECTIVES INDICATORS MEANS OF VERIFICATION RISKS AND ASSUMPTIONS PROGRAMME GOAL: To support the transformation of Kenya's agricultural sector into an innovative, commercially oriented, completive and modern industry that will contribute to equitable productivity, poverty reduction, improved food security in rural and urban Kenya. G1: Increase in agricultural sector contribution to GDP G2: Rural poverty of male and female population reduced by 10% to 37.2% by 2014 G3: Number and frequency of famine alerts reduced G4: Male and female population depending upon food aid reduced by 5% by 2017 Annual Economic Survey of PED and Vision 2030 Kenya Household Budget Survey ASDSP Commissioned Survey PROGRAMME PUPOSE: To increase equitable incomes, employment and food security of both male and female target groups as a result of improved production and productivity in the smallholder farm and off-farm sectors. P1: On-farm income increase by 5% p.a. in both male and female-headed households by 2017 P2: Off-farm income increase by 6% p.a. in both male and female-headed households by 2017 P3 Gender disparities in on-farm and off-farm incomes reduced by 20% by 2017 P4: Food and nutrition security level increase by 10% in both male and female-headed households by 2017 P5: Productivity for major food commodities increase by 10% by 2017 P6: Household asset index for women, youth and vulnerable groups increased Programme impact assessment and surveys -Periodic evaluation -National/county statistic -Poverty surveys Annual gender and age disaggregated socio- economic household Survey Annual value chain panel survey (a) High participation of the private sector and / or civil society (b) Programme ownership at middle and lower levels is high (c) The price of agricultural inputs and fuel remains stable COMPONENT ONE MAJOR OUTCOME: Component 1: Sector coordination A transparent system for realizing agricultural sector C1(a) Public spending on agriculture as a percentage of GDP from the agriculture sector x 1
- 2. NARRATIVE / HIEREARCHY OF OBJECTIVES INDICATORS MEANS OF VERIFICATION RISKS AND ASSUMPTIONS coordination and harmonisation and an enabling institutional environment for the realisation of ASDS developed COMPONENT ONE OUTCOMES: Outcome 1.1.: Sector wide coordination and joint programming improved 1.1.1.1 % increase in funding to ASDS coordination mechanism; 1.1.1.2 % increase in ASDS coordination client satisfaction (functionality and outcomes) 1.1.1.3 Increase in horizontal and vertical outreach of ASDS coordination ASCU annual and other reports Mid-Term and EoP Evaluation Reports (k) Development partners prepared to join and support sector wide institutions (l) Ministries in the sector prepared to cooperate for sector coordination Outcome 1.2.: Sector institutions and capacities strengthened 1.2.1.1 % increase in fulfilment of performance contracts of key sector institutions at all levels1.2.1.2:% increase in fulfilment of ASDSP performance 1.2.1.3 % increase in client/customer satisfaction Capacity Analysis and Needs Assessment Report Capacity Development Plan ASDSP Progress Reports (m) Appreciation of gender and VC approaches among stakeholders (n) Efficient use of capacity-building resources in the sector. Outcome 1.3 .: Linkages between key sector stakeholders (programmes, researchers, educational institutions, extensionists and VC actors) improved 1.3.1.1 % increase in proportion of VC actors satisfied with public and private agricultural services 1.3.1.2. % annual increase in proportion of farmers accessing public and or private agricultural services and infrastructure (by type) 1.3.1.3 % of VC actors showing sustained use of one or more relevant technologies and assets ASDSP Progress Reports and Impact survey Inter-programme cooperation MoUs (o) Actors willing to share their materials and training (p) Clients find technologies useful. (q) Programmes interested in cooperation and learning exchange with TWGs 2
- 3. NARRATIVE / HIEREARCHY OF OBJECTIVES INDICATORS MEANS OF VERIFICATION RISKS AND ASSUMPTIONS (by type) Outcome 1.4.: Gender and vulnerability sensitive sector-wide M&E information systems developed and supported 1.4.1.1 % annual increase in proportion of stakeholders (by type) accessing sector-wide M&E services for various uses, including decision making 1.4.1.2 % of stakeholders showing sustained use of one or more sector-wide M&E services 1.4.1.3 % increase in proportion of stakeholders satisfied with sector-wide M&E services Sector and ASDSP M&E reports ASDSP Progress Report (r) Data collection, analysis and reporting system of M&E/ICT platforms adapted to reflect capacities of input providers (s)The technical content and market information is valuable for a wide range of stakeholders in very different conditions Outcome 1.5: Appropriate sector-wide policies, strategies and regulations developed (VC, NRM/CC/social protection) 1.5.1.1 Sector policies, strategies and regulations in use Policy, strategy and regulatory documents ASDSP progress Reports (t) Policy-makers and Parliament promulgate policies COMPONENT ONE OUTPUTS: To be established by the CCUs Sub-Component 1.1: Sector-wide coordination and joint programming improved 1.1.1.1 ASDS coordination institutions strengthened 1.1.1.2 ASCU supported in soliciting funding for operation of ASDS coordination mechanism 1.1.1.3 ASCU supported in establishing joint sector programming and financing mechanisms 1.1.1.4 ASCU supported in strengthening DP adherence with Code of Conduct 1.1.1.1 Functional operational mandates and procedures exist for NF, ICC, TC, TWG and ASCU 1.1.1.2 % increase in funding allocated to ASDS coordination from GoK and DP sources 1.1.1.3 Joint sector programming and financing mechanism in place 1.1.1.4 No. of DPs funding ASDSP Functional analysis report ASDS-CM operational documents ASCU Annual Reports ASCU agrees to do functional review and “system strengthening” DPs willing to support ASDS-CM and joint programming 3
- 4. NARRATIVE / HIEREARCHY OF OBJECTIVES INDICATORS MEANS OF VERIFICATION RISKS AND ASSUMPTIONS 1.1.1.5 % increase in programmes adhering to CoC Output 1.1.2.1: ASDSP coordinating structures established and operationalised 1.1.2.1 ASDSP steering, coordination and management structures in place and functioning in accordance with sector- wide approach (PSC, CSC, NPS, CCU) 1.1.2.2 Operational procedures and guidelines reflecting ASDSP’s sector-wide approach applied 1.1.2.3 Technical and operational capacity ASDSP Progress Reports ASDSP guidelines and manuals NPS procedural documents TA Agreement Sub-Component 1.2:.Sector institutions and capacities at all levels strengthened Output 1.2.1.1: Capacity of ASDSP coordinating structures strengthened (institutional / organizational / individual) 1.2.1.1 % ASDSP stakeholders expressing satisfaction with programme performance 1.2.2.3 Ratio of posts filled by qualified staff 1.2.1.2 No. of officers trained 1.2.1.3 Ratio of posts filled by qualified staff ASDSP / CCU Progress Reports Capacity Analysis Document Output 1.2.1.2: Capacity of selected sector institutions of relevance to ASDSP mandate strengthened (institutional / organizational / individual) 1.2.2.1 % of institutions’ stakeholders expressing satisfaction with the institutions’ performance 1.2.2.2 No. of officers trained 1.2.2.3 Ratio of posts filled by qualified staff 1.2.2.5 No of institutional capacity plans being implemented ASDSP / CCU Progress Reports CB&D plans Agreements with training providers Capacity survey reports 4
- 5. NARRATIVE / HIEREARCHY OF OBJECTIVES INDICATORS MEANS OF VERIFICATION RISKS AND ASSUMPTIONS (Sub-Component 1.3: Linkages between sector stakeholders improved Output 1.3.1.2: Issue based research – extension partnerships supported Output 1.3.1.3: Appropriate technologies developed 1.3.1.1 No. of functional partnerships 1.3.1.4. No. of technological packages adopted by VC actors ASDSP / CCU Progress reports. R/E mapping and gap analysis report R/E stakeholders interested in strengthening of horizontal and vertical linkages Output 1.3.2.1: Technical collaboration between key sector agencies and programmes established 1.3.2.1 No. of partnerships 1.3.1.2 No. of sector programmes integrating operations 1.3.2.3Functioning of TWGs ASDSP / CCU Progress reports. Sub-Component 1.4: Sector-wide M&E and information management systems developed and supported Output 1.4.1.1: ASCU’s establishment of sector-wide M&E and information systems supported. 1.4.1.1 Functional sector-wide M&E system and agricultural sector knowledge systems in use ASDSP Progress Reports ICT inventory and gap analysis report ASDSP website ASCU and sector stakeholders actively pursue establishment of sector M&E system and NAFIS re-launch Sector M&E system and NAFIS meet sector information demands Output 1.4.2.2: ASDSP M&E and information system established 1.4.2.1 Functional ASDSP M&E system in use ASDSP Progress Reports ASDSP information & M&E system usage data Output 1.4.2.3 Selected sector information management systems strengthened 1.4.2.3 Functional communication mechanisms including interactive ICT platforms to provide 5
- 6. NARRATIVE / HIEREARCHY OF OBJECTIVES INDICATORS MEANS OF VERIFICATION RISKS AND ASSUMPTIONS agricultural information Sub-component 1.5: Appropriate sector-wide policies, strategies and regulations supported Output 1.5.1: Sector-wide policies, strategies and regulations prepared and rolled –out 1.5.1.1 No of polices, strategies and regulations prepared and rolled out 1.5.1.3 No of implementation frameworks established ASDSP Progress Reports ASCU Annual Reports Policy, strategy documents Policies, strategies and regulations passed by competent authorities COMPONENT TWO MAJOR OUTCOME: Component 2: Environmental resilience and social inclusion of promoted value chains strengthened C2 (b) 2.2.1.4 Perceived change in household response capacity to climate-related risks, by gender and vulnerability % of vulnerable groups who states that they are able to engage in VCs ASDSP/CCU Progress Reports NRM / CC adaption / mitigation adoption reports Qualitative and Quantitative Gender Assessment Reports VCD Reports Diversity disaggregated data (gender, economic, age and other social stratification) Qualitative surveys (f) NRM institutions and partners collaborate fully in the NRM / CC awareness building. (g) Technologies suitable for the most vulnerable and the poorest of the poor can be developed and introduced. (h) Community groups and CIG’s can act in concert COMPONENT TWO OUTCOMES: 6
- 7. NARRATIVE / HIEREARCHY OF OBJECTIVES INDICATORS MEANS OF VERIFICATION RISKS AND ASSUMPTIONS Outcome 2.1 Environmental resilience strengthened for value chain actors, including vulnerable groups 2.2.1.3 % increase in VC actors taking appropriate response measures on weather, seasonal forecasting and / or climate scenarios information, disaggregated by gender and vulnerability Outcome 2.2 Basic socio-economic and organizational conditions that enable vulnerable groups to engage in value chain development strengthened C2(a) % change in productive asset ownership, disaggregated by gender and vulnerability % of vulnerable groups who states that existing community organizations enable them to engage in VCs COMPONENT 2 OUTPUTS: To be established by the CCUs Sub-component 2.1: Environmental resilience strengthened for value chain actors, including vulnerable groups Output 2.1.1: Awareness, knowledge and appreciation of NRM and CC causes/risks enhanced among VC stakeholders in general and vulnerable groups in particular 2.1.1.1No. of public and private service providers involved in training VC actors on NRM and CC related risks ASDSP Progress Reports Bi-annual NRM / CC adaption / mitigation adoption report Gender Assessment Reports (s) Mitigation and adoption measures are affordable for small farmers 7
- 8. NARRATIVE / HIEREARCHY OF OBJECTIVES INDICATORS MEANS OF VERIFICATION RISKS AND ASSUMPTIONS 2.1.1.2 No. of VC actors trained on NRM and CC – related risks, by gender and vulnerability 2.1.2: Equitable access to and use of NRM/weather/CC adaptation advisory services and appropriate technologies enhanced, particularly for vulnerable groups 2.2.1.1 No. of VC actors using weather, seasonal forecasting and / or climate scenarios information,, by gender and vulnerability 2.2.2.1No. of VC actors using climate smart technology inputs and /or land management resources, by gender and vulnerability 2.2.1.2 No. of VC actors’ trained early warning agents, by gender and vulnerability ASDSP VC Panel Survey Reports ASDSP / CCU Progress Reports (u) NRM / CC advisory services include information specific to vulnerable groups. 2.1.3: Equitable engagement in local NRM/CC planning 2.2.3.2 No. of VC actors trained in local NRM/CC planning, by gender and vulnerability 2.2.3.2 No of VC actors involved in climate risk management plans development at local level, by gender and vulnerability ASDSP / CCU Progress Reports 8
- 9. NARRATIVE / HIEREARCHY OF OBJECTIVES INDICATORS MEANS OF VERIFICATION RISKS AND ASSUMPTIONS 2.2.3.1 2.2.3.1 No. of NRM/CC related elements in approved plans that can be attributed to advocacy by ASDSP supported VC groups Sub-component 2.2 Basic socio-economic and organizational conditions that enable vulnerable groups to engage in value chain development strengthened Output 2.2.1: Social protection and security enhanced through improved access by vulnerable groups to social protection services 2.3.2.1 No. of VC actors using social protection services, disaggregated by gender and vulnerability 2.3.2.1 No. of service providers providing social protection and security services 2.3.2.1 No. and range of social protection services/products provided ASDSP / CCU Progress Reports Output 2.2.3: Community action capability enhanced through support to establishment and functioning of community groups/links to local CS agents 2.3.3.1 No. of VC actors involved in decision- making at local level , by gender and vulnerability 2.3.3.1 No. of functional producer CIGs linked ASDSP / CCU Progress Reports 9
- 10. NARRATIVE / HIEREARCHY OF OBJECTIVES INDICATORS MEANS OF VERIFICATION RISKS AND ASSUMPTIONS to VCs COMPONENT THREE MAJOR OUTCOME: Component 3: Value chain development Viable and equitable commercialisation of the agricultural sector promoted C3(a): Turnover from traded agricultural commodities increase by 10% by 2017 C3(b) On farm employment increase by 5% p.a. by 2017, disaggregated by gender and vulnerability C3(c) Off farm employment increase by 6% p.a by 2017, disaggregated by gender and vulnerability 3.5.1.2 % increase in number of enterprises engaged in VCs Annual socio-economic household survey Annual value-chain panel surveys (i)Efficient investment through coordination among Development Partners, ministries and other actors (j)Returns in return on investment in the sector increases COMPONENT THREE OUTCOMES: 3.4.1: Inclusive value chain organizations developed 3.4.1.1 % increase in number of actors who are members of VC organizations, by gender and vulnerability 3.4.1.2 Proportion of horizontal VC organizations capable of meeting the production and marketing needs of their members, including vulnerable members ASDSP / CCU Progress Reports 3.2.1: Public and private investment in VC development increased ASDSP Progress Report 10
- 11. 3.2.1 % increase in investments under PPP and by VC actors 3.2.1: Equitable access to market increased 3.2.1.1 % increase in value of agricultural products marketed ASDSP / CCU Progress Reports 3.3.1: Access to affordable financial and insurance services for value chain actors improved (including women, youth and other vulnerable groups) 3.3.1.1 % increase in proportion of VC actors using financial services disaggregated by kind and gender 3.3.1.2 % increase in proportion of persons and enterprises using financial and insurance services of formal banking institutions 3.3.1.3 % increase in lending portfolio to agricultural value chain actors CCU Progress Reports 3.5.1 Innovative and inclusive value chains and VC technologies up-scaled and out-scaled. 3.5.4 No. of VC actors engaging in new VCs and using new VC technologies ASDSP/CCU Progress Reports COMPONENT THREE OUTPUTS: To be established by the CCUs Sub-component 3.1: Inclusive value chain organizations developed Output 3.1.1: Inclusive linkages improved along the VCs (vertical and horizontal) 3.4.1.1 No. and types of VC organizations 3.4.1.1 Number of actors who are members of VC organizations, by gender and vulnerability CCU Progress Reports County VC Reports 11
- 12. 3.4.1.3 Number of VC organizations with functional internal governance system s Output 3.1.2: Value chain organizations’ advocacy and lobbying capacity strengthened 3.4.1.3 No. and types of issues from the VC platforms addressed in local regulations, plans and budgets ASDSP / CCU Progress Reports County VC Reports Output 3.1.4: VC actors’ business management skills enhanced. 1.2.5.2 Proportion of VC actors implementing viable business plans ASDSP Progress reports County VC Reports Sub-component 3.2: Public and private investment in VC development increased Output 3.2.1: PPPs developed 3.2.2 No., type and coverage of infrastructure projects established under PPP Output 3.2.2: VC actors’ investment increased 3.2.2 No., type and coverage of infrastructure projects by VC actors Sub-component 3.3: Equitable access to market increased Output 3.3.1: Access to market information improved 3.2.1.2 Proportion of VC actors accessing market information, by gender and vulnerability 3.2.1.4 Proportion of VC actors participating in contracting production and out-grower schemes 12
- 13. Output 3.3.2 Technical capacity for value addition and post harvest management improved 3.2.3 No. of VC actors undertaking value addition initiatives, by gender and vulnerability 3.2.4 No. of VC actors using improved post harvest management practices, by gender and vulnerability Sub-component 3.4: Access to affordable financial and insurance services for value chain actors improved Output 3.4.1: Availability of socially inclusive financial services strengthened 3.3.1.1 Number of VC actors aware of financial services, by gender and vulnerability 3.3.1.2 Number of financial service providers and type of products CCU / County VC report Credit Institution Reports CCU Progress Reports Output 3.4.2: Availability of agricultural insurance services strengthened 3.3.2.1 Number of VC actors using insurance services 3.3.1.2 Number of agricultural insurance service providers and type of products CCU Progress Reports County VC report Sub-component 3.5: Innovative and inclusive value chains and VC technologies up-scaled and out- scaled. Output 3.5.1: Capacity of VC actors to identify promising VCs and VC technologies strengthened 3.5.1 No. of promising VCs and VC technologies identified ASDSP Progress Reports 13
- 14. Output 3. 5.2 : Support mechanism for assisting up- scaling and out-scaling established 3.5.2 No. of VCs and VC technologies piloted 3.5.3 No. and type of VCs and VC technologies used 14