SlideShare una empresa de Scribd logo
1 de 20
Descargar para leer sin conexión
A MESSAGE TO THE NEXT PRESIDENT
EXPERIENCE ALL THAT THE NATIONAL URBAN LEAGUE’S
STATE OF BLACK AMERICA®
HAS TO OFFER!
In addition to the key findings and insights highlighted in this executive summary, the State of Black
America offers a multi-media and social experience that will encourage more interaction, deeper
learning, and year-round updates and contributions.
Celebrating 40 years of the
State of Black America®
– now an all-digital experience!
THE SUITE OF STATE OF BLACK AMERICA OFFERINGS FOR 2016 INCLUDES:
Complete Website
A digital hub where visitors can access all-things State of Black America – including full data sets
and analysis for the 2016 National Equality Index™; full 70-city list of Black-White and Hispanic-White
Metropolitan Area Equality Index rankings for unemployment and income; 40-Year Retrospective
Equality Index; full articles from the 2016 State of Black America contributors; additional data and
report findings; press materials; infographics and charts; and year-round updates with new contributors
addressing issues impacting the state of Black America in real-time;
www.stateofblackamerica.org.
Web Series
Five-part series that gathers the nation’s leaders, political pundits, and executives for a lively discussion
around the 2016 State of Black America theme, “Locked Out: Education, Jobs and Justice,” the State of
Black America Equality Index topics and content highlighted in the report. View it at
www.stateofblackamerica.org and on our partner sites - Interactive One and NBCBLK.
Tell us what you think, and follow the State of Black America
conversation on Twitter – #LockedOut
4	About the State
of Black America¨
5	From the
President’s Desk
Marc H. Morial
7	Overview of 2016
National Urban League
Equality Index™
8	Overview of 2016
Metropolitan
Unemployment
Equality Index
10	Overview of 2016
Metropolitan
Income Equality Index
12	State of Black America
1976-2016: A 40-Year
Retrospective
16	2016 State of Black
America Contributors
 Article Excerpts
19	About the National
Urban League
NATIONAL URBAN LEAGUE
2016 STATE OF BLACK AMERICA©
LOCKED OUT
The State of Black America®, the National Urban League’s
seminal annual publication now in its 40th edition, has
become one of the most highly-anticipated benchmarks
and sources for thought leadership around racial equality
in America across economics, employment, education,
health, housing, criminal justice and civic participation.
Each edition of the State of Black America contains
thoughtful commentary and insightful analysis from
leading figures and thought leaders in politics, the
corporate arena, NGOs, academia and popular culture.
The State of Black America also includes the Equality
Index, a quantitative tool for tracking racial equality in
America, now in its 12th edition of the Black-White Index
and its seventh edition of the Hispanic-White Index.
The 2016 report features the third edition of the metro
Equality Index, ranking approximately 70 metro areas
based on unemployment and income equality for Blacks
and Hispanics. Included in the 2016 Equality Index is
a special 40-year retrospective to commemorate the
publication of the National Urban League’s first State of
Black America report in 1976 and compare key Black-
White Equality Index numbers over time.
The complete 2016 State of Black America report,
including full data sets, ranking lists and articles, is
available at www.stateofblackamerica.org.
FIGURE 1
2016 Black–White Equality Index is 72.2%
72.2% BLACK
100% WHITE
30%
10%
10%
25%
FIGURE 2
Different Categories that Make Up the Equality Index
Economics 30% Health 25% Education 25%
Social Justice 10% Civic Engagement 10%
25%
The complete 2016 State of Black America report, including full data sets, ranking lists and articles
is available at www.stateofblackamerica.org.
About the State
of Black America
4
WHY DO WE PUBLISH AN EQUALITY INDEX?
Economic empowerment is the central theme of the National Urban League’s
mission. The Equality Index gives us a way to document progress towards
this mission.
THE 2016 EQUALITY INDEX OF BLACK AMERICA IS 72.2%.
WHAT DOES THAT MEAN?
That means that rather than having a whole pie (100%), which would mean
full equality with whites in 2016, African Americans are missing about 28%
of the pie (Figure 1). Similarly, a Hispanic Index of 77.8% indicates that more
than 20% of the pie is missing for Hispanics.
WHAT IS THE EQUALITY INDEX TRYING TO DO?
Imagine if we were to summarize how well African Americans and Hispanics
are doing compared to whites in the areas of economics, health, education,
social justice and civic engagement, and represent that by a pie. The
Equality Index measures the share of the pie that African Americans and
Hispanics get. Whites are used as the benchmark because the history of
race in America has created advantages for whites that continue to persist
in many of the outcomes being measured. Each category is weighted,
based on the importance that we give to each (Figure 2).
IS IT POSSIBLE TO SEE HOW WELL AFRICAN AMERICANS AND
LATINOS ARE DOING IN EACH OF THE CATEGORIES?
Yes. We show this in the tables included with the Equality Index. Each
category can be represented by a mini-pie and interpreted in the same
way as the total Equality Index. So, the index of 56.2% for the economics
category for African Americans in 2016 means that African Americans are
missing close to half of the economics mini-pie.
IT DOESN’T APPEAR THERE’S BEEN MUCH IMPROVEMENT IN THE
EQUALITY INDEX—WHAT’S THE POINT?
The Equality Index is composed of many parts, so improvements in one area
are sometimes offset by losses in another area, leaving the overall index
unchanged. The Equality Index offers solid evidence of how slowly change
happens, and highlights the need for policies that fight inequality.
As we observe the 40th anniversary of the State of Black America®, the similarities in the nation in 2016 and that
which then-National Urban League Executive Director Vernon Jordan documented in 1976 are disheartening.
OurnationwasstrugglingtoovercometheworsteconomicdownturnsincetheGreatDepression.Pressurewas
buildingtoslashsocialservicesforthepoor,whoweredemonizedandcharacterizedas“chislers.”Communities
were rocked by hostility and violence triggered by legal challenges to the social status quo.
As with every economic downturn, communities of color bore the brunt of the decline. Black Americans
remained nearly twice as likely as whites to be unemployed. Since 1976, the Black unemployment rate has
consistentlyremainedabouttwicethatofthewhiterateacrosstime,regardlessofeducationalattainment.The
household income gap remains at about 60 cents for every dollar. Black Americans are only slightly less likely
today to live in poverty than they were in 1976.
Onthecriminaljusticefront,JordannotedthatBlackswereunderrepresentedinlawenforcementin1976.“The
City of Chicago is an example: with a population that is 32.7 percent black, it has a police force that is only 16
percent black.” Today, in hundreds of police departments across the nation, the percentage of whites on the
force is more than 30 percentage points higher than in the communities they serve.
“The urgency of the problems that grip the American people allow no time for delay or for half-way
measures,” Jordan observed.
There have been times when Americans have met our shared challenges – as well as those of the international
community – with full-measured urgency. When Europe found itself in physical and economic ruin after World
WarII,theUnitedStatesinvested$13billion(orwhatwouldbeapproximately$130billiontoday)tohelprebuild
Western European economies through the European Recovery Program, more commonly known as the
Marshall Plan. The Marshall Plan ushered a dramatic increase in economic growth in European history. Though
theplanofficiallyendedin1953,theunprecedentedeconomicgrowthitsparkedcontinuedovertwodecades.
Former National Urban League President John Jacob introduced the concept of an urban Marshall Plan for
America in the 15th State of Black America® in 1990. At the time, he said the nation should commit itself to
completing “our unfinished revolution for democracy and human rights.”
Dear Mr./Madame President, that revolution remains unfinished.
BOOK EXCERPT
NATIONAL URBAN LEAGUE
5
6
Read Marc’s full article in the 2016 State of Black America
online at www.stateofblackamerica.org.
Since 2006, the United States has spent nearly $50 billion rebuilding Afghanistan through the Afghanistan Infrastructure Rehabilitation
Program. The Troubled Asset Relief Program (TARP), signed into law by President George W. Bush in 2008, infused the nation’s faltering
financial institutions with investments of more than $400 billion. Whether we call it “recovery,” “rehabilitation” or “relief,” it is time for
America to demonstratethatverysamecommitmenttoourownstrugglingurbanfamiliesandcommunities.Thenecessityisaspowerful
and compelling as it was for Europe, Afghanistan or Wall Street.
That is why, with this milestone 40th Anniversary State of Black America®, the National Urban League proposes a sweeping and decisive
solution to the nation’s persistent social and economic disparities. We call it the Main Street Marshall Plan: Moving from Poverty to
Prosperity.
This bold and strategic investment in America’s urban communities requires a multi-annual and multi-pronged commitment of $1 trillion
over the next 5 years that would course correct our main streets. Our nation needs investments in:
•	 Universal early childhood education
•	 A federal living wage of $15 per hour, indexed to inflation
•	 A plan to fund comprehensive urban infrastructure
•	 A new Main Street small- and micro-business financing plan focusing on minority-and-women-owned
businesses
•	 Expansion of summer youth employment programs
•	 Expanded homeownership strategies
•	 Expansion of the Earned Income Tax Credit (EITC)
•	 Targeted re-entry workforce training programs administered through community-based organizations
•	 Doubling the Pell Grant program to make college more affordable
•	 Expansion of financial literacy and homebuyer education and counseling
•	 Expansion of the low-income housing voucher “Section 8” program
•	 Establishment of Green Empowerment Zones in neighborhoods with high unemployment
•	 Affordable high-speed broadband and technology for all
•	 Increased federal funding to local school districts to help eliminate resource equity gaps
As America’s urban communities continue to struggle in the slow rebound from the Great Recession, we can expedite the recovery by
taking a lesson from the pages of our history books and similarly focusing our efforts with great vision and purpose-filled ambition. Our
economy and infrastructure have been shattered, not by bombs and tanks, but by malfeasance and indifference.
Under President Obama, the nation has made great strides in stabilizing the economy. In eight years, America has gone from losing
hundreds of thousands of jobs per month to 73 consecutive months of job growth. During President Obama’s term, the private sector
has added 14.4 million new jobs, and the Economic Recovery and Reinvestment Act is widely credited with protecting the nation from a
second Great Depression.
However, much more remains to be done. The benefits of the recovery have not reached the Main Streets of our most troubled
communities.Wecannotcontinuetorelyonpoliciesthathaveprovenineffectiveincommunitieswithhighunemploymentandlow
income. You see, we are not asking for a new deal; we are demanding a better deal. As a nation, we must focus our resources and
efforts on the neighborhoods where they are most needed.
Vernon Jordan realized in 1976 that it was incumbent upon the National Urban League to confront the problems that Washington
refused to acknowledge. Forty years later, we continue on that path to progress – with a clear purpose and an even clearer plan.
2016 STATE OF BLACK AMERICA©
LOCKED OUT
7
NATIONAL URBAN LEAGUE
Overview of 2016 National Urban League Equality Index™
As President Obama wraps up the final months of his second term as the nation’s first African-American president, many will begin to assess
the progress the nation has made under his administration, and more specifically, the progress that Black America has made. In making these
critical assessments, we must also consider which presidential candidate is best suited to meet the challenges and seize the opportunities
that lie ahead for the United States. How well has the nation recovered from the worst economic crisis it has seen in generations? How much
closer to the goal of universal healthcare coverage has the Affordable Care Act – or Obamacare – gotten us? Have racial justice and overall
race relations worsened or improved over the last eight years? Will the next policy era be one that reduces or exacerbates decades of growing
income and wealth inequality? The 2016 National Urban League Equality Index tells an all too familiar story of persistent racial disparities in
American life, making clear that the historic Obama presidency has not been a panacea for America’s long-standing race problem.
BLACK–WHITE
The 2016 Equality Index of Black America stands at 72.2 percent compared to
a revised 2015 index of 72.0 percent. Revisions to the previous year’s index
are done for greater comparability across years and reflect data points that
have been corrected, removed from the current year’s index or re-weighted
so that less emphasis is placed on older data. The largest increase in this
year’s index was in the area of education (from 76.1% to 77.4%), with smaller
increases in economics (from 55.5% to 56.2%) and social justice (60.6% to
60.8%). The civic engagement index declined sharply over the last year (from
104.0% to 100.6%) while the health index (from 79.6% to 79.4%) declined
slightly.
The increase in the education index was the result of improvements in
college attainment and enrollment. The increase in the economics index
came primarily through progress in closing the digital divide as well as lower
denial rates for African Americans seeking mortgage and home improvement
loans. The unemployment and homeownership gaps remained unchanged
from the previous year. The improvements in the social justice index resulted
from a decline in the Black incarceration rate, while the percent of whites
placed in prison following an arrest grew by more than the rate for Blacks.
The large drop in the civic engagement index resulted from the typical
declines in voter registration and participation that are characteristic of mid-
term election years.
HISPANIC–WHITE
The 2016 Equality Index of Hispanic America stands at 77.8 percent compared
to a revised 2015 index of 77.3 percent. The increase in the Hispanic-White
Index resulted from a major improvement in the social justice index (from
66.6% to 75.9%) and smaller gain in the economics index (from 60.8% to
61.8%) that helped to offset losses in all other categories. The greatest losses
were in civic engagement (from 71.0% to 67.6%), followed by health (from
106.8% to 105.5%), and education (from 74.6% to 74.2%).
The large increase in the social justice index was the result of improvements
on nearly every measure of social justice used to calculate the Equality Index.
Similar to the trends in the Equality Index of Black America, the increase in
the economics index came from a smaller digital divide and fewer mortgage
and home improvement loan denials.
The increase in the health index was a result of lower death rates among
Hispanics and increased health care coverage since the Affordable Care Act
went into effect.
On the other hand, Hispanic voter registration and participation dropped
sharply during the mid-term elections in 2014 (latest data available), resulting
in a decline in the civic engagement index. While the Hispanic-White health
index remains above 100 percent and rates of uninsurance are falling among
all groups, declining index values reflect faster health insurance take-up rates
among whites than Latinos.
REVISED 2015 2016
EQUALITY INDEX 72.0% 72.2%
Economics 55.5% 56.2%
Health 79.6% 79.4%
Education 76.1% 77.4%
Social Justice 60.6% 60.8%
Civic Engagement 104.0% 100.6%
EQUALITY INDEX OF BLACK AMERICA, 2015–2016
■ Revised 2015
■ 2016
120%
100%
80%
60%
40%
20%
0%
Total
Econom
ics
Health
EducationSocialJustice
CivicEngagem
ent
REVISED 2015 2016
EQUALITY INDEX 77.3% 77.8%
Economics 60.8% 61.8%
Health 106.8% 105.5%
Education 74.6% 74.2%
Social Justice 66.6% 75.9%
Civic Engagement 71.0% 67.6%
EQUALITY INDEX OF HISPANIC AMERICA, 2015–2016
■ Revised 2015
■ 2016
120%
100%
80%
60%
40%
20%
0%
Total
Econom
ics
Health
EducationSocialJustice
CivicEngagem
ent
8
2015 STATE OF BLACK AMERICA¨
LOCKED OUT
Two years ago, the National Urban League introduced
rankings of unemployment and income equality
between whites, Blacks and Latinos in the nation’s largest
metropolitan areas. Comparison of the 2015 and 2016 Metro
Unemployment Equality Index ranking reveals that there was
significant shuffling of metros at the top of the list. In both
the Black-White and Hispanic-White rankings, only three of
the cities in last year’s top 10 were also in this year’s top 10.
On the other hand, many of the metros at the bottom of last
year’s rankings remained at the bottom of this year’s rankings
as well.
These patterns seem to represent differences in the pace of
recovery across the country as metros at the top of the list
averaged larger improvements in unemployment rates than
those at the bottom of the list, especially among Blacks and
Latinos.
The tables herein highlight major cities, as well as the most
and least equal metropolitan areas and those with highest and
lowest unemployment.
The full list of Black-White and Hispanic-White 2016 Metro
Unemployment Equality Index rankings, complete with a
comparison to 2015, can be found in additional tables on
www.stateofblackamerica.org.
BLACK–WHITE UNEMPLOYMENT EQUALITY
With an index of 68.7 percent, the Providence-Warwick, RI-MA metro area
once again tops the list as the metro area with the smallest Black-White
unemployment gap. The Black unemployment rate in Providence was 9.9
percent (down 3.1 percentage points) and the white rate was 6.8 percent
(down 1.7 percentage points). With an index of 67 percent, this year’s
second most equal metro area, Chattanooga, TN-GA, is up from #51 last year,
reflecting a decline of more than six percentage points in the area’s Black
unemployment rate, while the white rate was virtually unchanged.
Similar to the 2015 rankings, the 2016 rankings reveal that metros with the
greatest unemployment equality are not necessarily the metros with the
best employment outcomes for either group. The metros with the lowest
unemployment rate for Blacks (8.3%) were San Antonio-New Braunfels,
TX and Oklahoma City, OK, #6 in the equality ranking. The metro with the
lowest white unemployment rate (3.7%) was Jackson, MS, #65 in the equality
ranking. The metro with the highest Black unemployment rate (20%) was
Cleveland-Elyria, OH, #69 in the equality ranking. Riverside-San Bernardino-
Ontario, CA registered the highest white unemployment rate (9.7%) and
came in at #5 in the equality ranking.
HISPANIC–WHITE UNEMPLOYMENT EQUALITY
With an index of 103.6 percent, Indianapolis-Carmel-Anderson, IN topped the
Hispanic-White metro unemployment rankings this year. Indianapolis was
#2 last year behind Deltona-Daytona Beach-Ormond Beach, FL, which fell to
#49 this year. While there were a total of five metros in the 2015 Index with
a Hispanic-White unemployment index greater than 100 -- indicating that
the Hispanic unemployment rate was lower than the white unemployment –
Indianapolis was the only metro with that distinction in this year’s index.
Since unemployment disparities between Latinos and whites have narrowed
more than those between Blacks and whites during the recovery, lower
unemployment rates and greater unemployment equality seemed to be
more closely linked. The metro with the lowest Hispanic unemployment rate
(4.6%) was Tulsa, OK, #4 in the ranking. The metro with the highest Hispanic
unemployment rate (21.5%) was Springfield, MA at #72 in the ranking.
NOTES
1
 The unemployment and income data used for the Metro Index rankings comes from
the American Community Survey (ACS). The 2016 Metro Index is based on data from
the 2014 ACS (most recent) and the 2015 Metro Index is based on data from 2013 ACS.
2016 Metropolitan Unemployment Equality Index™
9
NATIONAL URBAN LEAGUE
Providence–Warwick, RI–MA 1 9.9 6.8 68.7% 1 13 8.5 65%
San Antonio-New Braunfels, TX 6 8.3 4.9 59.0% 49 11.1 4.5 41%
Oklahoma City, OK 7 8.3 4.9 59.0% 30 9.9 4.6 46%
Dallas-Fort Worth-Arlington, TX 20 10 4.9 49.0% 34 11.7 5.4 46%
Virginia Beach-Norfolk-Newport News, VA-NC 21 11.3 5.5 48.7% 48 12.7 5.3 42%
New York-Newark-Jersey City, NY-NJ-PA 24 12 5.7 47.5% 24 14.2 6.7 47%
Miami-Fort Lauderdale-West Palm Beach, FL 25 13.5 6.4 47.4% 27 16 7.5 47%
Los Angeles-Long Beach-Anaheim, CA 26 14.4 6.8 47.2% 33 17.3 8 46%
Houston-The Woodlands-Sugar Land, TX 29 9.3 4.3 46.2% 52 12.6 5 40%
Boston-Cambridge-Newton, MA-NH 32 11.4 5.2 45.6% 32 13.4 6.2 46%
Charlotte-Concord-Gastonia, NC-SC 33 14.7 6.7 45.6% 43 16.5 7.1 43%
Atlanta-Sandy Springs-Roswell, GA 36 12.4 5.5 44.4% 36 14.8 6.8 46%
Philadelphia-Camden-Wilmington, PA-NJ-DE-MD 46 14.9 5.9 39.6% 28 16 7.5 47%
Washington-Arlington-Alexandria, DC-VA-MD-WV 47 10.9 4.3 39.4% 54 11.5 4.5 39%
St. Louis, MO-IL 50 14.5 5.6 38.6% 59 17.2 6.1 35%
New Orleans-Metairie, LA 54 12.6 4.8 38.1% 26 13 6.1 47%
Baltimore-Columbia-Towson, MD 55 12.4 4.5 36.3% 42 11.9 5.4 45%
Detroit-Warren-Dearborn, MI 59 17.9 6.4 35.8% 55 20.3 7.6 37%
Chicago-Naperville-Elgin, IL-IN-WI 65 18.6 5.8 31.2% 65 21.4 6.8 32%
Cleveland-Elyria, OH 69 20 5.4 27.0% 68 20.4 6 29%
Milwaukee-Waukesha-West Allis, WI 70 17.3 4.3 24.9% 69 17.6 5.1 29%
SELECT METROS FROM 2016 2016 Rank Black Rate* White Rate* Black–WhiteIndex 2015 Rank Black White Index
SELECT METROS FROM 2016 2016 Rank Hispanic Rate* White Rate* Hispanic–WhiteIndex 2015 Rank Hispanic White Index
2016 METRO AREAS UNEMPLOYMENT EQUALITY
Black–White
Hispanic–White
Indianapolis-Carmel-Anderson, IN 1 5.5 5.7 103.6% 2 5.3 6.7 126%
Tulsa, OK 4 4.6 4.3 93.5% 46 8.1 5.3 65%
Miami-Fort Lauderdale-West Palm Beach, FL 6 7.1 6.4 90.1% 20 9.4 7.5 80%
El Paso, TX 9 8.1 7 86.4% 8 8.7 8.2 94%
Dallas-Fort Worth-Arlington, TX 16 6 4.9 81.7% 24 7 5.4 77%
Phoenix-Mesa-Scottsdale, AZ 18 7.5 6.1 81.3% 41 9.4 6.4 68%
Riverside-San Bernardino-Ontario, CA 20 12.2 9.7 79.5% 18 13.5 10.8 80%
Los Angeles-Long Beach-Anaheim, CA 24 8.9 6.8 76.4% 26 10.7 8 75%
Houston-The Woodlands-Sugar Land, TX 26 5.7 4.3 75.4% 28 6.8 5 74%
San Francisco-Oakland-Hayward, CA 32 7 5.1 72.9% 38 9 6.2 69%
San Jose-Sunnyvale-Santa Clara, CA 33 8.1 5.9 72.8% 64 11.3 6 53%
San Antonio-New Braunfels, TX 37 7.1 4.9 69.0% 61 7.9 4.5 57%
Washington-Arlington-Alexandria,
DC-VA-MD-WV
39 6.3 4.3 68.3% 44 6.8 4.5 66%
New York-Newark-Jersey City, NY-NJ-PA 41 8.4 5.7 67.9% 51 10.8 6.7 62%
Chicago-Naperville-Elgin, IL-IN-WI 42 8.6 5.8 67.4% 49 10.6 6.8 64%
Denver-Aurora-Lakewood, CO 44 5.9 3.9 66.1% 53 9.1 5.6 62%
San Diego-Carlsbad, CA 48 9.8 6.1 62.2% 22 10 7.9 79%
Albuquerque, NM 51 10.5 6.4 61.0% 48 9.3 6 65%
Philadelphia-Camden-Wilmington, PA-NJ-DE-MD 65 12.1 5.9 48.8% 56 12.4 7.5 60%
Springfield, MA 72 21.5 6.3 29.3% 70 17.7 7.4 42%
* 2013 Unemployment Rate
10
2015 STATE OF BLACK AMERICA¨
LOCKED OUT
Unlike the Black-White unemployment equality rankings, the
Black-White Income Equality Index rankings were relatively
stable between 2015 and 2016. Six of last year’s top 10 metros
were again in the top 10 this year. In the Hispanic-White
rankings, seven of last year’s top 10 appear at the top of this
year’s list.
The tables herein highlight major cities, as well as the most
and least equal metropolitan areas and those with highest and
lowest median household income.
The full list of Black-White and Hispanic-White 2016
Metro Income Equality Index rankings, complete with a
comparison to 2015, can be found in additional tables on
www.stateofblackamerica.org.
BLACK–WHITE INCOME EQUALITY
Riverside-San Bernardino-Ontario, CA remained at the top of the Black-White
Income Equality ranking this year, with the median Black household having
76 cents for every dollar of median white household income. In Riverside,
Black household income rose 6.8 percent year-over-year while whites
saw a decline of 1.1 percent. Black and white incomes were least equal in
Minneapolis-St. Paul-Bloomington, MN-WI where the gap was 38 cents on
the dollar. Minneapolis replaces San Francisco-Oakland-Hayward, CA as the
metro where Black and white incomes were least equal. In Minneapolis, the
median household income for Blacks was $28,138 (down 12.7% from last
year’s Index) compared to $74,455 for whites (up 1.7% from last year’s Index).
The highest median household income for both Blacks ($66,151) and whites
($109,460) was in Washington-Arlington-Alexandria, DC-VA-MD-WV, #18 in
the ranking. The lowest median Black household income ($22,386) was in
Toledo, OH (#64 in the ranking). Even though Toledo had one of the lowest
median white household incomes in the country, white household income in
Toledo was still more than double Black household income. Toledo, OH also
had the fourth highest Black unemployment rate, which would at least partly
account for the low income of Black households. The lowest median white
household income for whites ($47,208) was in Lakeland-Winter Haven, FL.
HISPANIC–WHITE INCOME EQUALITY
For Latinos, median household incomes were closest to those of whites in
Urban Honolulu, HI which was up from #7 in last year’s ranking as a result of
three percent income growth for Latinos and 1.3 percent growth for whites.
In Urban Honolulu, the median Hispanic household had 80 cents for every
dollar of median white household income. Hispanic and white incomes were
least equal in Springfield, MA where the gap was 40 cents on the dollar. In
Springfield, the median household income for Latinos was $23,911 (down
5.1% from the 2015 index), compared to $60,105 for whites (down 2.3%).
As was the case for Blacks and whites, the highest median Hispanic
household income was in Washington-Arlington-Alexandria, DC-VA-MD-
WV ($66,523), #50 in the equality ranking. The lowest median Hispanic
household income was in Springfield, MA ($23,911), #72 in the equality
ranking.
2016 Metropolitan Income Equality Index™
11
NATIONAL URBAN LEAGUE
Riverside-San Bernardino-Ontario, CA 1 46,438 60,668 76.5% 1 43,482 61,364 71%
Atlanta-Sandy Springs-Roswell, GA 15 42,954 69,485 61.8% 17 42,557 69,718 61%
Miami-Fort Lauderdale-West Palm Beach, FL 17 36,840 60,785 60.6% 10 37,473 59,632 63%
Washington-Arlington-Alexandria, DC-VA-
MD-WV
18 66,151 109,460 60.4% 21 65,721 110,026 60%
Charlotte-Concord-Gastonia, NC-SC 19 37,559 62,485 60.1% 11 37,230 59,497 63%
Virginia Beach-Norfolk-Newport News, VA-NC 26 40,230 69,288 58.1% 13 41,231 66,547 62%
Baltimore-Columbia-Towson, MD 30 47,540 83,200 57.1% 22 48,650 81,892 59%
Dallas-Fort Worth-Arlington, TX 32 40,859 73,595 55.5% 35 40,917 72,584 56%
Houston-The Woodlands-Sugar Land, TX 37 43,362 80,351 54.0% 44 41,334 78,032 53%
Boston-Cambridge-Newton, MA-NH 38 44,408 82,903 53.6% 19 49,117 81,005 61%
New York-Newark-Jersey City, NY-NJ-PA 40 45,493 85,819 53.0% 45 44,879 84,823 53%
Los Angeles-Long Beach-Anaheim, CA 47 40,883 78,973 51.8% 43 41,534 78,396 53%
Detroit-Warren-Dearborn, MI 53 30,946 61,205 50.6% 55 30,646 61,062 50%
Philadelphia-Camden-Wilmington, PA-NJ-DE-MD 57 36,496 74,615 48.9% 50 37,404 73,093 51%
New Orleans-Metairie, LA 58 30,088 61,729 48.7% 61 28,350 61,053 46%
Chicago-Naperville-Elgin, IL-IN-WI 62 35,169 74,759 47.0% 58 34,882 73,087 48%
Toledo, OH 64 22,386 50,792 44.1% 67 22,054 50,141 44%
Cleveland-Elyria, OH 67 25,439 58,394 43.6% 60 27,063 58,043 47%
St. Louis, MO-IL 52 31,751 62,622 50.7% 52 31,725 62,257 51%
Minneapolis-St. Paul-Bloomington, MN-WI 70 28,138 74,455 37.8% 66 32,232 73,193 44%
Urban Honolulu, HI 1 63,815 79,299 80.5% 7 61,960 78,299 79%
Riverside-San Bernardino-Ontario, CA 2 48,790 60,668 80.4% 8 47,969 61,364 78%
Albuquerque, NM 12 41,363 54,917 75.3% 18 40,578 57,408 71%
Miami-Fort Lauderdale-West Palm Beach, FL 21 42,814 60,785 70.4% 17 42,227 59,632 71%
New Orleans-Metairie, LA 26 42,366 61,729 68.6% 11 46,901 61,053 77%
Phoenix-Mesa-Scottsdale, AZ 29 40,454 60,233 67.2% 33 39,338 59,550 66%
El Paso, TX 35 36,197 55,669 65.0% 22 36,179 52,443 69%
Chicago-Naperville-Elgin, IL-IN-WI 37 48,178 74,759 64.4% 43 46,091 73,087 63%
San Antonio-New Braunfels, TX 40 42,994 67,352 63.8% 38 43,071 66,506 65%
San Diego-Carlsbad, CA 41 47,802 75,368 63.4% 29 47,642 71,453 67%
Denver-Aurora-Lakewood, CO 43 47,124 74,882 62.9% 48 42,760 71,749 60%
San Jose-Sunnyvale-Santa Clara, CA 46 64,198 104,398 61.5% 52 60,118 101,923 59%
San Francisco-Oakland-Hayward, CA 47 61,290 100,172 61.2% 51 57,190 96,845 59%
Washington-Arlington-Alexandria, DC-VA-
MD-WV
50 66,523 109,460 60.8% 47 66,812 110,026 61%
Los Angeles-Long Beach-Anaheim, CA 53 46,782 78,973 59.2% 53 45,942 78,396 59%
Dallas-Fort Worth-Arlington, TX 55 43,409 73,595 59.0% 54 42,303 72,584 58%
Houston-The Woodlands-Sugar Land, TX 60 44,491 80,351 55.4% 58 43,724 78,032 56%
Philadelphia-Camden-Wilmington, PA-NJ-DE-MD 63 39,175 74,615 52.5% 62 36,960 73,093 51%
New York-Newark-Jersey City, NY-NJ-PA 65 43,455 85,819 50.6% 61 43,685 84,823 52%
Springfield, MA 72 23,911 60,105 39.8% 71 25,187 61,495 41%
SELECT METROS FROM 2016 2016 Rank Black Income, Dollars* White Income, Dollars* Black–WhiteIndex 2015 Rank Black White Index
Hispanic–White
2016 METRO AREAS INCOME EQUALITY
Black–White * Median Household Income, 2014 Dollars
SELECT METROS FROM 2016 2016 Rank Hispanic Income, Dollars* White Income, Dollars* Hispanic–WhiteIndex 2015 Rank Hispanic White Index
12
2016 STATE OF BLACK AMERICA©
LOCKED OUT
13
NATIONAL URBAN LEAGUE
Forty years ago – on February 2, 1976 – The New York Times wrote an article titled
“Distress Signal,” which reported on the first edition of the National Urban League’s State
of Black America® report, noting:
	 “The report on the state of black America released last week by the National
Urban League is a profoundly depressing document. Beyond the statistics it
contains – gloomy enough by themselves – the report dramatizes a substantial
failure of political leadership.
Vernon Jordan, Jr., the league’s executive director, noted that the State of the
Union Message by President Ford omitted all mention of the plight of black
Americans while Senator Edmund S. Muskie in his reply on behalf of the
Democrats, omitted the promise of racial equality from his list of endangered
American promises.
The report is replete with facts backing up the league’s conclusion that no
recent year ‘has been more destructive to the progress of blacks than 1975.’
…the message is clear. In aspects of life that can be measured statistically,
the gains made in the sixties by America’s largest minority group have been
decimated. And in intangible terms – those relating to the demands for
equality urged on the nation’s conscience by its leaders – all gears have been
thrown into reverse.
Inadditiontothemoralfailuresthisreportunderscores–whichbythemselves
are highly significant – it dramatizes unwholesome and even frightening
social policy trends. Such severe distress in any single segment of society is
bound to have large consequences throughout all of American life. Nothing
demonstrates this quite so well as the current precarious financial plight of so
many of the nation’s cities.
In the end, then, the conditions described by the Urban League constitute
a substantial challenge to the country’s political leadership, not simply to
redeem a central aspect of American idealism, but to reverse a dangerous
disintegration in the social fabric of the entire nation.”
This year, as the National Urban League celebrates the 40th anniversary of the State of
BlackAmericareport,itcontinuestointerjectseriousconsiderationofthesocial,economic
and political issues facing African Americans into the national discourse. While aggregate
improvements can be noted across the board for Blacks and whites, unfortunately the
findings tell a clear story that significant disparities remain and have not been resolved by
any gains, particularly in income and employment.
40 Years: The State of Black America
14
2015 STATE OF BLACK AMERICA¨
LOCKED OUT
In 1976, schools had been legally desegregated for 22
years, the Civil Rights Act of 1964 was 12 years old, the
Voting Rights Act of 1965 had been in place 11 years, and
the economy was one year into economic recovery from
the recession that lasted from November 1973 to March
1975. Still, Blacks were nearly twice as likely as whites to
be unemployed; the median Black household had only
59 cents for every dollar of income in the median white
household; and African Americans were three times more
likely to live in poverty than whites.
While these racial disparities continued to persist more
than a decade after several pieces of landmark equal rights
legislation had passed, that’s not to say there had been
no progress. The State of Black America 2013 presented a
50-year retrospective on the March on Washington for Jobs
and Freedom – one year before the Civil Rights Act of 1964
was signed into law -- which is a useful point of comparison.
Between 1963 and 1976, Blacks experienced tremendous
gains in school enrollment and educational attainment. In
1963, only one-quarter of Black adults had completed high
school. By 1976, that number had grown to 43.8 percent. At
the college level, there were more than twice as many Black
18-24 year olds enrolled in college in 1976 than in 1963. The
standard of living for Black Americans had also risen over
that 13-year period. Despite the fact that the Black poverty
rate was three times the white rate both in 1963 and 1976,
poverty rates for both groups had fallen significantly over
that time (down 21.6 and 6.2 percentage points for Blacks
and whites, respectively). By 1976, the Black-White income
gap had closed 6 percentage points (from 53% in 1963), and
the homeownership gap had closed 10 percentage points
(from 55% in 1963 to 65% in 1976).
Since 1976, educational progress has continued. Eighty-six
percent of African Americans are high school completers;
the share with a bachelor’s degree or more has more than
tripled (from 6.6% to 22.2%); and roughly one-third of
18-24 year-olds are enrolled in college. While whites have
increased college enrollment faster than Blacks between
1976 and 2014 (most recent data available), the college
completion gap has narrowed 20 percentage points over
this time (from 43% in 1976 to 63% in 2014).
However, despite notable absolute progress for Black
America, there has been much less relative progress
towards economic equality with whites, especially when
compared to the progress made toward educational
equality. This is especially notable when it comes
to unemployment. With few exceptions, the Black
unemployment rate has consistently remained about twice
the white rate across time and at every level of education.
Compared to 40 years ago, the income gap has remained
basically unchanged (now at 60%), and the homeownership
rate gap has actually grown six percentage points (now at
59%). The foreclosure crisis has left Black homeownership
rates at approximately the same point they were in 1976,
while the white homeownership rate is now five percentage
points higher. On the other hand, there has been slow,
but ongoing progress in reducing poverty, in spite of the
economic challenges presented by the Great Recession.
According to the most recent estimates, the Black poverty
rate is now 2.4 percentage points lower than in 1976 (down
to 27% from 29.4%).
Finally, in an election year, progress in voter participation
is mixed. While the percentages of Blacks and whites who
actually voted in the last election are both much lower
than the percentages in 1976, this is partly due to the fact
that these data are comparing a presidential election year
(1976) with a non-presidential election year (2014). Voter
participation drops considerably in mid-term election
years. However, even with this decline in participation,
that gap between Blacks and whites has narrowed seven
percentage points, suggesting that Black civic engagement
has declined by less than that of whites.
“Such severe
distress in any single
segment of society
is bound to have
large consequences
throughout all of
American life.”
15
NATIONAL URBAN LEAGUE
Median Income
Median Household Income (Real), Dollars $9,242 $15,537 59% $35,481 $59,622 60%
Poverty
Population Living Below Poverty Line 29.4% 9.1% 31% 27.0% 10.8% 40%
Employment Issues
Unemployment Rate 13.2% 7.0% 53% 9.6% 4.6% 48%
Housing  Wealth
Home Ownership Rate, (1) 43.7% 67.6% 65% 43% 72.6% 59%
Transportation
Car Ownership, % (1) 54 84.6 64% 70.5 88.3 80%
Life Expectancy
Life Expectancy at Birth 68.3 73.5 93% 75.1 78.9 95%
Democratic Process
Actually voted, % of citizen population 48.7% 60.9% 80% 39.7% 45.8% 87%
Attainment
(25 years and older)
High School Graduate
Some College
Bachelor’s Degree or more
28.2%
9.0%
6.6%
37.3%
13.5%
15.4%
76%
67%
43%
33.4%
24.3%
22.2%
29.7%
27.8%
35.6%
112%
87%
63%
ECONOMICS Black White Index Black White Index
EDUCATION
HEALTH
CIVIC ENGAGEMENT
Table 1
1976(1)
Present
40 YEAR COMPARISON
Then  Now
(1) All 1976 data (except Car Ownership data) from the Census’
1977 and 1978 Statistical Abstracts
16
2015 STATE OF BLACK AMERICA¨
LOCKED OUT
Access the full articles and additional contributors at www.stateofblackamerica.org.
17
NATIONAL URBAN LEAGUE
FROM WHERE DO WE GO FROM HERE:
AMERICA AFTER OBAMA
BY JOY-ANN REID, JOURNALIST AND AUTHOR;
NATIONAL CORRESPONDENT, MSNBC
FROM CELEBRATING THE 40TH
ANNIVERSARY OF THE STATE OF BLACK
AMERICA®
BY MICHAEL NEIDORFF, CHAIRMAN, PRESIDENT
AND CHIEF EXECUTIVE OFFICER, CENTENE
CORPORATION AND CHAIRMAN OF THE BOARD, 	
		 NATIONAL URBAN LEAGUE
“The next president is likely to face a much more “radical ask” from Black
America on economic development, educational progress and political
opportunity. Questions like: where are the Black governors, senators and
other statewide officials in development by the Democratic Party and
why there isn’t a more robust Black leadership class among Republicans,
not to mention the potential for one to three open seats on the Supreme
Court, are likely to move to the front burner as the political season wears
on and a new president is sworn in. Whether the next president is a
Democrat or Republican, Black leadership will likely be pressed as never
before to deliver on the “hope floor” laid by the election of the first Black
president…In short, the Age of Hope is poised to give way to the Era of
Radical Demands for Change.”
“Economic indicators and experts agree that our country continues
to make progress since the Great Recession, but for many African
Americans and others in urban and low-income communities, wide
gaps of inequality in income, housing and education remain….Through
innovation, investment and creativity, businesses have the opportunity to
contribute to the resolution of social and economic disparities. Businesses
are particularly well suited to facilitate transformative partnerships
between the public, private and social sectors and be a catalyst for
positive social change…one business at a time, one community at a
time. The business sector must take the lead in creating stronger, more
economically viable and healthier communities across this nation. I invite
each of you to use this 40th anniversary edition of the State of Black
America and the recommendations found throughout as a catalyst to
build thoughtful solutions in support of your communities.”
FROM LIFTING URBAN AMERICA UP: THE
URBAN PROGRESS INITIATIVE
BY CONGRESSWOMAN ROBIN L. KELLY,
ILLINOIS - 2ND CONGRESSIONAL DISTRICT
FROM THE FIGHT FOR EQUITY IN
EDUCATION
BY ALLAN GOLSTON, PRESIDENT, U.S. PROGRAM
– BILL  MELINDA GATES FOUNDATION
“Today, more than ever before, education doesn’t end with high school.
A postsecondary degree or credential offers the surest course to career
opportunity and individual success in life. We need to make college more
personalized and flexible to meet the needs of today’s students, who are
more diverse than ever. Many are working full-time, while others are raising
kids or returning to school at an older age….We cannot accept the status
quo. It is time to look closely at approaches suggested by the data, listen
to families and commit to implementing real solutions in our schools and
communities…we are committed to addressing inequity and achievement
gaps, including looking more closely at how to get students started on the
right path through early learning opportunities, because we believe that
every person deserves the chance to live a healthy and productive life. We
believe the fight for equity is one that all Americans should join.”
“With shootings and killings on pace to reach historic levels in 2016,
Chicago has become the unfortunate epicenter of our nation’s gun
violence epidemic. But what is often obscured by the headlines is the root
cause of the problem. The gun violence in Chicago and cities like it are but
a symptom of a much larger, systemic ailment afflicting urban America:
hopelessness. The lack of economic opportunity in urban America creates
a malaise that depresses communities and clouds the outlook of those who
live there…. As a member of Congress representing some of our nation’s
most underserved, violence-plagued communities, I’ve seen first-hand
the transformative power of economic opportunity. By giving our young
people greater access to a quality education and gainful employment,
we absolutely can break the cycle of violence gripping our communities.
Nothing stops a bullet like a job.”
FROM RELIEVING THE PLIGHT OF BLACK
MALE UNEMPLOYMENT
BY MICHAEL P. MCMILLAN, PRESIDENT 
CHIEF EXECUTIVE OFFICER, URBAN LEAGUE OF
METROPOLITAN ST. LOUIS
FROM IF WE WANT CHANGE, WE MUST
RAISE OUR VOICES
BY U.S. SENATOR KIRSTEN GILLIBRAND,
NEW YORK
“Later this year, millions of Americans will head to the polls to choose our
next President. This choice matters. A large segment of our population
– including a disproportionate part of the African-American community
– continues to face many systemic challenges that shouldn’t still exist in
the year 2016, but that just won’t go away: Economic inequality. Voting
rights. Gun violence. We should keep all of these challenges in mind as we
prepare to vote. To solve them, all of us have a responsibility to raise our
voices, speak out against these injustices and go to the polls on Election
Day…. We can make our families more stable and more cohesive. We
can make it easier for Americans to vote. We can stop the cycle of gun
violence. We just need new policies that actually reflect the world we live
in today….So if you care about these issues, speak out about them….If
enough of us raise our voices, we can change the world.”
“In January 2015, the [Save Our Sons Workforce Development Program/
SOS] program began, and since that date, we have helped 200 men find
and maintain jobs. SOS offers four major tenets of its four-week workforce
education program: (1) how to find a job; (2) how to keep a job; (3) how
to get promoted; and (4) how to remain marketable in the workplace. We
are proud to report that the program had a 99 percent success rate in
2015 among men who were previously unemployed or underemployed.
It is also important to note that 55 percent of our SOS participants had
prior felony convictions….While we are thrilled with the success of SOS
and other upcoming programs, we believe that programs such as SOS
can be scaled across other National Urban League affiliates and across the
nation to significantly lower the unemployment rates of Black men in our
communities and strengthen African-American families as a whole.”
18
2015 STATE OF BLACK AMERICA¨
LOCKED OUT
Publisher
Marc H. Morial
Editorial Director
Latraviette D. Smith-Wilson
Executive Editor
Shu-Fy Pongnon
Senior Editor
Simone Jordan
Creative Director
Rhonda Spears Bell
Graphic Design
Dionte Noble
Cover Illustration
Untuck Design
FROM THE INEXTRICABLE LINK BETWEEN
TRANSPORTATION AND OPPORTUNITY
BY STEPHANIE JONES, SENIOR COUNSELOR TO
THE SECRETARY AND CHIEF OPPORTUNITIES
OFFICER, U.S. DEPT. OF TRANSPORTATION
“Transportation not only connects us to the places we need to go, it also
helps to invigorate opportunity within a community. The bottom line is
this: without transportation, there is no opportunity. Being able to move
freely is essential to exercising one’s full rights of citizenship. Did you
know transportation underpinned much of the Civil Rights Movement?
Plessy v. Ferguson, the Montgomery Bus Boycott, and the Freedom Rides
all centered on the intersection of transportation and civil rights. It is no
coincidence that just two years after the 1964 Civil Rights Act was enacted,
President Lyndon Johnson signed the act creating the Department of
Transportation....As the first Chief Opportunities Officer in the federal
government, it is my mission each day to think about how the Department’s
work can enable all Americans to have access to opportunity….Together,
we can work to bridge the divide.”
FROM THE CASE FOR INCLUSIVE
INNOVATION: MINORITY
ENTREPRENEURSHIP AND AMERICA’S
ECONOMIC FUTURE
BY ALEJANDRA CASTILLO, NATIONAL
DIRECTOR, MINORITY BUSINESS DEVELOPMENT 	
		 AGENCY
“As the National Urban League releases this important annual look at
opportunity in Black and Latino communities, I’ll make the case for why
America is at a major inflection point in terms of minority entrepreneurs. Our
nation’s demographic profile is quickly transforming to ‘majority-minority’
status with a plurality of African Americans, Latinos and Asians already
comprising majority populations in several U.S. states. This demographic
change coincides with yet another major shift, one characterized by the
many technological innovations and science-based businesses driving
global commerce and education, not to mention a growing millennial
generation that is embracing entrepreneurship as part of their DNA. These
many factors are leading the way for minority entrepreneurs and minority-
owned businesses to position themselves within an eco-system that can
create opportunities to diversify into new industries, build capacity and
ensure scale, particularly in STEM or technology-based fields.”
FROM BREAKING THE WALLS IN BUSINESS:
ENTREPRENEURIAL PATHWAYS TO
PURPOSE, PROFIT AND PERPETUITY
BY RICHELIEU DENNIS, FOUNDER  CEO,
SUNDIAL BRANDS (MAKERS OF SHEAMOISTURE,	
NUBIAN HERITAGE AND MADAM C.J. WALKER 	
		 BEAUTY CULTURE)
“We started our company out of a need to survive, but we’ve built it based
on a mission not only to help others survive, but to prosper. In fact, we
view ourselves as a mission with a business, rather than a business with a
mission. Because of that, our purpose – to empower people to live more
beautiful lives – sits at the center of everything we do as company and
compels us to keep community at our core. This spirit of purpose and
empowering those around us led to our purpose-driven business model
called Community Commerce, which equips underserved people and
communities with access to the opportunities and resources that enable
them to create lasting value for themselves and others. It results in an
ability to build stronger, self-sustaining communities and enterprises....
Making an impact isn’t just how – but also why – we do business. As such,
part of our vision has also always been to build a business and a business
model that other minority-owned or under-resourced businesses could be
inspired by, learn from and expand upon.”
FROM THE MINORITY VOTE AS A MAJORITY
FACTOR IN THE 2016 ELECTION
BY DR. SILAS LEE, POLLSTER, TRIAL
CONSULTANT AND SOCIOLOGIST
“For African-American voters, the 2016 presidential election is more than
the projection of a four or eight-year agenda. It provides an important
opportunity to reassess our position in the political ecosystem. I realize
that in today’s instant information society, events are analyzed from a one-
dimensional perspective, rather than a multi-dimensional interpretation
incorporating the intersection of historical policies on contemporary
events. As a pollster and sociologist, I believe we must recognize that if we
are going to strategically plan for the future, we must think about building
our community infrastructures, coalitions and accountability….When
citizens look in the mirror and see their quality of life deteriorating, police
brutality in their communities, voter suppression, opposition to equal pay
for women, the venom of racism and anti-LGBT legislation, they do not see
an inclusive America, but a country blind to their existence and needs. If
demographics represent the future of America, the potential of a majority-
minority electorate will transform the political and social landscape.”
19
NATIONAL URBAN LEAGUE
About the National Urban League
The National Urban League (www.nul.org) is a historic civil rights and urban advocacy organization dedicated to economic empowerment in historically
underserved urban communities. Founded in 1910 and headquartered in New York City, the National Urban League has improved the lives of tens of millions
of people nationwide through direct service programs that are implemented locally by its 88 Urban League affiliates in 36 states and the District of Columbia.
The organization also conducts public policy research and advocacy activities from its Washington, D.C. bureau. The National Urban League, a BBB-accredited
organization, has a 4-star rating from Charity Navigator, placing it in the top 10 percent of all U.S. charities for adhering to good governance, fiscal responsibility
and other best practices.
AKRON, OH
Akron Urban League
ALEXANDRIA, VA
Northern Virginia Urban League
ALTON, IL
Madison County Urban League
ATLANTA, GA
Urban League of Greater Atlanta
AURORA, IL
Quad County Urban League
AUSTIN, TX
Austin Area Urban League
BALTIMORE, MD
Greater Baltimore Urban League
BATTLE CREEK, MI
Southwestern Michigan Urban League
BINGHAMTON, NY
Broome County Urban League
BIRMINGHAM, AL
Birmingham Urban League
BOSTON, MA
Urban League of Eastern Massachusetts
BUFFALO, NY
Buffalo Urban League
CANTON, OH
Greater Stark County Urban League, Inc.
CHARLESTON, SC
Charleston Trident Urban League
CHARLOTTE, NC
Urban League of Central Carolinas, Inc.
CHATTANOOGA, TN
Urban League Greater Chattanooga, Inc.
CHICAGO, IL
Chicago Urban League
CINCINNATI, OH
Urban League of Greater
Southwestern Ohio
CLEVELAND, OH
Urban League of Greater Cleveland
COLUMBIA, SC
Columbia Urban League
COLUMBUS, GA
Urban League of Greater Columbus, Inc.
COLUMBUS, OH
Columbus Urban League
DENVER, CO
Urban League of Metropolitan Denver
DETROIT, MI
Urban League of Detroit 
Southeastern Michigan
ELIZABETH, NJ
Urban League of Union County
ELYRIA, OH
Lorain County Urban League
ENGLEWOOD, NJ
Urban League for Bergen County
FARRELL, PA
Urban League of Shenango Valley
FLINT, MI
Urban League of Flint
FORT LAUDERDALE, FL
Urban League of Broward County
FORT WAYNE, IN
Fort Wayne Urban League
GARY, IN
Urban League of Northwest Indiana, Inc.
GRAND RAPIDS, MI
Grand Rapids Urban League
GREENVILLE, SC
Urban League of the Upstate, Inc.
HARTFORD, CT
Urban League of Greater Hartford
HEMPSTEAD, NY (LONG ISLAND)
Urban League of Long Island
HOUSTON, TX
Houston Area Urban League
INDIANAPOLIS, IN
Indianapolis Urban League
JACKSONVILLE, FL
Jacksonville Urban League
JERSEY CITY, NJ
Urban League of Hudson County
KANSAS CITY, MO
Urban League of Kansas City
KNOXVILLE, TN
Knoxville Area Urban League
LAS VEGAS, NV
Las Vegas–Clark County Urban League
LEXINGTON, KY
Urban League of Lexington–Fayette
County
LOS ANGELES, CA
Los Angeles Urban League
LOUISVILLE, KY
Louisville Urban League
MADISON, WI
Urban League of Greater Madison
MEMPHIS, TN
Memphis Urban League
MIAMI, FL
Urban League of Greater Miami
MILWAUKEE, WI
Milwaukee Urban League
MINNEAPOLIS, MN
Minneapolis Urban League
MORRISTOWN, NJ
Morris County Urban League
NASHVILLE, TN
Urban League of Middle Tennessee
NEW ORLEANS, LA
Urban League of Greater New Orleans
NEW YORK, NY
New York Urban League
NEWARK, NJ
Urban League of Essex County
OKLAHOMA CITY, OK
Urban League of Greater Oklahoma City
OMAHA, NE
Urban League of Nebraska, Inc.
ORLANDO, FL
Central Florida Urban League
PEORIA, IL
Tri-County Urban League
PHILADELPHIA, PA
Urban League of Philadelphia
PHOENIX, AZ
Greater Phoenix Urban League
PITTSBURGH, PA
Urban League of Greater Pittsburgh
PORTLAND, OR
Urban League of Portland
PROVIDENCE, RI
Urban League of Rhode Island
RACINE, WI
Urban League of Racine  Kenosha, Inc.
ROCHESTER, NY
Urban League of Rochester
SACRAMENTO, CA
Greater Sacramento Urban League
SAINT LOUIS, MO
Urban League of Metropolitan St. Louis
SAINT PETERSBURG, FL
Pinellas County Urban League
SAN DIEGO, CA
Urban League of San Diego County
SEATTLE, WA
Urban League of Metropolitan Seattle
SPRINGFIELD, IL
Springfield Urban League, Inc.
SPRINGFIELD, MA
Urban League of Springfield
STAMFORD, CT
Urban League of Southern Connecticut
TACOMA, WA
Tacoma Urban League
TALLAHASSEE, FL
Tallahassee Urban League
TUCSON, AZ
Tucson Urban League
TULSA, OK
Metropolitan Tulsa Urban League
VIRGINIA BEACH, VA (NORFOLK)
Urban League of Hampton Roads
WARREN, OH
Greater Warren-Youngstown
Urban League
WASHINGTON, DC
Greater Washington Urban League
WEST PALM BEACH, FL
Urban League of Palm Beach County, Inc.
WHITE PLAINS, NY
Urban League of Westchester County
WICHITA, KS
Urban League of Kansas, Inc.
WILMINGTON, DE
Metropolitan Wilmington Urban League
WINSTON-SALEM, NC
Winston-Salem Urban League
NATIONAL URBAN LEAGUE AFFILIATES
120 WALL STREET | NEW YORK, NY 10005 | WWW.NUL.ORG

Más contenido relacionado

La actualidad más candente

Black Males, Social Imagery, and the Disruption of Pathological Identities
Black Males, Social Imagery, and the Disruption of Pathological IdentitiesBlack Males, Social Imagery, and the Disruption of Pathological Identities
Black Males, Social Imagery, and the Disruption of Pathological IdentitiesJonathan Dunnemann
 
The Souls of Poor Folk: Auditing America 50 Years After the Poor People’s Cam...
The Souls of Poor Folk: Auditing America 50 Years After the Poor People’s Cam...The Souls of Poor Folk: Auditing America 50 Years After the Poor People’s Cam...
The Souls of Poor Folk: Auditing America 50 Years After the Poor People’s Cam...SOA Watch Labor Caucas: SE MI
 
Toward a New Macro-Segregation? Decomposing Segregation within and between Me...
Toward a New Macro-Segregation? Decomposing Segregation within and between Me...Toward a New Macro-Segregation? Decomposing Segregation within and between Me...
Toward a New Macro-Segregation? Decomposing Segregation within and between Me...Jonathan Dunnemann
 
Building Healthy Places: How are Community Development Organizations Contribu...
Building Healthy Places: How are Community Development Organizations Contribu...Building Healthy Places: How are Community Development Organizations Contribu...
Building Healthy Places: How are Community Development Organizations Contribu...Jonathan Dunnemann
 
A place-conscious approach can strengthen integrated strategies in poor neigh...
A place-conscious approach can strengthen integrated strategies in poor neigh...A place-conscious approach can strengthen integrated strategies in poor neigh...
A place-conscious approach can strengthen integrated strategies in poor neigh...Jonathan Dunnemann
 
Black Men Making it in America
Black Men Making it in AmericaBlack Men Making it in America
Black Men Making it in AmericaJonathan Dunnemann
 
A New Political Beat- Beyond Red and Blue States
A New Political Beat- Beyond Red and Blue StatesA New Political Beat- Beyond Red and Blue States
A New Political Beat- Beyond Red and Blue StatesLerma Agency
 
Soc315 v6 multicultural matrix and analysis worksheetsoc315 v
Soc315 v6 multicultural matrix and analysis worksheetsoc315 vSoc315 v6 multicultural matrix and analysis worksheetsoc315 v
Soc315 v6 multicultural matrix and analysis worksheetsoc315 vrock73
 
Being a child born from rape during the genocide against Tutsi: A duality wit...
Being a child born from rape during the genocide against Tutsi: A duality wit...Being a child born from rape during the genocide against Tutsi: A duality wit...
Being a child born from rape during the genocide against Tutsi: A duality wit...AJHSSR Journal
 
S12_Gene_40_2_Kim_et_al_49-55
S12_Gene_40_2_Kim_et_al_49-55S12_Gene_40_2_Kim_et_al_49-55
S12_Gene_40_2_Kim_et_al_49-55Aundaray Guess
 
Wealth Inequalities in Greater Boston: Do Race and Ethnicity Matter?
Wealth Inequalities in Greater Boston: Do Race and Ethnicity Matter?Wealth Inequalities in Greater Boston: Do Race and Ethnicity Matter?
Wealth Inequalities in Greater Boston: Do Race and Ethnicity Matter?Instituto Diáspora Brasil (IDB)
 
America_Divided_Guide-4
America_Divided_Guide-4America_Divided_Guide-4
America_Divided_Guide-4Sara Wicht
 
Problems of inequaltity and power presentation
Problems of inequaltity and power presentationProblems of inequaltity and power presentation
Problems of inequaltity and power presentationLisa Moen
 

La actualidad más candente (20)

Black Males, Social Imagery, and the Disruption of Pathological Identities
Black Males, Social Imagery, and the Disruption of Pathological IdentitiesBlack Males, Social Imagery, and the Disruption of Pathological Identities
Black Males, Social Imagery, and the Disruption of Pathological Identities
 
social problems
social problemssocial problems
social problems
 
Chapter11
Chapter11Chapter11
Chapter11
 
Chapter14
Chapter14Chapter14
Chapter14
 
The Souls of Poor Folk: Auditing America 50 Years After the Poor People’s Cam...
The Souls of Poor Folk: Auditing America 50 Years After the Poor People’s Cam...The Souls of Poor Folk: Auditing America 50 Years After the Poor People’s Cam...
The Souls of Poor Folk: Auditing America 50 Years After the Poor People’s Cam...
 
Toward a New Macro-Segregation? Decomposing Segregation within and between Me...
Toward a New Macro-Segregation? Decomposing Segregation within and between Me...Toward a New Macro-Segregation? Decomposing Segregation within and between Me...
Toward a New Macro-Segregation? Decomposing Segregation within and between Me...
 
Chapter12
Chapter12Chapter12
Chapter12
 
Reporting on Race
Reporting on Race Reporting on Race
Reporting on Race
 
Building Healthy Places: How are Community Development Organizations Contribu...
Building Healthy Places: How are Community Development Organizations Contribu...Building Healthy Places: How are Community Development Organizations Contribu...
Building Healthy Places: How are Community Development Organizations Contribu...
 
A place-conscious approach can strengthen integrated strategies in poor neigh...
A place-conscious approach can strengthen integrated strategies in poor neigh...A place-conscious approach can strengthen integrated strategies in poor neigh...
A place-conscious approach can strengthen integrated strategies in poor neigh...
 
Black Men Making it in America
Black Men Making it in AmericaBlack Men Making it in America
Black Men Making it in America
 
A New Political Beat- Beyond Red and Blue States
A New Political Beat- Beyond Red and Blue StatesA New Political Beat- Beyond Red and Blue States
A New Political Beat- Beyond Red and Blue States
 
Soc315 v6 multicultural matrix and analysis worksheetsoc315 v
Soc315 v6 multicultural matrix and analysis worksheetsoc315 vSoc315 v6 multicultural matrix and analysis worksheetsoc315 v
Soc315 v6 multicultural matrix and analysis worksheetsoc315 v
 
Being a child born from rape during the genocide against Tutsi: A duality wit...
Being a child born from rape during the genocide against Tutsi: A duality wit...Being a child born from rape during the genocide against Tutsi: A duality wit...
Being a child born from rape during the genocide against Tutsi: A duality wit...
 
S12_Gene_40_2_Kim_et_al_49-55
S12_Gene_40_2_Kim_et_al_49-55S12_Gene_40_2_Kim_et_al_49-55
S12_Gene_40_2_Kim_et_al_49-55
 
African American- Immigrant Relations in a Global Era
African American- Immigrant Relations in a Global EraAfrican American- Immigrant Relations in a Global Era
African American- Immigrant Relations in a Global Era
 
The Color of Wealth in Boston
The Color of Wealth in BostonThe Color of Wealth in Boston
The Color of Wealth in Boston
 
Wealth Inequalities in Greater Boston: Do Race and Ethnicity Matter?
Wealth Inequalities in Greater Boston: Do Race and Ethnicity Matter?Wealth Inequalities in Greater Boston: Do Race and Ethnicity Matter?
Wealth Inequalities in Greater Boston: Do Race and Ethnicity Matter?
 
America_Divided_Guide-4
America_Divided_Guide-4America_Divided_Guide-4
America_Divided_Guide-4
 
Problems of inequaltity and power presentation
Problems of inequaltity and power presentationProblems of inequaltity and power presentation
Problems of inequaltity and power presentation
 

Destacado

100 Years of Research in Youth Development
100  Years of Research in Youth Development100  Years of Research in Youth Development
100 Years of Research in Youth DevelopmentJonathan Dunnemann
 
The center for_inter-spiritual_dialogue (06-28-2012 0357 pm)
The center for_inter-spiritual_dialogue (06-28-2012 0357 pm)The center for_inter-spiritual_dialogue (06-28-2012 0357 pm)
The center for_inter-spiritual_dialogue (06-28-2012 0357 pm)Jonathan Dunnemann
 
The Neglected Ethical and Spiritual Motivations in the Workplace
The Neglected Ethical and Spiritual Motivations in the WorkplaceThe Neglected Ethical and Spiritual Motivations in the Workplace
The Neglected Ethical and Spiritual Motivations in the WorkplaceJonathan Dunnemann
 
Persistent Human Dimensions of Poverty
Persistent Human Dimensions of PovertyPersistent Human Dimensions of Poverty
Persistent Human Dimensions of PovertyJonathan Dunnemann
 
Education in a hip hop nation- our identity politics & pedagogy
Education in a hip hop nation- our identity politics & pedagogyEducation in a hip hop nation- our identity politics & pedagogy
Education in a hip hop nation- our identity politics & pedagogyJonathan Dunnemann
 
The tandem project_un_questionnaire_returned
The tandem project_un_questionnaire_returnedThe tandem project_un_questionnaire_returned
The tandem project_un_questionnaire_returnedJonathan Dunnemann
 
Personal Goal Setting and High Order Motives
Personal Goal Setting and High Order Motives Personal Goal Setting and High Order Motives
Personal Goal Setting and High Order Motives Jonathan Dunnemann
 
The 5 most powerful self-beliefs that ignite human behavior
The 5 most powerful self-beliefs that ignite human behaviorThe 5 most powerful self-beliefs that ignite human behavior
The 5 most powerful self-beliefs that ignite human behaviorJonathan Dunnemann
 

Destacado (20)

Sample sq21reportdeepchange
Sample sq21reportdeepchangeSample sq21reportdeepchange
Sample sq21reportdeepchange
 
Art as a_spiritual_practice
Art as a_spiritual_practiceArt as a_spiritual_practice
Art as a_spiritual_practice
 
Practical Spirituality
Practical SpiritualityPractical Spirituality
Practical Spirituality
 
Education1 ch2-sample
Education1 ch2-sampleEducation1 ch2-sample
Education1 ch2-sample
 
100 Years of Research in Youth Development
100  Years of Research in Youth Development100  Years of Research in Youth Development
100 Years of Research in Youth Development
 
The center for_inter-spiritual_dialogue (06-28-2012 0357 pm)
The center for_inter-spiritual_dialogue (06-28-2012 0357 pm)The center for_inter-spiritual_dialogue (06-28-2012 0357 pm)
The center for_inter-spiritual_dialogue (06-28-2012 0357 pm)
 
The Neglected Ethical and Spiritual Motivations in the Workplace
The Neglected Ethical and Spiritual Motivations in the WorkplaceThe Neglected Ethical and Spiritual Motivations in the Workplace
The Neglected Ethical and Spiritual Motivations in the Workplace
 
A deeper-rap
A deeper-rapA deeper-rap
A deeper-rap
 
Persistent Human Dimensions of Poverty
Persistent Human Dimensions of PovertyPersistent Human Dimensions of Poverty
Persistent Human Dimensions of Poverty
 
The Ultimate Triumph of Good
The Ultimate Triumph of GoodThe Ultimate Triumph of Good
The Ultimate Triumph of Good
 
Education in a hip hop nation- our identity politics & pedagogy
Education in a hip hop nation- our identity politics & pedagogyEducation in a hip hop nation- our identity politics & pedagogy
Education in a hip hop nation- our identity politics & pedagogy
 
The Wisdom of Nature
The Wisdom of NatureThe Wisdom of Nature
The Wisdom of Nature
 
Walk this way new
Walk this way newWalk this way new
Walk this way new
 
The tandem project_un_questionnaire_returned
The tandem project_un_questionnaire_returnedThe tandem project_un_questionnaire_returned
The tandem project_un_questionnaire_returned
 
Personal Goal Setting and High Order Motives
Personal Goal Setting and High Order Motives Personal Goal Setting and High Order Motives
Personal Goal Setting and High Order Motives
 
Spirituality - Teen Survey
Spirituality - Teen SurveySpirituality - Teen Survey
Spirituality - Teen Survey
 
The 5 most powerful self-beliefs that ignite human behavior
The 5 most powerful self-beliefs that ignite human behaviorThe 5 most powerful self-beliefs that ignite human behavior
The 5 most powerful self-beliefs that ignite human behavior
 
Integratedperson
IntegratedpersonIntegratedperson
Integratedperson
 
Thewindsbeneathyouthswings
ThewindsbeneathyouthswingsThewindsbeneathyouthswings
Thewindsbeneathyouthswings
 
Sense of community
Sense of communitySense of community
Sense of community
 

Similar a 2016 soba executive summary

Racial wealth snapshot: latino americans | prosperity now
Racial wealth snapshot: latino americans | prosperity nowRacial wealth snapshot: latino americans | prosperity now
Racial wealth snapshot: latino americans | prosperity nowJoseMacias86
 
Latino heritage month: economic inequality and latinos | prosperity now
Latino heritage month: economic inequality and latinos | prosperity nowLatino heritage month: economic inequality and latinos | prosperity now
Latino heritage month: economic inequality and latinos | prosperity nowJoseMacias86
 
South America: Trends & Challenges for Development
South America: Trends & Challenges for DevelopmentSouth America: Trends & Challenges for Development
South America: Trends & Challenges for DevelopmentThe Rockefeller Foundation
 
MsFoundationReport_Web_DiskStation_Sep-15-2054-2015_Conflict
MsFoundationReport_Web_DiskStation_Sep-15-2054-2015_ConflictMsFoundationReport_Web_DiskStation_Sep-15-2054-2015_Conflict
MsFoundationReport_Web_DiskStation_Sep-15-2054-2015_ConflictDeborah Jacobs
 
OAS: INEQUALITY AND SOCIAL INCLUSION IN THE AMERICAS
OAS: INEQUALITY AND SOCIAL INCLUSION IN THE AMERICASOAS: INEQUALITY AND SOCIAL INCLUSION IN THE AMERICAS
OAS: INEQUALITY AND SOCIAL INCLUSION IN THE AMERICASStanleylucas
 
2018 State of Hispanic Homeownership Report by NAHREP GREATER LAS VEGAS
2018 State of Hispanic Homeownership Report by NAHREP GREATER LAS VEGAS 2018 State of Hispanic Homeownership Report by NAHREP GREATER LAS VEGAS
2018 State of Hispanic Homeownership Report by NAHREP GREATER LAS VEGAS Jesse B. Lucero
 
America's Tomorrow Press Coverage May-July 2011
America's Tomorrow Press Coverage May-July 2011America's Tomorrow Press Coverage May-July 2011
America's Tomorrow Press Coverage May-July 2011Pixel Prose Media, LLC
 
Hispanic Market Presentation 2015 7.23.15
Hispanic Market Presentation 2015 7.23.15Hispanic Market Presentation 2015 7.23.15
Hispanic Market Presentation 2015 7.23.15Rebecca Lambert
 
The Hispanic American Market Report 2019
The Hispanic American Market Report 2019The Hispanic American Market Report 2019
The Hispanic American Market Report 2019Depo Consulting
 
AECF-ChangingTheOdds-Atlanta-2015
AECF-ChangingTheOdds-Atlanta-2015AECF-ChangingTheOdds-Atlanta-2015
AECF-ChangingTheOdds-Atlanta-2015Sarah Torian
 
Poverty in the USA
Poverty in the USAPoverty in the USA
Poverty in the USAjdubrow2000
 
Getting the Rural Swagger Back
Getting the Rural Swagger BackGetting the Rural Swagger Back
Getting the Rural Swagger Backruralxchange
 
A Transitional Program for Black Liberation
A Transitional Program for Black LiberationA Transitional Program for Black Liberation
A Transitional Program for Black LiberationRBG Communiversity
 

Similar a 2016 soba executive summary (20)

Racial wealth snapshot: latino americans | prosperity now
Racial wealth snapshot: latino americans | prosperity nowRacial wealth snapshot: latino americans | prosperity now
Racial wealth snapshot: latino americans | prosperity now
 
Latino heritage month: economic inequality and latinos | prosperity now
Latino heritage month: economic inequality and latinos | prosperity nowLatino heritage month: economic inequality and latinos | prosperity now
Latino heritage month: economic inequality and latinos | prosperity now
 
UNIDOS US - 2019 Policy Agenda
UNIDOS US - 2019 Policy AgendaUNIDOS US - 2019 Policy Agenda
UNIDOS US - 2019 Policy Agenda
 
South America: Trends & Challenges for Development
South America: Trends & Challenges for DevelopmentSouth America: Trends & Challenges for Development
South America: Trends & Challenges for Development
 
MsFoundationReport_Web_DiskStation_Sep-15-2054-2015_Conflict
MsFoundationReport_Web_DiskStation_Sep-15-2054-2015_ConflictMsFoundationReport_Web_DiskStation_Sep-15-2054-2015_Conflict
MsFoundationReport_Web_DiskStation_Sep-15-2054-2015_Conflict
 
OAS: INEQUALITY AND SOCIAL INCLUSION IN THE AMERICAS
OAS: INEQUALITY AND SOCIAL INCLUSION IN THE AMERICASOAS: INEQUALITY AND SOCIAL INCLUSION IN THE AMERICAS
OAS: INEQUALITY AND SOCIAL INCLUSION IN THE AMERICAS
 
2018 State of Hispanic Homeownership Report by NAHREP GREATER LAS VEGAS
2018 State of Hispanic Homeownership Report by NAHREP GREATER LAS VEGAS 2018 State of Hispanic Homeownership Report by NAHREP GREATER LAS VEGAS
2018 State of Hispanic Homeownership Report by NAHREP GREATER LAS VEGAS
 
Beyond Post-Racialism, Toward Opportunity and Social Justice
Beyond Post-Racialism, Toward Opportunity and Social Justice Beyond Post-Racialism, Toward Opportunity and Social Justice
Beyond Post-Racialism, Toward Opportunity and Social Justice
 
America's Tomorrow Press Coverage May-July 2011
America's Tomorrow Press Coverage May-July 2011America's Tomorrow Press Coverage May-July 2011
America's Tomorrow Press Coverage May-July 2011
 
Hispanic Market Presentation 2015 7.23.15
Hispanic Market Presentation 2015 7.23.15Hispanic Market Presentation 2015 7.23.15
Hispanic Market Presentation 2015 7.23.15
 
Hansen_Essay_3
Hansen_Essay_3Hansen_Essay_3
Hansen_Essay_3
 
The Hispanic American Market Report 2019
The Hispanic American Market Report 2019The Hispanic American Market Report 2019
The Hispanic American Market Report 2019
 
AECF-ChangingTheOdds-Atlanta-2015
AECF-ChangingTheOdds-Atlanta-2015AECF-ChangingTheOdds-Atlanta-2015
AECF-ChangingTheOdds-Atlanta-2015
 
Structural Racism in Multicultural Canada
Structural Racism in Multicultural CanadaStructural Racism in Multicultural Canada
Structural Racism in Multicultural Canada
 
LDC 2016 Fact Book
LDC 2016 Fact BookLDC 2016 Fact Book
LDC 2016 Fact Book
 
2010 census marketing by rgomezjr
2010 census marketing by rgomezjr2010 census marketing by rgomezjr
2010 census marketing by rgomezjr
 
Poverty in the USA
Poverty in the USAPoverty in the USA
Poverty in the USA
 
Getting the Rural Swagger Back
Getting the Rural Swagger BackGetting the Rural Swagger Back
Getting the Rural Swagger Back
 
Communicate 2016 spreads1
Communicate 2016 spreads1Communicate 2016 spreads1
Communicate 2016 spreads1
 
A Transitional Program for Black Liberation
A Transitional Program for Black LiberationA Transitional Program for Black Liberation
A Transitional Program for Black Liberation
 

Más de Jonathan Dunnemann

BOS City Guide to Sacred Spaces in Boston © Sacred Space International Sacred...
BOS City Guide to Sacred Spaces in Boston © Sacred Space International Sacred...BOS City Guide to Sacred Spaces in Boston © Sacred Space International Sacred...
BOS City Guide to Sacred Spaces in Boston © Sacred Space International Sacred...Jonathan Dunnemann
 
NYC City Guide to Sacred Spaces in New York City © Sacred Space International...
NYC City Guide to Sacred Spaces in New York City © Sacred Space International...NYC City Guide to Sacred Spaces in New York City © Sacred Space International...
NYC City Guide to Sacred Spaces in New York City © Sacred Space International...Jonathan Dunnemann
 
The Theology of Spirituality: It's Growing Importance Amid the Transformation...
The Theology of Spirituality: It's Growing Importance Amid the Transformation...The Theology of Spirituality: It's Growing Importance Amid the Transformation...
The Theology of Spirituality: It's Growing Importance Amid the Transformation...Jonathan Dunnemann
 
How children describe the fruits of meditation
How children describe the fruits of meditationHow children describe the fruits of meditation
How children describe the fruits of meditationJonathan Dunnemann
 
ASSESSMENT OF CHARACTER STRENGTHS AMONG YOUTH: THE VALUES IN ACTION INVENTORY...
ASSESSMENT OF CHARACTER STRENGTHS AMONG YOUTH: THE VALUES IN ACTION INVENTORY...ASSESSMENT OF CHARACTER STRENGTHS AMONG YOUTH: THE VALUES IN ACTION INVENTORY...
ASSESSMENT OF CHARACTER STRENGTHS AMONG YOUTH: THE VALUES IN ACTION INVENTORY...Jonathan Dunnemann
 
Youth Living A Life Of Purpose
Youth Living A Life Of Purpose Youth Living A Life Of Purpose
Youth Living A Life Of Purpose Jonathan Dunnemann
 
African American Spirituality: Through Another Lens
African American Spirituality: Through Another LensAfrican American Spirituality: Through Another Lens
African American Spirituality: Through Another LensJonathan Dunnemann
 
Strengths Building, Resilience, and the Bible: A Story-Based Curriculum for A...
Strengths Building, Resilience, and the Bible: A Story-Based Curriculum for A...Strengths Building, Resilience, and the Bible: A Story-Based Curriculum for A...
Strengths Building, Resilience, and the Bible: A Story-Based Curriculum for A...Jonathan Dunnemann
 
African American Interpretation
African American InterpretationAfrican American Interpretation
African American InterpretationJonathan Dunnemann
 
Appropriating Universality: The Coltranes and 1960s Spirituality
Appropriating Universality: The Coltranes and 1960s SpiritualityAppropriating Universality: The Coltranes and 1960s Spirituality
Appropriating Universality: The Coltranes and 1960s SpiritualityJonathan Dunnemann
 
Faith and the Sacred in African American Life
Faith and the Sacred in African American LifeFaith and the Sacred in African American Life
Faith and the Sacred in African American LifeJonathan Dunnemann
 
Transformative Pedagogy, Black Theology and Participative forms of Praxis
Transformative Pedagogy, Black Theology and Participative forms of PraxisTransformative Pedagogy, Black Theology and Participative forms of Praxis
Transformative Pedagogy, Black Theology and Participative forms of PraxisJonathan Dunnemann
 
A Biblical Basis for Social Justice
A Biblical Basis for Social JusticeA Biblical Basis for Social Justice
A Biblical Basis for Social JusticeJonathan Dunnemann
 
Development of a Program for the Empowerment of Black Single Mother Families ...
Development of a Program for the Empowerment of Black Single Mother Families ...Development of a Program for the Empowerment of Black Single Mother Families ...
Development of a Program for the Empowerment of Black Single Mother Families ...Jonathan Dunnemann
 
The Impact and Legacy of the BSU at 50
The Impact and Legacy of the BSU at 50The Impact and Legacy of the BSU at 50
The Impact and Legacy of the BSU at 50Jonathan Dunnemann
 
A World Bank Group Flagship Report
A World Bank Group Flagship ReportA World Bank Group Flagship Report
A World Bank Group Flagship ReportJonathan Dunnemann
 

Más de Jonathan Dunnemann (20)

"Black Power Statement"
"Black Power Statement""Black Power Statement"
"Black Power Statement"
 
BOS City Guide to Sacred Spaces in Boston © Sacred Space International Sacred...
BOS City Guide to Sacred Spaces in Boston © Sacred Space International Sacred...BOS City Guide to Sacred Spaces in Boston © Sacred Space International Sacred...
BOS City Guide to Sacred Spaces in Boston © Sacred Space International Sacred...
 
NYC City Guide to Sacred Spaces in New York City © Sacred Space International...
NYC City Guide to Sacred Spaces in New York City © Sacred Space International...NYC City Guide to Sacred Spaces in New York City © Sacred Space International...
NYC City Guide to Sacred Spaces in New York City © Sacred Space International...
 
The Theology of Spirituality: It's Growing Importance Amid the Transformation...
The Theology of Spirituality: It's Growing Importance Amid the Transformation...The Theology of Spirituality: It's Growing Importance Amid the Transformation...
The Theology of Spirituality: It's Growing Importance Amid the Transformation...
 
How children describe the fruits of meditation
How children describe the fruits of meditationHow children describe the fruits of meditation
How children describe the fruits of meditation
 
ASSESSMENT OF CHARACTER STRENGTHS AMONG YOUTH: THE VALUES IN ACTION INVENTORY...
ASSESSMENT OF CHARACTER STRENGTHS AMONG YOUTH: THE VALUES IN ACTION INVENTORY...ASSESSMENT OF CHARACTER STRENGTHS AMONG YOUTH: THE VALUES IN ACTION INVENTORY...
ASSESSMENT OF CHARACTER STRENGTHS AMONG YOUTH: THE VALUES IN ACTION INVENTORY...
 
Youth Living A Life Of Purpose
Youth Living A Life Of Purpose Youth Living A Life Of Purpose
Youth Living A Life Of Purpose
 
African American Spirituality: Through Another Lens
African American Spirituality: Through Another LensAfrican American Spirituality: Through Another Lens
African American Spirituality: Through Another Lens
 
Strengths Building, Resilience, and the Bible: A Story-Based Curriculum for A...
Strengths Building, Resilience, and the Bible: A Story-Based Curriculum for A...Strengths Building, Resilience, and the Bible: A Story-Based Curriculum for A...
Strengths Building, Resilience, and the Bible: A Story-Based Curriculum for A...
 
African American Interpretation
African American InterpretationAfrican American Interpretation
African American Interpretation
 
Appropriating Universality: The Coltranes and 1960s Spirituality
Appropriating Universality: The Coltranes and 1960s SpiritualityAppropriating Universality: The Coltranes and 1960s Spirituality
Appropriating Universality: The Coltranes and 1960s Spirituality
 
God of the Oppressed
God of the OppressedGod of the Oppressed
God of the Oppressed
 
Faith and the Sacred in African American Life
Faith and the Sacred in African American LifeFaith and the Sacred in African American Life
Faith and the Sacred in African American Life
 
Transformative Pedagogy, Black Theology and Participative forms of Praxis
Transformative Pedagogy, Black Theology and Participative forms of PraxisTransformative Pedagogy, Black Theology and Participative forms of Praxis
Transformative Pedagogy, Black Theology and Participative forms of Praxis
 
A Biblical Basis for Social Justice
A Biblical Basis for Social JusticeA Biblical Basis for Social Justice
A Biblical Basis for Social Justice
 
Development of a Program for the Empowerment of Black Single Mother Families ...
Development of a Program for the Empowerment of Black Single Mother Families ...Development of a Program for the Empowerment of Black Single Mother Families ...
Development of a Program for the Empowerment of Black Single Mother Families ...
 
The Impact and Legacy of the BSU at 50
The Impact and Legacy of the BSU at 50The Impact and Legacy of the BSU at 50
The Impact and Legacy of the BSU at 50
 
Oblate School of Theology
Oblate School of TheologyOblate School of Theology
Oblate School of Theology
 
The Redemptive Self
The Redemptive SelfThe Redemptive Self
The Redemptive Self
 
A World Bank Group Flagship Report
A World Bank Group Flagship ReportA World Bank Group Flagship Report
A World Bank Group Flagship Report
 

Último

NO1 Certified Black Magic Specialist Expert In Bahawalpur, Sargodha, Sialkot,...
NO1 Certified Black Magic Specialist Expert In Bahawalpur, Sargodha, Sialkot,...NO1 Certified Black Magic Specialist Expert In Bahawalpur, Sargodha, Sialkot,...
NO1 Certified Black Magic Specialist Expert In Bahawalpur, Sargodha, Sialkot,...Amil baba
 
Vp Girls near me Delhi Call Now or WhatsApp
Vp Girls near me Delhi Call Now or WhatsAppVp Girls near me Delhi Call Now or WhatsApp
Vp Girls near me Delhi Call Now or WhatsAppmiss dipika
 
Call Girls Near Me WhatsApp:+91-9833363713
Call Girls Near Me WhatsApp:+91-9833363713Call Girls Near Me WhatsApp:+91-9833363713
Call Girls Near Me WhatsApp:+91-9833363713Sonam Pathan
 
Overview of Inkel Unlisted Shares Price.
Overview of Inkel Unlisted Shares Price.Overview of Inkel Unlisted Shares Price.
Overview of Inkel Unlisted Shares Price.Precize Formely Leadoff
 
Financial analysis on Risk and Return.ppt
Financial analysis on Risk and Return.pptFinancial analysis on Risk and Return.ppt
Financial analysis on Risk and Return.ppttadegebreyesus
 
Economic Risk Factor Update: April 2024 [SlideShare]
Economic Risk Factor Update: April 2024 [SlideShare]Economic Risk Factor Update: April 2024 [SlideShare]
Economic Risk Factor Update: April 2024 [SlideShare]Commonwealth
 
AnyConv.com__FSS Advance Retail & Distribution - 15.06.17.ppt
AnyConv.com__FSS Advance Retail & Distribution - 15.06.17.pptAnyConv.com__FSS Advance Retail & Distribution - 15.06.17.ppt
AnyConv.com__FSS Advance Retail & Distribution - 15.06.17.pptPriyankaSharma89719
 
The Inspirational Story of Julio Herrera Velutini - Global Finance Leader
The Inspirational Story of Julio Herrera Velutini - Global Finance LeaderThe Inspirational Story of Julio Herrera Velutini - Global Finance Leader
The Inspirational Story of Julio Herrera Velutini - Global Finance LeaderArianna Varetto
 
House of Commons ; CDC schemes overview document
House of Commons ; CDC schemes overview documentHouse of Commons ; CDC schemes overview document
House of Commons ; CDC schemes overview documentHenry Tapper
 
NO1 WorldWide Genuine vashikaran specialist Vashikaran baba near Lahore Vashi...
NO1 WorldWide Genuine vashikaran specialist Vashikaran baba near Lahore Vashi...NO1 WorldWide Genuine vashikaran specialist Vashikaran baba near Lahore Vashi...
NO1 WorldWide Genuine vashikaran specialist Vashikaran baba near Lahore Vashi...Amil baba
 
The Core Functions of the Bangko Sentral ng Pilipinas
The Core Functions of the Bangko Sentral ng PilipinasThe Core Functions of the Bangko Sentral ng Pilipinas
The Core Functions of the Bangko Sentral ng PilipinasCherylouCamus
 
Kempen ' UK DB Endgame Paper Apr 24 final3.pdf
Kempen ' UK DB Endgame Paper Apr 24 final3.pdfKempen ' UK DB Endgame Paper Apr 24 final3.pdf
Kempen ' UK DB Endgame Paper Apr 24 final3.pdfHenry Tapper
 
project management information system lecture notes
project management information system lecture notesproject management information system lecture notes
project management information system lecture notesongomchris
 
212MTAMount Durham University Bachelor's Diploma in Technology
212MTAMount Durham University Bachelor's Diploma in Technology212MTAMount Durham University Bachelor's Diploma in Technology
212MTAMount Durham University Bachelor's Diploma in Technologyz xss
 
NO1 Certified Amil Baba In Lahore Kala Jadu In Lahore Best Amil In Lahore Ami...
NO1 Certified Amil Baba In Lahore Kala Jadu In Lahore Best Amil In Lahore Ami...NO1 Certified Amil Baba In Lahore Kala Jadu In Lahore Best Amil In Lahore Ami...
NO1 Certified Amil Baba In Lahore Kala Jadu In Lahore Best Amil In Lahore Ami...Amil baba
 
(办理学位证)加拿大萨省大学毕业证成绩单原版一比一
(办理学位证)加拿大萨省大学毕业证成绩单原版一比一(办理学位证)加拿大萨省大学毕业证成绩单原版一比一
(办理学位证)加拿大萨省大学毕业证成绩单原版一比一S SDS
 
The AES Investment Code - the go-to counsel for the most well-informed, wise...
The AES Investment Code -  the go-to counsel for the most well-informed, wise...The AES Investment Code -  the go-to counsel for the most well-informed, wise...
The AES Investment Code - the go-to counsel for the most well-informed, wise...AES International
 
Bladex 1Q24 Earning Results Presentation
Bladex 1Q24 Earning Results PresentationBladex 1Q24 Earning Results Presentation
Bladex 1Q24 Earning Results PresentationBladex
 

Último (20)

NO1 Certified Black Magic Specialist Expert In Bahawalpur, Sargodha, Sialkot,...
NO1 Certified Black Magic Specialist Expert In Bahawalpur, Sargodha, Sialkot,...NO1 Certified Black Magic Specialist Expert In Bahawalpur, Sargodha, Sialkot,...
NO1 Certified Black Magic Specialist Expert In Bahawalpur, Sargodha, Sialkot,...
 
Vp Girls near me Delhi Call Now or WhatsApp
Vp Girls near me Delhi Call Now or WhatsAppVp Girls near me Delhi Call Now or WhatsApp
Vp Girls near me Delhi Call Now or WhatsApp
 
Call Girls Near Me WhatsApp:+91-9833363713
Call Girls Near Me WhatsApp:+91-9833363713Call Girls Near Me WhatsApp:+91-9833363713
Call Girls Near Me WhatsApp:+91-9833363713
 
Overview of Inkel Unlisted Shares Price.
Overview of Inkel Unlisted Shares Price.Overview of Inkel Unlisted Shares Price.
Overview of Inkel Unlisted Shares Price.
 
Financial analysis on Risk and Return.ppt
Financial analysis on Risk and Return.pptFinancial analysis on Risk and Return.ppt
Financial analysis on Risk and Return.ppt
 
🔝+919953056974 🔝young Delhi Escort service Pusa Road
🔝+919953056974 🔝young Delhi Escort service Pusa Road🔝+919953056974 🔝young Delhi Escort service Pusa Road
🔝+919953056974 🔝young Delhi Escort service Pusa Road
 
Economic Risk Factor Update: April 2024 [SlideShare]
Economic Risk Factor Update: April 2024 [SlideShare]Economic Risk Factor Update: April 2024 [SlideShare]
Economic Risk Factor Update: April 2024 [SlideShare]
 
AnyConv.com__FSS Advance Retail & Distribution - 15.06.17.ppt
AnyConv.com__FSS Advance Retail & Distribution - 15.06.17.pptAnyConv.com__FSS Advance Retail & Distribution - 15.06.17.ppt
AnyConv.com__FSS Advance Retail & Distribution - 15.06.17.ppt
 
The Inspirational Story of Julio Herrera Velutini - Global Finance Leader
The Inspirational Story of Julio Herrera Velutini - Global Finance LeaderThe Inspirational Story of Julio Herrera Velutini - Global Finance Leader
The Inspirational Story of Julio Herrera Velutini - Global Finance Leader
 
House of Commons ; CDC schemes overview document
House of Commons ; CDC schemes overview documentHouse of Commons ; CDC schemes overview document
House of Commons ; CDC schemes overview document
 
NO1 WorldWide Genuine vashikaran specialist Vashikaran baba near Lahore Vashi...
NO1 WorldWide Genuine vashikaran specialist Vashikaran baba near Lahore Vashi...NO1 WorldWide Genuine vashikaran specialist Vashikaran baba near Lahore Vashi...
NO1 WorldWide Genuine vashikaran specialist Vashikaran baba near Lahore Vashi...
 
Q1 2024 Newsletter | Financial Synergies Wealth Advisors
Q1 2024 Newsletter | Financial Synergies Wealth AdvisorsQ1 2024 Newsletter | Financial Synergies Wealth Advisors
Q1 2024 Newsletter | Financial Synergies Wealth Advisors
 
The Core Functions of the Bangko Sentral ng Pilipinas
The Core Functions of the Bangko Sentral ng PilipinasThe Core Functions of the Bangko Sentral ng Pilipinas
The Core Functions of the Bangko Sentral ng Pilipinas
 
Kempen ' UK DB Endgame Paper Apr 24 final3.pdf
Kempen ' UK DB Endgame Paper Apr 24 final3.pdfKempen ' UK DB Endgame Paper Apr 24 final3.pdf
Kempen ' UK DB Endgame Paper Apr 24 final3.pdf
 
project management information system lecture notes
project management information system lecture notesproject management information system lecture notes
project management information system lecture notes
 
212MTAMount Durham University Bachelor's Diploma in Technology
212MTAMount Durham University Bachelor's Diploma in Technology212MTAMount Durham University Bachelor's Diploma in Technology
212MTAMount Durham University Bachelor's Diploma in Technology
 
NO1 Certified Amil Baba In Lahore Kala Jadu In Lahore Best Amil In Lahore Ami...
NO1 Certified Amil Baba In Lahore Kala Jadu In Lahore Best Amil In Lahore Ami...NO1 Certified Amil Baba In Lahore Kala Jadu In Lahore Best Amil In Lahore Ami...
NO1 Certified Amil Baba In Lahore Kala Jadu In Lahore Best Amil In Lahore Ami...
 
(办理学位证)加拿大萨省大学毕业证成绩单原版一比一
(办理学位证)加拿大萨省大学毕业证成绩单原版一比一(办理学位证)加拿大萨省大学毕业证成绩单原版一比一
(办理学位证)加拿大萨省大学毕业证成绩单原版一比一
 
The AES Investment Code - the go-to counsel for the most well-informed, wise...
The AES Investment Code -  the go-to counsel for the most well-informed, wise...The AES Investment Code -  the go-to counsel for the most well-informed, wise...
The AES Investment Code - the go-to counsel for the most well-informed, wise...
 
Bladex 1Q24 Earning Results Presentation
Bladex 1Q24 Earning Results PresentationBladex 1Q24 Earning Results Presentation
Bladex 1Q24 Earning Results Presentation
 

2016 soba executive summary

  • 1. A MESSAGE TO THE NEXT PRESIDENT
  • 2. EXPERIENCE ALL THAT THE NATIONAL URBAN LEAGUE’S STATE OF BLACK AMERICA® HAS TO OFFER! In addition to the key findings and insights highlighted in this executive summary, the State of Black America offers a multi-media and social experience that will encourage more interaction, deeper learning, and year-round updates and contributions. Celebrating 40 years of the State of Black America® – now an all-digital experience! THE SUITE OF STATE OF BLACK AMERICA OFFERINGS FOR 2016 INCLUDES: Complete Website A digital hub where visitors can access all-things State of Black America – including full data sets and analysis for the 2016 National Equality Index™; full 70-city list of Black-White and Hispanic-White Metropolitan Area Equality Index rankings for unemployment and income; 40-Year Retrospective Equality Index; full articles from the 2016 State of Black America contributors; additional data and report findings; press materials; infographics and charts; and year-round updates with new contributors addressing issues impacting the state of Black America in real-time; www.stateofblackamerica.org. Web Series Five-part series that gathers the nation’s leaders, political pundits, and executives for a lively discussion around the 2016 State of Black America theme, “Locked Out: Education, Jobs and Justice,” the State of Black America Equality Index topics and content highlighted in the report. View it at www.stateofblackamerica.org and on our partner sites - Interactive One and NBCBLK. Tell us what you think, and follow the State of Black America conversation on Twitter – #LockedOut
  • 3. 4 About the State of Black America¨ 5 From the President’s Desk Marc H. Morial 7 Overview of 2016 National Urban League Equality Index™ 8 Overview of 2016 Metropolitan Unemployment Equality Index 10 Overview of 2016 Metropolitan Income Equality Index 12 State of Black America 1976-2016: A 40-Year Retrospective 16 2016 State of Black America Contributors Article Excerpts 19 About the National Urban League NATIONAL URBAN LEAGUE
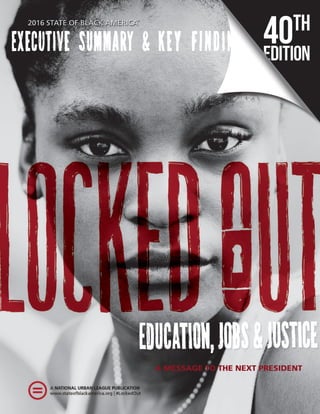
  • 4. 2016 STATE OF BLACK AMERICA© LOCKED OUT The State of Black America®, the National Urban League’s seminal annual publication now in its 40th edition, has become one of the most highly-anticipated benchmarks and sources for thought leadership around racial equality in America across economics, employment, education, health, housing, criminal justice and civic participation. Each edition of the State of Black America contains thoughtful commentary and insightful analysis from leading figures and thought leaders in politics, the corporate arena, NGOs, academia and popular culture. The State of Black America also includes the Equality Index, a quantitative tool for tracking racial equality in America, now in its 12th edition of the Black-White Index and its seventh edition of the Hispanic-White Index. The 2016 report features the third edition of the metro Equality Index, ranking approximately 70 metro areas based on unemployment and income equality for Blacks and Hispanics. Included in the 2016 Equality Index is a special 40-year retrospective to commemorate the publication of the National Urban League’s first State of Black America report in 1976 and compare key Black- White Equality Index numbers over time. The complete 2016 State of Black America report, including full data sets, ranking lists and articles, is available at www.stateofblackamerica.org. FIGURE 1 2016 Black–White Equality Index is 72.2% 72.2% BLACK 100% WHITE 30% 10% 10% 25% FIGURE 2 Different Categories that Make Up the Equality Index Economics 30% Health 25% Education 25% Social Justice 10% Civic Engagement 10% 25% The complete 2016 State of Black America report, including full data sets, ranking lists and articles is available at www.stateofblackamerica.org. About the State of Black America 4 WHY DO WE PUBLISH AN EQUALITY INDEX? Economic empowerment is the central theme of the National Urban League’s mission. The Equality Index gives us a way to document progress towards this mission. THE 2016 EQUALITY INDEX OF BLACK AMERICA IS 72.2%. WHAT DOES THAT MEAN? That means that rather than having a whole pie (100%), which would mean full equality with whites in 2016, African Americans are missing about 28% of the pie (Figure 1). Similarly, a Hispanic Index of 77.8% indicates that more than 20% of the pie is missing for Hispanics. WHAT IS THE EQUALITY INDEX TRYING TO DO? Imagine if we were to summarize how well African Americans and Hispanics are doing compared to whites in the areas of economics, health, education, social justice and civic engagement, and represent that by a pie. The Equality Index measures the share of the pie that African Americans and Hispanics get. Whites are used as the benchmark because the history of race in America has created advantages for whites that continue to persist in many of the outcomes being measured. Each category is weighted, based on the importance that we give to each (Figure 2). IS IT POSSIBLE TO SEE HOW WELL AFRICAN AMERICANS AND LATINOS ARE DOING IN EACH OF THE CATEGORIES? Yes. We show this in the tables included with the Equality Index. Each category can be represented by a mini-pie and interpreted in the same way as the total Equality Index. So, the index of 56.2% for the economics category for African Americans in 2016 means that African Americans are missing close to half of the economics mini-pie. IT DOESN’T APPEAR THERE’S BEEN MUCH IMPROVEMENT IN THE EQUALITY INDEX—WHAT’S THE POINT? The Equality Index is composed of many parts, so improvements in one area are sometimes offset by losses in another area, leaving the overall index unchanged. The Equality Index offers solid evidence of how slowly change happens, and highlights the need for policies that fight inequality.
  • 5. As we observe the 40th anniversary of the State of Black America®, the similarities in the nation in 2016 and that which then-National Urban League Executive Director Vernon Jordan documented in 1976 are disheartening. OurnationwasstrugglingtoovercometheworsteconomicdownturnsincetheGreatDepression.Pressurewas buildingtoslashsocialservicesforthepoor,whoweredemonizedandcharacterizedas“chislers.”Communities were rocked by hostility and violence triggered by legal challenges to the social status quo. As with every economic downturn, communities of color bore the brunt of the decline. Black Americans remained nearly twice as likely as whites to be unemployed. Since 1976, the Black unemployment rate has consistentlyremainedabouttwicethatofthewhiterateacrosstime,regardlessofeducationalattainment.The household income gap remains at about 60 cents for every dollar. Black Americans are only slightly less likely today to live in poverty than they were in 1976. Onthecriminaljusticefront,JordannotedthatBlackswereunderrepresentedinlawenforcementin1976.“The City of Chicago is an example: with a population that is 32.7 percent black, it has a police force that is only 16 percent black.” Today, in hundreds of police departments across the nation, the percentage of whites on the force is more than 30 percentage points higher than in the communities they serve. “The urgency of the problems that grip the American people allow no time for delay or for half-way measures,” Jordan observed. There have been times when Americans have met our shared challenges – as well as those of the international community – with full-measured urgency. When Europe found itself in physical and economic ruin after World WarII,theUnitedStatesinvested$13billion(orwhatwouldbeapproximately$130billiontoday)tohelprebuild Western European economies through the European Recovery Program, more commonly known as the Marshall Plan. The Marshall Plan ushered a dramatic increase in economic growth in European history. Though theplanofficiallyendedin1953,theunprecedentedeconomicgrowthitsparkedcontinuedovertwodecades. Former National Urban League President John Jacob introduced the concept of an urban Marshall Plan for America in the 15th State of Black America® in 1990. At the time, he said the nation should commit itself to completing “our unfinished revolution for democracy and human rights.” Dear Mr./Madame President, that revolution remains unfinished. BOOK EXCERPT NATIONAL URBAN LEAGUE 5
  • 6. 6 Read Marc’s full article in the 2016 State of Black America online at www.stateofblackamerica.org. Since 2006, the United States has spent nearly $50 billion rebuilding Afghanistan through the Afghanistan Infrastructure Rehabilitation Program. The Troubled Asset Relief Program (TARP), signed into law by President George W. Bush in 2008, infused the nation’s faltering financial institutions with investments of more than $400 billion. Whether we call it “recovery,” “rehabilitation” or “relief,” it is time for America to demonstratethatverysamecommitmenttoourownstrugglingurbanfamiliesandcommunities.Thenecessityisaspowerful and compelling as it was for Europe, Afghanistan or Wall Street. That is why, with this milestone 40th Anniversary State of Black America®, the National Urban League proposes a sweeping and decisive solution to the nation’s persistent social and economic disparities. We call it the Main Street Marshall Plan: Moving from Poverty to Prosperity. This bold and strategic investment in America’s urban communities requires a multi-annual and multi-pronged commitment of $1 trillion over the next 5 years that would course correct our main streets. Our nation needs investments in: • Universal early childhood education • A federal living wage of $15 per hour, indexed to inflation • A plan to fund comprehensive urban infrastructure • A new Main Street small- and micro-business financing plan focusing on minority-and-women-owned businesses • Expansion of summer youth employment programs • Expanded homeownership strategies • Expansion of the Earned Income Tax Credit (EITC) • Targeted re-entry workforce training programs administered through community-based organizations • Doubling the Pell Grant program to make college more affordable • Expansion of financial literacy and homebuyer education and counseling • Expansion of the low-income housing voucher “Section 8” program • Establishment of Green Empowerment Zones in neighborhoods with high unemployment • Affordable high-speed broadband and technology for all • Increased federal funding to local school districts to help eliminate resource equity gaps As America’s urban communities continue to struggle in the slow rebound from the Great Recession, we can expedite the recovery by taking a lesson from the pages of our history books and similarly focusing our efforts with great vision and purpose-filled ambition. Our economy and infrastructure have been shattered, not by bombs and tanks, but by malfeasance and indifference. Under President Obama, the nation has made great strides in stabilizing the economy. In eight years, America has gone from losing hundreds of thousands of jobs per month to 73 consecutive months of job growth. During President Obama’s term, the private sector has added 14.4 million new jobs, and the Economic Recovery and Reinvestment Act is widely credited with protecting the nation from a second Great Depression. However, much more remains to be done. The benefits of the recovery have not reached the Main Streets of our most troubled communities.Wecannotcontinuetorelyonpoliciesthathaveprovenineffectiveincommunitieswithhighunemploymentandlow income. You see, we are not asking for a new deal; we are demanding a better deal. As a nation, we must focus our resources and efforts on the neighborhoods where they are most needed. Vernon Jordan realized in 1976 that it was incumbent upon the National Urban League to confront the problems that Washington refused to acknowledge. Forty years later, we continue on that path to progress – with a clear purpose and an even clearer plan. 2016 STATE OF BLACK AMERICA© LOCKED OUT
  • 7. 7 NATIONAL URBAN LEAGUE Overview of 2016 National Urban League Equality Index™ As President Obama wraps up the final months of his second term as the nation’s first African-American president, many will begin to assess the progress the nation has made under his administration, and more specifically, the progress that Black America has made. In making these critical assessments, we must also consider which presidential candidate is best suited to meet the challenges and seize the opportunities that lie ahead for the United States. How well has the nation recovered from the worst economic crisis it has seen in generations? How much closer to the goal of universal healthcare coverage has the Affordable Care Act – or Obamacare – gotten us? Have racial justice and overall race relations worsened or improved over the last eight years? Will the next policy era be one that reduces or exacerbates decades of growing income and wealth inequality? The 2016 National Urban League Equality Index tells an all too familiar story of persistent racial disparities in American life, making clear that the historic Obama presidency has not been a panacea for America’s long-standing race problem. BLACK–WHITE The 2016 Equality Index of Black America stands at 72.2 percent compared to a revised 2015 index of 72.0 percent. Revisions to the previous year’s index are done for greater comparability across years and reflect data points that have been corrected, removed from the current year’s index or re-weighted so that less emphasis is placed on older data. The largest increase in this year’s index was in the area of education (from 76.1% to 77.4%), with smaller increases in economics (from 55.5% to 56.2%) and social justice (60.6% to 60.8%). The civic engagement index declined sharply over the last year (from 104.0% to 100.6%) while the health index (from 79.6% to 79.4%) declined slightly. The increase in the education index was the result of improvements in college attainment and enrollment. The increase in the economics index came primarily through progress in closing the digital divide as well as lower denial rates for African Americans seeking mortgage and home improvement loans. The unemployment and homeownership gaps remained unchanged from the previous year. The improvements in the social justice index resulted from a decline in the Black incarceration rate, while the percent of whites placed in prison following an arrest grew by more than the rate for Blacks. The large drop in the civic engagement index resulted from the typical declines in voter registration and participation that are characteristic of mid- term election years. HISPANIC–WHITE The 2016 Equality Index of Hispanic America stands at 77.8 percent compared to a revised 2015 index of 77.3 percent. The increase in the Hispanic-White Index resulted from a major improvement in the social justice index (from 66.6% to 75.9%) and smaller gain in the economics index (from 60.8% to 61.8%) that helped to offset losses in all other categories. The greatest losses were in civic engagement (from 71.0% to 67.6%), followed by health (from 106.8% to 105.5%), and education (from 74.6% to 74.2%). The large increase in the social justice index was the result of improvements on nearly every measure of social justice used to calculate the Equality Index. Similar to the trends in the Equality Index of Black America, the increase in the economics index came from a smaller digital divide and fewer mortgage and home improvement loan denials. The increase in the health index was a result of lower death rates among Hispanics and increased health care coverage since the Affordable Care Act went into effect. On the other hand, Hispanic voter registration and participation dropped sharply during the mid-term elections in 2014 (latest data available), resulting in a decline in the civic engagement index. While the Hispanic-White health index remains above 100 percent and rates of uninsurance are falling among all groups, declining index values reflect faster health insurance take-up rates among whites than Latinos. REVISED 2015 2016 EQUALITY INDEX 72.0% 72.2% Economics 55.5% 56.2% Health 79.6% 79.4% Education 76.1% 77.4% Social Justice 60.6% 60.8% Civic Engagement 104.0% 100.6% EQUALITY INDEX OF BLACK AMERICA, 2015–2016 ■ Revised 2015 ■ 2016 120% 100% 80% 60% 40% 20% 0% Total Econom ics Health EducationSocialJustice CivicEngagem ent REVISED 2015 2016 EQUALITY INDEX 77.3% 77.8% Economics 60.8% 61.8% Health 106.8% 105.5% Education 74.6% 74.2% Social Justice 66.6% 75.9% Civic Engagement 71.0% 67.6% EQUALITY INDEX OF HISPANIC AMERICA, 2015–2016 ■ Revised 2015 ■ 2016 120% 100% 80% 60% 40% 20% 0% Total Econom ics Health EducationSocialJustice CivicEngagem ent
  • 8. 8 2015 STATE OF BLACK AMERICA¨ LOCKED OUT Two years ago, the National Urban League introduced rankings of unemployment and income equality between whites, Blacks and Latinos in the nation’s largest metropolitan areas. Comparison of the 2015 and 2016 Metro Unemployment Equality Index ranking reveals that there was significant shuffling of metros at the top of the list. In both the Black-White and Hispanic-White rankings, only three of the cities in last year’s top 10 were also in this year’s top 10. On the other hand, many of the metros at the bottom of last year’s rankings remained at the bottom of this year’s rankings as well. These patterns seem to represent differences in the pace of recovery across the country as metros at the top of the list averaged larger improvements in unemployment rates than those at the bottom of the list, especially among Blacks and Latinos. The tables herein highlight major cities, as well as the most and least equal metropolitan areas and those with highest and lowest unemployment. The full list of Black-White and Hispanic-White 2016 Metro Unemployment Equality Index rankings, complete with a comparison to 2015, can be found in additional tables on www.stateofblackamerica.org. BLACK–WHITE UNEMPLOYMENT EQUALITY With an index of 68.7 percent, the Providence-Warwick, RI-MA metro area once again tops the list as the metro area with the smallest Black-White unemployment gap. The Black unemployment rate in Providence was 9.9 percent (down 3.1 percentage points) and the white rate was 6.8 percent (down 1.7 percentage points). With an index of 67 percent, this year’s second most equal metro area, Chattanooga, TN-GA, is up from #51 last year, reflecting a decline of more than six percentage points in the area’s Black unemployment rate, while the white rate was virtually unchanged. Similar to the 2015 rankings, the 2016 rankings reveal that metros with the greatest unemployment equality are not necessarily the metros with the best employment outcomes for either group. The metros with the lowest unemployment rate for Blacks (8.3%) were San Antonio-New Braunfels, TX and Oklahoma City, OK, #6 in the equality ranking. The metro with the lowest white unemployment rate (3.7%) was Jackson, MS, #65 in the equality ranking. The metro with the highest Black unemployment rate (20%) was Cleveland-Elyria, OH, #69 in the equality ranking. Riverside-San Bernardino- Ontario, CA registered the highest white unemployment rate (9.7%) and came in at #5 in the equality ranking. HISPANIC–WHITE UNEMPLOYMENT EQUALITY With an index of 103.6 percent, Indianapolis-Carmel-Anderson, IN topped the Hispanic-White metro unemployment rankings this year. Indianapolis was #2 last year behind Deltona-Daytona Beach-Ormond Beach, FL, which fell to #49 this year. While there were a total of five metros in the 2015 Index with a Hispanic-White unemployment index greater than 100 -- indicating that the Hispanic unemployment rate was lower than the white unemployment – Indianapolis was the only metro with that distinction in this year’s index. Since unemployment disparities between Latinos and whites have narrowed more than those between Blacks and whites during the recovery, lower unemployment rates and greater unemployment equality seemed to be more closely linked. The metro with the lowest Hispanic unemployment rate (4.6%) was Tulsa, OK, #4 in the ranking. The metro with the highest Hispanic unemployment rate (21.5%) was Springfield, MA at #72 in the ranking. NOTES 1 The unemployment and income data used for the Metro Index rankings comes from the American Community Survey (ACS). The 2016 Metro Index is based on data from the 2014 ACS (most recent) and the 2015 Metro Index is based on data from 2013 ACS. 2016 Metropolitan Unemployment Equality Index™
  • 9. 9 NATIONAL URBAN LEAGUE Providence–Warwick, RI–MA 1 9.9 6.8 68.7% 1 13 8.5 65% San Antonio-New Braunfels, TX 6 8.3 4.9 59.0% 49 11.1 4.5 41% Oklahoma City, OK 7 8.3 4.9 59.0% 30 9.9 4.6 46% Dallas-Fort Worth-Arlington, TX 20 10 4.9 49.0% 34 11.7 5.4 46% Virginia Beach-Norfolk-Newport News, VA-NC 21 11.3 5.5 48.7% 48 12.7 5.3 42% New York-Newark-Jersey City, NY-NJ-PA 24 12 5.7 47.5% 24 14.2 6.7 47% Miami-Fort Lauderdale-West Palm Beach, FL 25 13.5 6.4 47.4% 27 16 7.5 47% Los Angeles-Long Beach-Anaheim, CA 26 14.4 6.8 47.2% 33 17.3 8 46% Houston-The Woodlands-Sugar Land, TX 29 9.3 4.3 46.2% 52 12.6 5 40% Boston-Cambridge-Newton, MA-NH 32 11.4 5.2 45.6% 32 13.4 6.2 46% Charlotte-Concord-Gastonia, NC-SC 33 14.7 6.7 45.6% 43 16.5 7.1 43% Atlanta-Sandy Springs-Roswell, GA 36 12.4 5.5 44.4% 36 14.8 6.8 46% Philadelphia-Camden-Wilmington, PA-NJ-DE-MD 46 14.9 5.9 39.6% 28 16 7.5 47% Washington-Arlington-Alexandria, DC-VA-MD-WV 47 10.9 4.3 39.4% 54 11.5 4.5 39% St. Louis, MO-IL 50 14.5 5.6 38.6% 59 17.2 6.1 35% New Orleans-Metairie, LA 54 12.6 4.8 38.1% 26 13 6.1 47% Baltimore-Columbia-Towson, MD 55 12.4 4.5 36.3% 42 11.9 5.4 45% Detroit-Warren-Dearborn, MI 59 17.9 6.4 35.8% 55 20.3 7.6 37% Chicago-Naperville-Elgin, IL-IN-WI 65 18.6 5.8 31.2% 65 21.4 6.8 32% Cleveland-Elyria, OH 69 20 5.4 27.0% 68 20.4 6 29% Milwaukee-Waukesha-West Allis, WI 70 17.3 4.3 24.9% 69 17.6 5.1 29% SELECT METROS FROM 2016 2016 Rank Black Rate* White Rate* Black–WhiteIndex 2015 Rank Black White Index SELECT METROS FROM 2016 2016 Rank Hispanic Rate* White Rate* Hispanic–WhiteIndex 2015 Rank Hispanic White Index 2016 METRO AREAS UNEMPLOYMENT EQUALITY 2016 METRO AREAS UNEMPLOYMENT EQUALITY Black–White Hispanic–White Indianapolis-Carmel-Anderson, IN 1 5.5 5.7 103.6% 2 5.3 6.7 126% Tulsa, OK 4 4.6 4.3 93.5% 46 8.1 5.3 65% Miami-Fort Lauderdale-West Palm Beach, FL 6 7.1 6.4 90.1% 20 9.4 7.5 80% El Paso, TX 9 8.1 7 86.4% 8 8.7 8.2 94% Dallas-Fort Worth-Arlington, TX 16 6 4.9 81.7% 24 7 5.4 77% Phoenix-Mesa-Scottsdale, AZ 18 7.5 6.1 81.3% 41 9.4 6.4 68% Riverside-San Bernardino-Ontario, CA 20 12.2 9.7 79.5% 18 13.5 10.8 80% Los Angeles-Long Beach-Anaheim, CA 24 8.9 6.8 76.4% 26 10.7 8 75% Houston-The Woodlands-Sugar Land, TX 26 5.7 4.3 75.4% 28 6.8 5 74% San Francisco-Oakland-Hayward, CA 32 7 5.1 72.9% 38 9 6.2 69% San Jose-Sunnyvale-Santa Clara, CA 33 8.1 5.9 72.8% 64 11.3 6 53% San Antonio-New Braunfels, TX 37 7.1 4.9 69.0% 61 7.9 4.5 57% Washington-Arlington-Alexandria, DC-VA-MD-WV 39 6.3 4.3 68.3% 44 6.8 4.5 66% New York-Newark-Jersey City, NY-NJ-PA 41 8.4 5.7 67.9% 51 10.8 6.7 62% Chicago-Naperville-Elgin, IL-IN-WI 42 8.6 5.8 67.4% 49 10.6 6.8 64% Denver-Aurora-Lakewood, CO 44 5.9 3.9 66.1% 53 9.1 5.6 62% San Diego-Carlsbad, CA 48 9.8 6.1 62.2% 22 10 7.9 79% Albuquerque, NM 51 10.5 6.4 61.0% 48 9.3 6 65% Philadelphia-Camden-Wilmington, PA-NJ-DE-MD 65 12.1 5.9 48.8% 56 12.4 7.5 60% Springfield, MA 72 21.5 6.3 29.3% 70 17.7 7.4 42% * 2013 Unemployment Rate
  • 10. 10 2015 STATE OF BLACK AMERICA¨ LOCKED OUT Unlike the Black-White unemployment equality rankings, the Black-White Income Equality Index rankings were relatively stable between 2015 and 2016. Six of last year’s top 10 metros were again in the top 10 this year. In the Hispanic-White rankings, seven of last year’s top 10 appear at the top of this year’s list. The tables herein highlight major cities, as well as the most and least equal metropolitan areas and those with highest and lowest median household income. The full list of Black-White and Hispanic-White 2016 Metro Income Equality Index rankings, complete with a comparison to 2015, can be found in additional tables on www.stateofblackamerica.org. BLACK–WHITE INCOME EQUALITY Riverside-San Bernardino-Ontario, CA remained at the top of the Black-White Income Equality ranking this year, with the median Black household having 76 cents for every dollar of median white household income. In Riverside, Black household income rose 6.8 percent year-over-year while whites saw a decline of 1.1 percent. Black and white incomes were least equal in Minneapolis-St. Paul-Bloomington, MN-WI where the gap was 38 cents on the dollar. Minneapolis replaces San Francisco-Oakland-Hayward, CA as the metro where Black and white incomes were least equal. In Minneapolis, the median household income for Blacks was $28,138 (down 12.7% from last year’s Index) compared to $74,455 for whites (up 1.7% from last year’s Index). The highest median household income for both Blacks ($66,151) and whites ($109,460) was in Washington-Arlington-Alexandria, DC-VA-MD-WV, #18 in the ranking. The lowest median Black household income ($22,386) was in Toledo, OH (#64 in the ranking). Even though Toledo had one of the lowest median white household incomes in the country, white household income in Toledo was still more than double Black household income. Toledo, OH also had the fourth highest Black unemployment rate, which would at least partly account for the low income of Black households. The lowest median white household income for whites ($47,208) was in Lakeland-Winter Haven, FL. HISPANIC–WHITE INCOME EQUALITY For Latinos, median household incomes were closest to those of whites in Urban Honolulu, HI which was up from #7 in last year’s ranking as a result of three percent income growth for Latinos and 1.3 percent growth for whites. In Urban Honolulu, the median Hispanic household had 80 cents for every dollar of median white household income. Hispanic and white incomes were least equal in Springfield, MA where the gap was 40 cents on the dollar. In Springfield, the median household income for Latinos was $23,911 (down 5.1% from the 2015 index), compared to $60,105 for whites (down 2.3%). As was the case for Blacks and whites, the highest median Hispanic household income was in Washington-Arlington-Alexandria, DC-VA-MD- WV ($66,523), #50 in the equality ranking. The lowest median Hispanic household income was in Springfield, MA ($23,911), #72 in the equality ranking. 2016 Metropolitan Income Equality Index™
  • 11. 11 NATIONAL URBAN LEAGUE Riverside-San Bernardino-Ontario, CA 1 46,438 60,668 76.5% 1 43,482 61,364 71% Atlanta-Sandy Springs-Roswell, GA 15 42,954 69,485 61.8% 17 42,557 69,718 61% Miami-Fort Lauderdale-West Palm Beach, FL 17 36,840 60,785 60.6% 10 37,473 59,632 63% Washington-Arlington-Alexandria, DC-VA- MD-WV 18 66,151 109,460 60.4% 21 65,721 110,026 60% Charlotte-Concord-Gastonia, NC-SC 19 37,559 62,485 60.1% 11 37,230 59,497 63% Virginia Beach-Norfolk-Newport News, VA-NC 26 40,230 69,288 58.1% 13 41,231 66,547 62% Baltimore-Columbia-Towson, MD 30 47,540 83,200 57.1% 22 48,650 81,892 59% Dallas-Fort Worth-Arlington, TX 32 40,859 73,595 55.5% 35 40,917 72,584 56% Houston-The Woodlands-Sugar Land, TX 37 43,362 80,351 54.0% 44 41,334 78,032 53% Boston-Cambridge-Newton, MA-NH 38 44,408 82,903 53.6% 19 49,117 81,005 61% New York-Newark-Jersey City, NY-NJ-PA 40 45,493 85,819 53.0% 45 44,879 84,823 53% Los Angeles-Long Beach-Anaheim, CA 47 40,883 78,973 51.8% 43 41,534 78,396 53% Detroit-Warren-Dearborn, MI 53 30,946 61,205 50.6% 55 30,646 61,062 50% Philadelphia-Camden-Wilmington, PA-NJ-DE-MD 57 36,496 74,615 48.9% 50 37,404 73,093 51% New Orleans-Metairie, LA 58 30,088 61,729 48.7% 61 28,350 61,053 46% Chicago-Naperville-Elgin, IL-IN-WI 62 35,169 74,759 47.0% 58 34,882 73,087 48% Toledo, OH 64 22,386 50,792 44.1% 67 22,054 50,141 44% Cleveland-Elyria, OH 67 25,439 58,394 43.6% 60 27,063 58,043 47% St. Louis, MO-IL 52 31,751 62,622 50.7% 52 31,725 62,257 51% Minneapolis-St. Paul-Bloomington, MN-WI 70 28,138 74,455 37.8% 66 32,232 73,193 44% Urban Honolulu, HI 1 63,815 79,299 80.5% 7 61,960 78,299 79% Riverside-San Bernardino-Ontario, CA 2 48,790 60,668 80.4% 8 47,969 61,364 78% Albuquerque, NM 12 41,363 54,917 75.3% 18 40,578 57,408 71% Miami-Fort Lauderdale-West Palm Beach, FL 21 42,814 60,785 70.4% 17 42,227 59,632 71% New Orleans-Metairie, LA 26 42,366 61,729 68.6% 11 46,901 61,053 77% Phoenix-Mesa-Scottsdale, AZ 29 40,454 60,233 67.2% 33 39,338 59,550 66% El Paso, TX 35 36,197 55,669 65.0% 22 36,179 52,443 69% Chicago-Naperville-Elgin, IL-IN-WI 37 48,178 74,759 64.4% 43 46,091 73,087 63% San Antonio-New Braunfels, TX 40 42,994 67,352 63.8% 38 43,071 66,506 65% San Diego-Carlsbad, CA 41 47,802 75,368 63.4% 29 47,642 71,453 67% Denver-Aurora-Lakewood, CO 43 47,124 74,882 62.9% 48 42,760 71,749 60% San Jose-Sunnyvale-Santa Clara, CA 46 64,198 104,398 61.5% 52 60,118 101,923 59% San Francisco-Oakland-Hayward, CA 47 61,290 100,172 61.2% 51 57,190 96,845 59% Washington-Arlington-Alexandria, DC-VA- MD-WV 50 66,523 109,460 60.8% 47 66,812 110,026 61% Los Angeles-Long Beach-Anaheim, CA 53 46,782 78,973 59.2% 53 45,942 78,396 59% Dallas-Fort Worth-Arlington, TX 55 43,409 73,595 59.0% 54 42,303 72,584 58% Houston-The Woodlands-Sugar Land, TX 60 44,491 80,351 55.4% 58 43,724 78,032 56% Philadelphia-Camden-Wilmington, PA-NJ-DE-MD 63 39,175 74,615 52.5% 62 36,960 73,093 51% New York-Newark-Jersey City, NY-NJ-PA 65 43,455 85,819 50.6% 61 43,685 84,823 52% Springfield, MA 72 23,911 60,105 39.8% 71 25,187 61,495 41% SELECT METROS FROM 2016 2016 Rank Black Income, Dollars* White Income, Dollars* Black–WhiteIndex 2015 Rank Black White Index Hispanic–White 2016 METRO AREAS INCOME EQUALITY 2016 METRO AREAS INCOME EQUALITY Black–White * Median Household Income, 2014 Dollars SELECT METROS FROM 2016 2016 Rank Hispanic Income, Dollars* White Income, Dollars* Hispanic–WhiteIndex 2015 Rank Hispanic White Index
  • 12. 12 2016 STATE OF BLACK AMERICA© LOCKED OUT
  • 13. 13 NATIONAL URBAN LEAGUE Forty years ago – on February 2, 1976 – The New York Times wrote an article titled “Distress Signal,” which reported on the first edition of the National Urban League’s State of Black America® report, noting: “The report on the state of black America released last week by the National Urban League is a profoundly depressing document. Beyond the statistics it contains – gloomy enough by themselves – the report dramatizes a substantial failure of political leadership. Vernon Jordan, Jr., the league’s executive director, noted that the State of the Union Message by President Ford omitted all mention of the plight of black Americans while Senator Edmund S. Muskie in his reply on behalf of the Democrats, omitted the promise of racial equality from his list of endangered American promises. The report is replete with facts backing up the league’s conclusion that no recent year ‘has been more destructive to the progress of blacks than 1975.’ …the message is clear. In aspects of life that can be measured statistically, the gains made in the sixties by America’s largest minority group have been decimated. And in intangible terms – those relating to the demands for equality urged on the nation’s conscience by its leaders – all gears have been thrown into reverse. Inadditiontothemoralfailuresthisreportunderscores–whichbythemselves are highly significant – it dramatizes unwholesome and even frightening social policy trends. Such severe distress in any single segment of society is bound to have large consequences throughout all of American life. Nothing demonstrates this quite so well as the current precarious financial plight of so many of the nation’s cities. In the end, then, the conditions described by the Urban League constitute a substantial challenge to the country’s political leadership, not simply to redeem a central aspect of American idealism, but to reverse a dangerous disintegration in the social fabric of the entire nation.” This year, as the National Urban League celebrates the 40th anniversary of the State of BlackAmericareport,itcontinuestointerjectseriousconsiderationofthesocial,economic and political issues facing African Americans into the national discourse. While aggregate improvements can be noted across the board for Blacks and whites, unfortunately the findings tell a clear story that significant disparities remain and have not been resolved by any gains, particularly in income and employment. 40 Years: The State of Black America
  • 14. 14 2015 STATE OF BLACK AMERICA¨ LOCKED OUT In 1976, schools had been legally desegregated for 22 years, the Civil Rights Act of 1964 was 12 years old, the Voting Rights Act of 1965 had been in place 11 years, and the economy was one year into economic recovery from the recession that lasted from November 1973 to March 1975. Still, Blacks were nearly twice as likely as whites to be unemployed; the median Black household had only 59 cents for every dollar of income in the median white household; and African Americans were three times more likely to live in poverty than whites. While these racial disparities continued to persist more than a decade after several pieces of landmark equal rights legislation had passed, that’s not to say there had been no progress. The State of Black America 2013 presented a 50-year retrospective on the March on Washington for Jobs and Freedom – one year before the Civil Rights Act of 1964 was signed into law -- which is a useful point of comparison. Between 1963 and 1976, Blacks experienced tremendous gains in school enrollment and educational attainment. In 1963, only one-quarter of Black adults had completed high school. By 1976, that number had grown to 43.8 percent. At the college level, there were more than twice as many Black 18-24 year olds enrolled in college in 1976 than in 1963. The standard of living for Black Americans had also risen over that 13-year period. Despite the fact that the Black poverty rate was three times the white rate both in 1963 and 1976, poverty rates for both groups had fallen significantly over that time (down 21.6 and 6.2 percentage points for Blacks and whites, respectively). By 1976, the Black-White income gap had closed 6 percentage points (from 53% in 1963), and the homeownership gap had closed 10 percentage points (from 55% in 1963 to 65% in 1976). Since 1976, educational progress has continued. Eighty-six percent of African Americans are high school completers; the share with a bachelor’s degree or more has more than tripled (from 6.6% to 22.2%); and roughly one-third of 18-24 year-olds are enrolled in college. While whites have increased college enrollment faster than Blacks between 1976 and 2014 (most recent data available), the college completion gap has narrowed 20 percentage points over this time (from 43% in 1976 to 63% in 2014). However, despite notable absolute progress for Black America, there has been much less relative progress towards economic equality with whites, especially when compared to the progress made toward educational equality. This is especially notable when it comes to unemployment. With few exceptions, the Black unemployment rate has consistently remained about twice the white rate across time and at every level of education. Compared to 40 years ago, the income gap has remained basically unchanged (now at 60%), and the homeownership rate gap has actually grown six percentage points (now at 59%). The foreclosure crisis has left Black homeownership rates at approximately the same point they were in 1976, while the white homeownership rate is now five percentage points higher. On the other hand, there has been slow, but ongoing progress in reducing poverty, in spite of the economic challenges presented by the Great Recession. According to the most recent estimates, the Black poverty rate is now 2.4 percentage points lower than in 1976 (down to 27% from 29.4%). Finally, in an election year, progress in voter participation is mixed. While the percentages of Blacks and whites who actually voted in the last election are both much lower than the percentages in 1976, this is partly due to the fact that these data are comparing a presidential election year (1976) with a non-presidential election year (2014). Voter participation drops considerably in mid-term election years. However, even with this decline in participation, that gap between Blacks and whites has narrowed seven percentage points, suggesting that Black civic engagement has declined by less than that of whites. “Such severe distress in any single segment of society is bound to have large consequences throughout all of American life.”
  • 15. 15 NATIONAL URBAN LEAGUE Median Income Median Household Income (Real), Dollars $9,242 $15,537 59% $35,481 $59,622 60% Poverty Population Living Below Poverty Line 29.4% 9.1% 31% 27.0% 10.8% 40% Employment Issues Unemployment Rate 13.2% 7.0% 53% 9.6% 4.6% 48% Housing Wealth Home Ownership Rate, (1) 43.7% 67.6% 65% 43% 72.6% 59% Transportation Car Ownership, % (1) 54 84.6 64% 70.5 88.3 80% Life Expectancy Life Expectancy at Birth 68.3 73.5 93% 75.1 78.9 95% Democratic Process Actually voted, % of citizen population 48.7% 60.9% 80% 39.7% 45.8% 87% Attainment (25 years and older) High School Graduate Some College Bachelor’s Degree or more 28.2% 9.0% 6.6% 37.3% 13.5% 15.4% 76% 67% 43% 33.4% 24.3% 22.2% 29.7% 27.8% 35.6% 112% 87% 63% ECONOMICS Black White Index Black White Index EDUCATION HEALTH CIVIC ENGAGEMENT Table 1 1976(1) Present 40 YEAR COMPARISON Then Now (1) All 1976 data (except Car Ownership data) from the Census’ 1977 and 1978 Statistical Abstracts
  • 16. 16 2015 STATE OF BLACK AMERICA¨ LOCKED OUT Access the full articles and additional contributors at www.stateofblackamerica.org.
  • 17. 17 NATIONAL URBAN LEAGUE FROM WHERE DO WE GO FROM HERE: AMERICA AFTER OBAMA BY JOY-ANN REID, JOURNALIST AND AUTHOR; NATIONAL CORRESPONDENT, MSNBC FROM CELEBRATING THE 40TH ANNIVERSARY OF THE STATE OF BLACK AMERICA® BY MICHAEL NEIDORFF, CHAIRMAN, PRESIDENT AND CHIEF EXECUTIVE OFFICER, CENTENE CORPORATION AND CHAIRMAN OF THE BOARD, NATIONAL URBAN LEAGUE “The next president is likely to face a much more “radical ask” from Black America on economic development, educational progress and political opportunity. Questions like: where are the Black governors, senators and other statewide officials in development by the Democratic Party and why there isn’t a more robust Black leadership class among Republicans, not to mention the potential for one to three open seats on the Supreme Court, are likely to move to the front burner as the political season wears on and a new president is sworn in. Whether the next president is a Democrat or Republican, Black leadership will likely be pressed as never before to deliver on the “hope floor” laid by the election of the first Black president…In short, the Age of Hope is poised to give way to the Era of Radical Demands for Change.” “Economic indicators and experts agree that our country continues to make progress since the Great Recession, but for many African Americans and others in urban and low-income communities, wide gaps of inequality in income, housing and education remain….Through innovation, investment and creativity, businesses have the opportunity to contribute to the resolution of social and economic disparities. Businesses are particularly well suited to facilitate transformative partnerships between the public, private and social sectors and be a catalyst for positive social change…one business at a time, one community at a time. The business sector must take the lead in creating stronger, more economically viable and healthier communities across this nation. I invite each of you to use this 40th anniversary edition of the State of Black America and the recommendations found throughout as a catalyst to build thoughtful solutions in support of your communities.” FROM LIFTING URBAN AMERICA UP: THE URBAN PROGRESS INITIATIVE BY CONGRESSWOMAN ROBIN L. KELLY, ILLINOIS - 2ND CONGRESSIONAL DISTRICT FROM THE FIGHT FOR EQUITY IN EDUCATION BY ALLAN GOLSTON, PRESIDENT, U.S. PROGRAM – BILL MELINDA GATES FOUNDATION “Today, more than ever before, education doesn’t end with high school. A postsecondary degree or credential offers the surest course to career opportunity and individual success in life. We need to make college more personalized and flexible to meet the needs of today’s students, who are more diverse than ever. Many are working full-time, while others are raising kids or returning to school at an older age….We cannot accept the status quo. It is time to look closely at approaches suggested by the data, listen to families and commit to implementing real solutions in our schools and communities…we are committed to addressing inequity and achievement gaps, including looking more closely at how to get students started on the right path through early learning opportunities, because we believe that every person deserves the chance to live a healthy and productive life. We believe the fight for equity is one that all Americans should join.” “With shootings and killings on pace to reach historic levels in 2016, Chicago has become the unfortunate epicenter of our nation’s gun violence epidemic. But what is often obscured by the headlines is the root cause of the problem. The gun violence in Chicago and cities like it are but a symptom of a much larger, systemic ailment afflicting urban America: hopelessness. The lack of economic opportunity in urban America creates a malaise that depresses communities and clouds the outlook of those who live there…. As a member of Congress representing some of our nation’s most underserved, violence-plagued communities, I’ve seen first-hand the transformative power of economic opportunity. By giving our young people greater access to a quality education and gainful employment, we absolutely can break the cycle of violence gripping our communities. Nothing stops a bullet like a job.” FROM RELIEVING THE PLIGHT OF BLACK MALE UNEMPLOYMENT BY MICHAEL P. MCMILLAN, PRESIDENT CHIEF EXECUTIVE OFFICER, URBAN LEAGUE OF METROPOLITAN ST. LOUIS FROM IF WE WANT CHANGE, WE MUST RAISE OUR VOICES BY U.S. SENATOR KIRSTEN GILLIBRAND, NEW YORK “Later this year, millions of Americans will head to the polls to choose our next President. This choice matters. A large segment of our population – including a disproportionate part of the African-American community – continues to face many systemic challenges that shouldn’t still exist in the year 2016, but that just won’t go away: Economic inequality. Voting rights. Gun violence. We should keep all of these challenges in mind as we prepare to vote. To solve them, all of us have a responsibility to raise our voices, speak out against these injustices and go to the polls on Election Day…. We can make our families more stable and more cohesive. We can make it easier for Americans to vote. We can stop the cycle of gun violence. We just need new policies that actually reflect the world we live in today….So if you care about these issues, speak out about them….If enough of us raise our voices, we can change the world.” “In January 2015, the [Save Our Sons Workforce Development Program/ SOS] program began, and since that date, we have helped 200 men find and maintain jobs. SOS offers four major tenets of its four-week workforce education program: (1) how to find a job; (2) how to keep a job; (3) how to get promoted; and (4) how to remain marketable in the workplace. We are proud to report that the program had a 99 percent success rate in 2015 among men who were previously unemployed or underemployed. It is also important to note that 55 percent of our SOS participants had prior felony convictions….While we are thrilled with the success of SOS and other upcoming programs, we believe that programs such as SOS can be scaled across other National Urban League affiliates and across the nation to significantly lower the unemployment rates of Black men in our communities and strengthen African-American families as a whole.”
  • 18. 18 2015 STATE OF BLACK AMERICA¨ LOCKED OUT Publisher Marc H. Morial Editorial Director Latraviette D. Smith-Wilson Executive Editor Shu-Fy Pongnon Senior Editor Simone Jordan Creative Director Rhonda Spears Bell Graphic Design Dionte Noble Cover Illustration Untuck Design FROM THE INEXTRICABLE LINK BETWEEN TRANSPORTATION AND OPPORTUNITY BY STEPHANIE JONES, SENIOR COUNSELOR TO THE SECRETARY AND CHIEF OPPORTUNITIES OFFICER, U.S. DEPT. OF TRANSPORTATION “Transportation not only connects us to the places we need to go, it also helps to invigorate opportunity within a community. The bottom line is this: without transportation, there is no opportunity. Being able to move freely is essential to exercising one’s full rights of citizenship. Did you know transportation underpinned much of the Civil Rights Movement? Plessy v. Ferguson, the Montgomery Bus Boycott, and the Freedom Rides all centered on the intersection of transportation and civil rights. It is no coincidence that just two years after the 1964 Civil Rights Act was enacted, President Lyndon Johnson signed the act creating the Department of Transportation....As the first Chief Opportunities Officer in the federal government, it is my mission each day to think about how the Department’s work can enable all Americans to have access to opportunity….Together, we can work to bridge the divide.” FROM THE CASE FOR INCLUSIVE INNOVATION: MINORITY ENTREPRENEURSHIP AND AMERICA’S ECONOMIC FUTURE BY ALEJANDRA CASTILLO, NATIONAL DIRECTOR, MINORITY BUSINESS DEVELOPMENT AGENCY “As the National Urban League releases this important annual look at opportunity in Black and Latino communities, I’ll make the case for why America is at a major inflection point in terms of minority entrepreneurs. Our nation’s demographic profile is quickly transforming to ‘majority-minority’ status with a plurality of African Americans, Latinos and Asians already comprising majority populations in several U.S. states. This demographic change coincides with yet another major shift, one characterized by the many technological innovations and science-based businesses driving global commerce and education, not to mention a growing millennial generation that is embracing entrepreneurship as part of their DNA. These many factors are leading the way for minority entrepreneurs and minority- owned businesses to position themselves within an eco-system that can create opportunities to diversify into new industries, build capacity and ensure scale, particularly in STEM or technology-based fields.” FROM BREAKING THE WALLS IN BUSINESS: ENTREPRENEURIAL PATHWAYS TO PURPOSE, PROFIT AND PERPETUITY BY RICHELIEU DENNIS, FOUNDER CEO, SUNDIAL BRANDS (MAKERS OF SHEAMOISTURE, NUBIAN HERITAGE AND MADAM C.J. WALKER BEAUTY CULTURE) “We started our company out of a need to survive, but we’ve built it based on a mission not only to help others survive, but to prosper. In fact, we view ourselves as a mission with a business, rather than a business with a mission. Because of that, our purpose – to empower people to live more beautiful lives – sits at the center of everything we do as company and compels us to keep community at our core. This spirit of purpose and empowering those around us led to our purpose-driven business model called Community Commerce, which equips underserved people and communities with access to the opportunities and resources that enable them to create lasting value for themselves and others. It results in an ability to build stronger, self-sustaining communities and enterprises.... Making an impact isn’t just how – but also why – we do business. As such, part of our vision has also always been to build a business and a business model that other minority-owned or under-resourced businesses could be inspired by, learn from and expand upon.” FROM THE MINORITY VOTE AS A MAJORITY FACTOR IN THE 2016 ELECTION BY DR. SILAS LEE, POLLSTER, TRIAL CONSULTANT AND SOCIOLOGIST “For African-American voters, the 2016 presidential election is more than the projection of a four or eight-year agenda. It provides an important opportunity to reassess our position in the political ecosystem. I realize that in today’s instant information society, events are analyzed from a one- dimensional perspective, rather than a multi-dimensional interpretation incorporating the intersection of historical policies on contemporary events. As a pollster and sociologist, I believe we must recognize that if we are going to strategically plan for the future, we must think about building our community infrastructures, coalitions and accountability….When citizens look in the mirror and see their quality of life deteriorating, police brutality in their communities, voter suppression, opposition to equal pay for women, the venom of racism and anti-LGBT legislation, they do not see an inclusive America, but a country blind to their existence and needs. If demographics represent the future of America, the potential of a majority- minority electorate will transform the political and social landscape.”
  • 19. 19 NATIONAL URBAN LEAGUE About the National Urban League The National Urban League (www.nul.org) is a historic civil rights and urban advocacy organization dedicated to economic empowerment in historically underserved urban communities. Founded in 1910 and headquartered in New York City, the National Urban League has improved the lives of tens of millions of people nationwide through direct service programs that are implemented locally by its 88 Urban League affiliates in 36 states and the District of Columbia. The organization also conducts public policy research and advocacy activities from its Washington, D.C. bureau. The National Urban League, a BBB-accredited organization, has a 4-star rating from Charity Navigator, placing it in the top 10 percent of all U.S. charities for adhering to good governance, fiscal responsibility and other best practices. AKRON, OH Akron Urban League ALEXANDRIA, VA Northern Virginia Urban League ALTON, IL Madison County Urban League ATLANTA, GA Urban League of Greater Atlanta AURORA, IL Quad County Urban League AUSTIN, TX Austin Area Urban League BALTIMORE, MD Greater Baltimore Urban League BATTLE CREEK, MI Southwestern Michigan Urban League BINGHAMTON, NY Broome County Urban League BIRMINGHAM, AL Birmingham Urban League BOSTON, MA Urban League of Eastern Massachusetts BUFFALO, NY Buffalo Urban League CANTON, OH Greater Stark County Urban League, Inc. CHARLESTON, SC Charleston Trident Urban League CHARLOTTE, NC Urban League of Central Carolinas, Inc. CHATTANOOGA, TN Urban League Greater Chattanooga, Inc. CHICAGO, IL Chicago Urban League CINCINNATI, OH Urban League of Greater Southwestern Ohio CLEVELAND, OH Urban League of Greater Cleveland COLUMBIA, SC Columbia Urban League COLUMBUS, GA Urban League of Greater Columbus, Inc. COLUMBUS, OH Columbus Urban League DENVER, CO Urban League of Metropolitan Denver DETROIT, MI Urban League of Detroit Southeastern Michigan ELIZABETH, NJ Urban League of Union County ELYRIA, OH Lorain County Urban League ENGLEWOOD, NJ Urban League for Bergen County FARRELL, PA Urban League of Shenango Valley FLINT, MI Urban League of Flint FORT LAUDERDALE, FL Urban League of Broward County FORT WAYNE, IN Fort Wayne Urban League GARY, IN Urban League of Northwest Indiana, Inc. GRAND RAPIDS, MI Grand Rapids Urban League GREENVILLE, SC Urban League of the Upstate, Inc. HARTFORD, CT Urban League of Greater Hartford HEMPSTEAD, NY (LONG ISLAND) Urban League of Long Island HOUSTON, TX Houston Area Urban League INDIANAPOLIS, IN Indianapolis Urban League JACKSONVILLE, FL Jacksonville Urban League JERSEY CITY, NJ Urban League of Hudson County KANSAS CITY, MO Urban League of Kansas City KNOXVILLE, TN Knoxville Area Urban League LAS VEGAS, NV Las Vegas–Clark County Urban League LEXINGTON, KY Urban League of Lexington–Fayette County LOS ANGELES, CA Los Angeles Urban League LOUISVILLE, KY Louisville Urban League MADISON, WI Urban League of Greater Madison MEMPHIS, TN Memphis Urban League MIAMI, FL Urban League of Greater Miami MILWAUKEE, WI Milwaukee Urban League MINNEAPOLIS, MN Minneapolis Urban League MORRISTOWN, NJ Morris County Urban League NASHVILLE, TN Urban League of Middle Tennessee NEW ORLEANS, LA Urban League of Greater New Orleans NEW YORK, NY New York Urban League NEWARK, NJ Urban League of Essex County OKLAHOMA CITY, OK Urban League of Greater Oklahoma City OMAHA, NE Urban League of Nebraska, Inc. ORLANDO, FL Central Florida Urban League PEORIA, IL Tri-County Urban League PHILADELPHIA, PA Urban League of Philadelphia PHOENIX, AZ Greater Phoenix Urban League PITTSBURGH, PA Urban League of Greater Pittsburgh PORTLAND, OR Urban League of Portland PROVIDENCE, RI Urban League of Rhode Island RACINE, WI Urban League of Racine Kenosha, Inc. ROCHESTER, NY Urban League of Rochester SACRAMENTO, CA Greater Sacramento Urban League SAINT LOUIS, MO Urban League of Metropolitan St. Louis SAINT PETERSBURG, FL Pinellas County Urban League SAN DIEGO, CA Urban League of San Diego County SEATTLE, WA Urban League of Metropolitan Seattle SPRINGFIELD, IL Springfield Urban League, Inc. SPRINGFIELD, MA Urban League of Springfield STAMFORD, CT Urban League of Southern Connecticut TACOMA, WA Tacoma Urban League TALLAHASSEE, FL Tallahassee Urban League TUCSON, AZ Tucson Urban League TULSA, OK Metropolitan Tulsa Urban League VIRGINIA BEACH, VA (NORFOLK) Urban League of Hampton Roads WARREN, OH Greater Warren-Youngstown Urban League WASHINGTON, DC Greater Washington Urban League WEST PALM BEACH, FL Urban League of Palm Beach County, Inc. WHITE PLAINS, NY Urban League of Westchester County WICHITA, KS Urban League of Kansas, Inc. WILMINGTON, DE Metropolitan Wilmington Urban League WINSTON-SALEM, NC Winston-Salem Urban League NATIONAL URBAN LEAGUE AFFILIATES
  • 20. 120 WALL STREET | NEW YORK, NY 10005 | WWW.NUL.ORG