SlideShare una empresa de Scribd logo
1 de 30
FIGURE 1 6% 5% 14% 23% Children with incomes below 200% of poverty Children with incomes above 200% of poverty Percent of Children Without Health Insurance Source: National Health Interview Survey data as analyzed by CBPP.  See Appendix.
FIGURE 2 5.6 million or 19% of all low-income children are uninsured. 7.2 million or 36% of all low-income parents are uninsured. Number of Uninsured Children and Parents With Incomes Below 200% of Poverty Source: Current Population Survey data as analyzed by CBPP.  See Appendix.
FIGURE 3 Percent of Uninsured Children Who Are Eligible or Not Eligible for Medicaid or SCHIP Source: Dubay, Holahan, and Cook, 2006.  Analyses of 2004 CPS data.  See Appendix.   9.0 million total uninsured children  in 2005 6.7 million uninsured children already eligible
FIGURE 4 Percent of Medicaid and SCHIP Children Who Are in Working Families Source: Current Population Survey data for 2005, as analyzed by CBPP.  See Appendix.
FIGURE 5 Coverage of Recent SCHIP Enrollees During the Six Months Before They Enrolled Source:  Wooldridge et al., 2005.  Congressionally-mandated evaluation of SCHIP.  The categories do not necessarily sum to 100% due to rounding.
FIGURE 6 Coverage of Low-Income Urban and Rural Children, by Insurance Type Source: Current Population Survey data for 2005, as analyzed by CBPP.   Uninsured 19% Private 28% Medicaid/ SCHIP 51% Private 29% Uninsured 17% Medicaid/ SCHIP 52% Urban Rural Other Public 2% Other Public 2%
FIGURE 7 African  American Hispanic White Percent of Children Under 200% of Poverty Without Insurance, by Racial/Ethnic Group Source: Current Population Survey data as analyzed by CBPP.  See Appendix.
FIGURE 8 Health Insurance Coverage of Low-Income Children by Citizenship Status Source: Current Population Survey data as analyzed by CBPP.  Citizen Children in Native-born Families Immigrant Children
FIGURE 9 Percent of Eligible Children With and Without Special Health Care Needs Who Participate in Medicaid or SCHIP  * Difference between children with and without special health care needs is significant with 95 percent or better confidence.   Source: Davidoff et al., 2004.  Analyses of 2000-1 National Health Interview Survey.  See Appendix.
FIGURE 10 Medicaid Participation Rates Among Young Low-Income Children in States With and Without Parent Expansions Source: Ku and Broaddus, 2000. Analyses of Current Population Survey data.
FIGURE 11 Participation Rates for Eligible Children in Medicaid in States With and Without Expanded Parent Coverage, 1999 Source: Dubay and Kenney, 2003.  Analyses of Current Population Survey.
FIGURE 12 Health Status of Children, by Insurance Type Health Status Source: CDC, 2006.  Analysis of 2005 National Health Interview Survey.   The categories do not necessarily sum to 100% due to rounding.
FIGURE 13 Percent of Children With Asthma *Difference from Medicaid/SCHIP is significant with 90% or better confidence. Source: CDC, 2006.  Analysis of 2005 National Health Interview Survey.
FIGURE 10 Percent of Children Who Are Overweight by Insurance Type Source: Haas et al., 2003. Based on 1996 Medical Expenditure Panel Survey (MEPS) data.
FIGURE 14 Percent of Children With Learning Disabilities *Difference from Medicaid/SCHIP is significant with 90% or better confidence. Source: CDC, 2006.  Analysis of 2005 National Health Interview Survey.
FIGURE 15 Percent of Children Who Need Prescription Drugs on a Regular Basis *Difference from Medicaid/SCHIP is significant with 90% or better confidence. Source: CDC, 2006.  Analysis of 2005 National Health Interview Survey.
FIGURE 16 Percent of Children With No Usual Source of Health Care *Difference from Medicaid/SCHIP is significant with 90% or better confidence. Source: CDC, 2006.  Analysis of 2005 National Health Interview Survey. See Appendix.
FIGURE 17 Percent of Children With  No Usual Source of Health Care Source: CDC, 2006.  Analysis of the National Health Interview Survey. See Appendix.
FIGURE 18 Percent of SCHIP Children With a Usual Source of Care Before and After Enrollment, By Racial/Ethnic Group Source: Shone et al., 2005.  Based on survey of SCHIP enrollees in New York State.
FIGURE 19 Percent of Children With One or More Doctor or Health Professional Visits in Last Year *Difference from Medicaid/SCHIP is significant with 90% or better confidence. Source: CDC, 2006.  Analysis of 2005 National Health Interview Survey.
FIGURE 20 Percent of Children With One or More Well-Child Visits in the Past Year *Difference from Medicaid/SCHIP is significant with 90% or better confidence. Source:  CBPP analysis of the 2005 National Health Interview Survey.
FIGURE 21 Likelihood of Having a Preventive Health Visit in the Prior Year, Compared to Children With Full-Year Private Insurance *Difference from full-year private coverage is significant with 95% or better confidence. Source: Duderstadt et al., 2006.  Based on analyses of 2003 NHIS.  See Appendix.
FIGURE 22 Percent of Children Who Visit the Emergency Room Two or More Times a Year *The difference between 1997 and 2005 Medicaid/SCHIP figures is significant with 90% or better confidence.  Source: 2005 National Health Interview Survey as analyzed by CBPP.
FIGURE 23 Percent of Children Whose Medical Care Was Delayed Due to Cost *Difference from Medicaid/SCHIP is significant with 90% or better confidence. Source: CDC, 2006.  Analysis of 2005 National Health Interview Survey.
FIGURE 28 Percent of Children With Unmet Medical and Dental Needs in the Last Year *Difference from Medicaid/SCHIP is significant with 90% or better confidence. Source: CDC, 2006.  Analysis of 2005 National Health Interview Survey.
FIGURE 29 Percent of SCHIP Children With Unmet Needs Before and After Enrollment, by Racial/Ethnic Group Source: Shone et al., 2005.  Based on a survey of children enrolled in SCHIP in New York State.
FIGURE 24 Likelihood of Seeing a Dentist in the Prior Year, Compared to Children With Full-Year Private Insurance  *Difference from full-year private coverage is significant with 95% or better confidence. Source: Duderstadt et al., 2006, based on 2003 National Health Interview Survey.  See Appendix.
FIGURE 25 Percent of Children With Improved Health Status in the Past 12 Months *Difference from Medicaid/SCHIP is significant with 90% or better confidence. Source: CDC, 2006.  Analysis of 2005 National Health Interview Survey. See Appendix.
FIGURE 26 Percent of Children Hospitalized Due to Asthma  Source: Szilyagi, et al. 2006. Based on a survey of children enrolled in New York’s SCHIP program.
FIGURE 27 Children’s Average School Performance Ratings Before SCHIP Enrollment and After One Year of SCHIP Source: Managed Risk Medical Insurance Board, 2002.

Más contenido relacionado

La actualidad más candente

Experiences and Attitudes of Primary Care Practitioners After the ACA
Experiences and Attitudes of Primary Care Practitioners After the ACAExperiences and Attitudes of Primary Care Practitioners After the ACA
Experiences and Attitudes of Primary Care Practitioners After the ACAKFF
 
What does the public know and think about Zika? - September 2016
What does the public know and think about Zika? - September 2016What does the public know and think about Zika? - September 2016
What does the public know and think about Zika? - September 2016KFF
 
5 Charts About Americans and Medical Bills
5 Charts About Americans and Medical Bills5 Charts About Americans and Medical Bills
5 Charts About Americans and Medical BillsKFF
 
Can Post-Stratification Adjustments Do Enough to Reduce Bias in Telephone Sur...
Can Post-Stratification Adjustments Do Enough to Reduce Bias in Telephone Sur...Can Post-Stratification Adjustments Do Enough to Reduce Bias in Telephone Sur...
Can Post-Stratification Adjustments Do Enough to Reduce Bias in Telephone Sur...soder145
 
Public opinion on single payer, national health plans, and expanding access t...
Public opinion on single payer, national health plans, and expanding access t...Public opinion on single payer, national health plans, and expanding access t...
Public opinion on single payer, national health plans, and expanding access t...KFF
 
Trends and Disparities in Children's Health Insurance: New Data and the Impli...
Trends and Disparities in Children's Health Insurance: New Data and the Impli...Trends and Disparities in Children's Health Insurance: New Data and the Impli...
Trends and Disparities in Children's Health Insurance: New Data and the Impli...soder145
 
Hirasuna Presentation On Child Support And Welfare Spells
Hirasuna Presentation On Child Support And Welfare SpellsHirasuna Presentation On Child Support And Welfare Spells
Hirasuna Presentation On Child Support And Welfare Spellsdhirasuna
 
Unstable Ground? Comparing Income, Poverty & Health Insurance Estimates from ...
Unstable Ground? Comparing Income, Poverty & Health Insurance Estimates from ...Unstable Ground? Comparing Income, Poverty & Health Insurance Estimates from ...
Unstable Ground? Comparing Income, Poverty & Health Insurance Estimates from ...soder145
 
Pres aap oct28_gonzales
Pres aap oct28_gonzalesPres aap oct28_gonzales
Pres aap oct28_gonzalessoder145
 
Early Impacts of the ACA on Health Insurance Coverage in Minnesota
Early Impacts of the ACA on Health Insurance Coverage in MinnesotaEarly Impacts of the ACA on Health Insurance Coverage in Minnesota
Early Impacts of the ACA on Health Insurance Coverage in Minnesotasoder145
 
Child Death Review: The Power to Prevent Deaths and Keep Children Safe and He...
Child Death Review: The Power to Prevent Deaths and Keep Children Safe and He...Child Death Review: The Power to Prevent Deaths and Keep Children Safe and He...
Child Death Review: The Power to Prevent Deaths and Keep Children Safe and He...Voices for Georgia's Children
 
Public Opinion On Expanding Access To Medicare Coverage
Public Opinion On Expanding Access To Medicare CoveragePublic Opinion On Expanding Access To Medicare Coverage
Public Opinion On Expanding Access To Medicare CoverageKFF
 
Post reform changes in health care access and affordability in MN
Post reform changes in health care access and affordability in MN Post reform changes in health care access and affordability in MN
Post reform changes in health care access and affordability in MN soder145
 
Georgia Child Fatality Review Panel Annual Report: Summary and Highlights
Georgia Child Fatality Review Panel Annual Report: Summary and Highlights Georgia Child Fatality Review Panel Annual Report: Summary and Highlights
Georgia Child Fatality Review Panel Annual Report: Summary and Highlights Voices for Georgia's Children
 
The US Public’s Health Care Agenda for 2013, JAMA, February 27, 2013
The US Public’s Health Care Agenda for 2013, JAMA, February 27, 2013The US Public’s Health Care Agenda for 2013, JAMA, February 27, 2013
The US Public’s Health Care Agenda for 2013, JAMA, February 27, 2013KFF
 
071009finalmiddleclasstaskforcereport2 090710122425 Phpapp01
071009finalmiddleclasstaskforcereport2 090710122425 Phpapp01071009finalmiddleclasstaskforcereport2 090710122425 Phpapp01
071009finalmiddleclasstaskforcereport2 090710122425 Phpapp01guested62f7
 
The changing demographics of the uninsured in MN and the nation
The changing demographics of the uninsured in MN and the nationThe changing demographics of the uninsured in MN and the nation
The changing demographics of the uninsured in MN and the nationsoder145
 

La actualidad más candente (20)

Experiences and Attitudes of Primary Care Practitioners After the ACA
Experiences and Attitudes of Primary Care Practitioners After the ACAExperiences and Attitudes of Primary Care Practitioners After the ACA
Experiences and Attitudes of Primary Care Practitioners After the ACA
 
What does the public know and think about Zika? - September 2016
What does the public know and think about Zika? - September 2016What does the public know and think about Zika? - September 2016
What does the public know and think about Zika? - September 2016
 
1 in 7 say they have trouble with health bills in U.S.
1 in 7 say they have trouble with health bills in U.S.1 in 7 say they have trouble with health bills in U.S.
1 in 7 say they have trouble with health bills in U.S.
 
Understanding Behavioral Risk Factors in High-Deductible Health Plans 5 31 11
Understanding Behavioral Risk Factors in High-Deductible Health Plans 5 31 11Understanding Behavioral Risk Factors in High-Deductible Health Plans 5 31 11
Understanding Behavioral Risk Factors in High-Deductible Health Plans 5 31 11
 
5 Charts About Americans and Medical Bills
5 Charts About Americans and Medical Bills5 Charts About Americans and Medical Bills
5 Charts About Americans and Medical Bills
 
Can Post-Stratification Adjustments Do Enough to Reduce Bias in Telephone Sur...
Can Post-Stratification Adjustments Do Enough to Reduce Bias in Telephone Sur...Can Post-Stratification Adjustments Do Enough to Reduce Bias in Telephone Sur...
Can Post-Stratification Adjustments Do Enough to Reduce Bias in Telephone Sur...
 
Public opinion on single payer, national health plans, and expanding access t...
Public opinion on single payer, national health plans, and expanding access t...Public opinion on single payer, national health plans, and expanding access t...
Public opinion on single payer, national health plans, and expanding access t...
 
Trends and Disparities in Children's Health Insurance: New Data and the Impli...
Trends and Disparities in Children's Health Insurance: New Data and the Impli...Trends and Disparities in Children's Health Insurance: New Data and the Impli...
Trends and Disparities in Children's Health Insurance: New Data and the Impli...
 
Hirasuna Presentation On Child Support And Welfare Spells
Hirasuna Presentation On Child Support And Welfare SpellsHirasuna Presentation On Child Support And Welfare Spells
Hirasuna Presentation On Child Support And Welfare Spells
 
Unstable Ground? Comparing Income, Poverty & Health Insurance Estimates from ...
Unstable Ground? Comparing Income, Poverty & Health Insurance Estimates from ...Unstable Ground? Comparing Income, Poverty & Health Insurance Estimates from ...
Unstable Ground? Comparing Income, Poverty & Health Insurance Estimates from ...
 
Pres aap oct28_gonzales
Pres aap oct28_gonzalesPres aap oct28_gonzales
Pres aap oct28_gonzales
 
2013 DFCS Child Fatality Analysis Presentation
2013 DFCS Child Fatality Analysis Presentation2013 DFCS Child Fatality Analysis Presentation
2013 DFCS Child Fatality Analysis Presentation
 
Early Impacts of the ACA on Health Insurance Coverage in Minnesota
Early Impacts of the ACA on Health Insurance Coverage in MinnesotaEarly Impacts of the ACA on Health Insurance Coverage in Minnesota
Early Impacts of the ACA on Health Insurance Coverage in Minnesota
 
Child Death Review: The Power to Prevent Deaths and Keep Children Safe and He...
Child Death Review: The Power to Prevent Deaths and Keep Children Safe and He...Child Death Review: The Power to Prevent Deaths and Keep Children Safe and He...
Child Death Review: The Power to Prevent Deaths and Keep Children Safe and He...
 
Public Opinion On Expanding Access To Medicare Coverage
Public Opinion On Expanding Access To Medicare CoveragePublic Opinion On Expanding Access To Medicare Coverage
Public Opinion On Expanding Access To Medicare Coverage
 
Post reform changes in health care access and affordability in MN
Post reform changes in health care access and affordability in MN Post reform changes in health care access and affordability in MN
Post reform changes in health care access and affordability in MN
 
Georgia Child Fatality Review Panel Annual Report: Summary and Highlights
Georgia Child Fatality Review Panel Annual Report: Summary and Highlights Georgia Child Fatality Review Panel Annual Report: Summary and Highlights
Georgia Child Fatality Review Panel Annual Report: Summary and Highlights
 
The US Public’s Health Care Agenda for 2013, JAMA, February 27, 2013
The US Public’s Health Care Agenda for 2013, JAMA, February 27, 2013The US Public’s Health Care Agenda for 2013, JAMA, February 27, 2013
The US Public’s Health Care Agenda for 2013, JAMA, February 27, 2013
 
071009finalmiddleclasstaskforcereport2 090710122425 Phpapp01
071009finalmiddleclasstaskforcereport2 090710122425 Phpapp01071009finalmiddleclasstaskforcereport2 090710122425 Phpapp01
071009finalmiddleclasstaskforcereport2 090710122425 Phpapp01
 
The changing demographics of the uninsured in MN and the nation
The changing demographics of the uninsured in MN and the nationThe changing demographics of the uninsured in MN and the nation
The changing demographics of the uninsured in MN and the nation
 

Similar a Improving Children's Health: A Chartbook about the Roles of Medicaid and SCHIP

Larry Levitt: Is Employee Health Insurance Failing Americans?
Larry Levitt: Is Employee Health Insurance Failing Americans?Larry Levitt: Is Employee Health Insurance Failing Americans?
Larry Levitt: Is Employee Health Insurance Failing Americans?reportingonhealth
 
Childrens Coverage Healthy Ms Summit 2008
Childrens Coverage Healthy Ms Summit 2008Childrens Coverage Healthy Ms Summit 2008
Childrens Coverage Healthy Ms Summit 2008Amy Radican-Wald
 
Revisiting the SCHIP Funding Formula
Revisiting the SCHIP Funding FormulaRevisiting the SCHIP Funding Formula
Revisiting the SCHIP Funding Formulasoder145
 
Arm2011 brown(lavarreda) 6.14.11
Arm2011 brown(lavarreda) 6.14.11Arm2011 brown(lavarreda) 6.14.11
Arm2011 brown(lavarreda) 6.14.11soder145
 
Monitoring State-level Uninsurance, 1996-2006
Monitoring State-level Uninsurance, 1996-2006Monitoring State-level Uninsurance, 1996-2006
Monitoring State-level Uninsurance, 1996-2006soder145
 
COMMUNICATING THE IMPACT OF CURRENT AND EMMERGING POLICIES (2)
COMMUNICATING THE IMPACT OF CURRENT AND EMMERGING POLICIES (2)COMMUNICATING THE IMPACT OF CURRENT AND EMMERGING POLICIES (2)
COMMUNICATING THE IMPACT OF CURRENT AND EMMERGING POLICIES (2)Eric Benjamin MLS(Nig), MPH(USA)
 
healthreform-middleclass-vpotus
healthreform-middleclass-vpotushealthreform-middleclass-vpotus
healthreform-middleclass-vpotusKurt Herzer
 
Child Health Report Card
Child Health Report CardChild Health Report Card
Child Health Report CardMebane Rash
 
Who is impacted by the coverage gap in states that have not adopted the medic...
Who is impacted by the coverage gap in states that have not adopted the medic...Who is impacted by the coverage gap in states that have not adopted the medic...
Who is impacted by the coverage gap in states that have not adopted the medic...KFF
 
Who is Impacted by the Coverage Gap in States that Have Not Adopted the Medic...
Who is Impacted by the Coverage Gap in States that Have Not Adopted the Medic...Who is Impacted by the Coverage Gap in States that Have Not Adopted the Medic...
Who is Impacted by the Coverage Gap in States that Have Not Adopted the Medic...KFF
 
Infographic on the Affordable Care Act and Adolescents
Infographic on the Affordable Care Act and AdolescentsInfographic on the Affordable Care Act and Adolescents
Infographic on the Affordable Care Act and AdolescentsOffice of Adolescent Health
 
Contrasting Measures of Health Insurance Literacy and their Relationship to H...
Contrasting Measures of Health Insurance Literacy and their Relationship to H...Contrasting Measures of Health Insurance Literacy and their Relationship to H...
Contrasting Measures of Health Insurance Literacy and their Relationship to H...soder145
 
An Interrupted Time Series Multivariate Regression Analysis Evaluation of Sta...
An Interrupted Time Series Multivariate Regression Analysis Evaluation of Sta...An Interrupted Time Series Multivariate Regression Analysis Evaluation of Sta...
An Interrupted Time Series Multivariate Regression Analysis Evaluation of Sta...Whitney Bowman-Zatzkin
 
Who is impacted by the coverage gap in states that have not adopted the medic...
Who is impacted by the coverage gap in states that have not adopted the medic...Who is impacted by the coverage gap in states that have not adopted the medic...
Who is impacted by the coverage gap in states that have not adopted the medic...KFF
 
Able estimated participation
Able estimated participationAble estimated participation
Able estimated participationPaul Curley, CFA
 
Explanations of the Medicaid Undercount and the Factors Associated with Measu...
Explanations of the Medicaid Undercount and the Factors Associated with Measu...Explanations of the Medicaid Undercount and the Factors Associated with Measu...
Explanations of the Medicaid Undercount and the Factors Associated with Measu...soder145
 
Mass Health Insurance Survey
Mass Health Insurance SurveyMass Health Insurance Survey
Mass Health Insurance SurveyDocJess
 

Similar a Improving Children's Health: A Chartbook about the Roles of Medicaid and SCHIP (20)

Larry Levitt: Is Employee Health Insurance Failing Americans?
Larry Levitt: Is Employee Health Insurance Failing Americans?Larry Levitt: Is Employee Health Insurance Failing Americans?
Larry Levitt: Is Employee Health Insurance Failing Americans?
 
Childrens Coverage Healthy Ms Summit 2008
Childrens Coverage Healthy Ms Summit 2008Childrens Coverage Healthy Ms Summit 2008
Childrens Coverage Healthy Ms Summit 2008
 
Revisiting the SCHIP Funding Formula
Revisiting the SCHIP Funding FormulaRevisiting the SCHIP Funding Formula
Revisiting the SCHIP Funding Formula
 
Arm2011 brown(lavarreda) 6.14.11
Arm2011 brown(lavarreda) 6.14.11Arm2011 brown(lavarreda) 6.14.11
Arm2011 brown(lavarreda) 6.14.11
 
Monitoring State-level Uninsurance, 1996-2006
Monitoring State-level Uninsurance, 1996-2006Monitoring State-level Uninsurance, 1996-2006
Monitoring State-level Uninsurance, 1996-2006
 
COMMUNICATING THE IMPACT OF CURRENT AND EMMERGING POLICIES (2)
COMMUNICATING THE IMPACT OF CURRENT AND EMMERGING POLICIES (2)COMMUNICATING THE IMPACT OF CURRENT AND EMMERGING POLICIES (2)
COMMUNICATING THE IMPACT OF CURRENT AND EMMERGING POLICIES (2)
 
Presentation to Trinity Presbyterian Church
Presentation to Trinity Presbyterian ChurchPresentation to Trinity Presbyterian Church
Presentation to Trinity Presbyterian Church
 
Emerging Trends in Medicaid
Emerging Trends in Medicaid Emerging Trends in Medicaid
Emerging Trends in Medicaid
 
Disparities in Children's Health
Disparities in Children's HealthDisparities in Children's Health
Disparities in Children's Health
 
healthreform-middleclass-vpotus
healthreform-middleclass-vpotushealthreform-middleclass-vpotus
healthreform-middleclass-vpotus
 
Child Health Report Card
Child Health Report CardChild Health Report Card
Child Health Report Card
 
Who is impacted by the coverage gap in states that have not adopted the medic...
Who is impacted by the coverage gap in states that have not adopted the medic...Who is impacted by the coverage gap in states that have not adopted the medic...
Who is impacted by the coverage gap in states that have not adopted the medic...
 
Who is Impacted by the Coverage Gap in States that Have Not Adopted the Medic...
Who is Impacted by the Coverage Gap in States that Have Not Adopted the Medic...Who is Impacted by the Coverage Gap in States that Have Not Adopted the Medic...
Who is Impacted by the Coverage Gap in States that Have Not Adopted the Medic...
 
Infographic on the Affordable Care Act and Adolescents
Infographic on the Affordable Care Act and AdolescentsInfographic on the Affordable Care Act and Adolescents
Infographic on the Affordable Care Act and Adolescents
 
Contrasting Measures of Health Insurance Literacy and their Relationship to H...
Contrasting Measures of Health Insurance Literacy and their Relationship to H...Contrasting Measures of Health Insurance Literacy and their Relationship to H...
Contrasting Measures of Health Insurance Literacy and their Relationship to H...
 
An Interrupted Time Series Multivariate Regression Analysis Evaluation of Sta...
An Interrupted Time Series Multivariate Regression Analysis Evaluation of Sta...An Interrupted Time Series Multivariate Regression Analysis Evaluation of Sta...
An Interrupted Time Series Multivariate Regression Analysis Evaluation of Sta...
 
Who is impacted by the coverage gap in states that have not adopted the medic...
Who is impacted by the coverage gap in states that have not adopted the medic...Who is impacted by the coverage gap in states that have not adopted the medic...
Who is impacted by the coverage gap in states that have not adopted the medic...
 
Able estimated participation
Able estimated participationAble estimated participation
Able estimated participation
 
Explanations of the Medicaid Undercount and the Factors Associated with Measu...
Explanations of the Medicaid Undercount and the Factors Associated with Measu...Explanations of the Medicaid Undercount and the Factors Associated with Measu...
Explanations of the Medicaid Undercount and the Factors Associated with Measu...
 
Mass Health Insurance Survey
Mass Health Insurance SurveyMass Health Insurance Survey
Mass Health Insurance Survey
 

Último

97111 47426 Call Girls In Delhi MUNIRKAA
97111 47426 Call Girls In Delhi MUNIRKAA97111 47426 Call Girls In Delhi MUNIRKAA
97111 47426 Call Girls In Delhi MUNIRKAAjennyeacort
 
PULMONARY EMBOLISM AND ITS MANAGEMENTS.pdf
PULMONARY EMBOLISM AND ITS MANAGEMENTS.pdfPULMONARY EMBOLISM AND ITS MANAGEMENTS.pdf
PULMONARY EMBOLISM AND ITS MANAGEMENTS.pdfDolisha Warbi
 
call girls in aerocity DELHI 🔝 >༒9540349809 🔝 genuine Escort Service 🔝✔️✔️
call girls in aerocity DELHI 🔝 >༒9540349809 🔝 genuine Escort Service 🔝✔️✔️call girls in aerocity DELHI 🔝 >༒9540349809 🔝 genuine Escort Service 🔝✔️✔️
call girls in aerocity DELHI 🔝 >༒9540349809 🔝 genuine Escort Service 🔝✔️✔️saminamagar
 
PULMONARY EDEMA AND ITS MANAGEMENT.pdf
PULMONARY EDEMA AND  ITS  MANAGEMENT.pdfPULMONARY EDEMA AND  ITS  MANAGEMENT.pdf
PULMONARY EDEMA AND ITS MANAGEMENT.pdfDolisha Warbi
 
Culture and Health Disorders Social change.pptx
Culture and Health Disorders Social change.pptxCulture and Health Disorders Social change.pptx
Culture and Health Disorders Social change.pptxDr. Dheeraj Kumar
 
epilepsy and status epilepticus for undergraduate.pptx
epilepsy and status epilepticus  for undergraduate.pptxepilepsy and status epilepticus  for undergraduate.pptx
epilepsy and status epilepticus for undergraduate.pptxMohamed Rizk Khodair
 
Presentation on General Anesthetics pdf.
Presentation on General Anesthetics pdf.Presentation on General Anesthetics pdf.
Presentation on General Anesthetics pdf.Prerana Jadhav
 
Let's Talk About It: To Disclose or Not to Disclose?
Let's Talk About It: To Disclose or Not to Disclose?Let's Talk About It: To Disclose or Not to Disclose?
Let's Talk About It: To Disclose or Not to Disclose?bkling
 
world health day presentation ppt download
world health day presentation ppt downloadworld health day presentation ppt download
world health day presentation ppt downloadAnkitKumar311566
 
call girls in paharganj DELHI 🔝 >༒9540349809 🔝 genuine Escort Service 🔝✔️✔️
call girls in paharganj DELHI 🔝 >༒9540349809 🔝 genuine Escort Service 🔝✔️✔️call girls in paharganj DELHI 🔝 >༒9540349809 🔝 genuine Escort Service 🔝✔️✔️
call girls in paharganj DELHI 🔝 >༒9540349809 🔝 genuine Escort Service 🔝✔️✔️saminamagar
 
Hematology and Immunology - Leukocytes Functions
Hematology and Immunology - Leukocytes FunctionsHematology and Immunology - Leukocytes Functions
Hematology and Immunology - Leukocytes FunctionsMedicoseAcademics
 
call girls in Dwarka Sector 21 Metro DELHI 🔝 >༒9540349809 🔝 genuine Escort Se...
call girls in Dwarka Sector 21 Metro DELHI 🔝 >༒9540349809 🔝 genuine Escort Se...call girls in Dwarka Sector 21 Metro DELHI 🔝 >༒9540349809 🔝 genuine Escort Se...
call girls in Dwarka Sector 21 Metro DELHI 🔝 >༒9540349809 🔝 genuine Escort Se...saminamagar
 
Presentació "Real-Life VR Integration for Mild Cognitive Impairment Rehabilit...
Presentació "Real-Life VR Integration for Mild Cognitive Impairment Rehabilit...Presentació "Real-Life VR Integration for Mild Cognitive Impairment Rehabilit...
Presentació "Real-Life VR Integration for Mild Cognitive Impairment Rehabilit...Badalona Serveis Assistencials
 
Presentation on Parasympathetic Nervous System
Presentation on Parasympathetic Nervous SystemPresentation on Parasympathetic Nervous System
Presentation on Parasympathetic Nervous SystemPrerana Jadhav
 
Statistical modeling in pharmaceutical research and development.
Statistical modeling in pharmaceutical research and development.Statistical modeling in pharmaceutical research and development.
Statistical modeling in pharmaceutical research and development.ANJALI
 
Apiculture Chapter 1. Introduction 2.ppt
Apiculture Chapter 1. Introduction 2.pptApiculture Chapter 1. Introduction 2.ppt
Apiculture Chapter 1. Introduction 2.pptkedirjemalharun
 
Primary headache and facial pain. (2024)
Primary headache and facial pain. (2024)Primary headache and facial pain. (2024)
Primary headache and facial pain. (2024)Mohamed Rizk Khodair
 
Report Back from SGO: What’s New in Uterine Cancer?.pptx
Report Back from SGO: What’s New in Uterine Cancer?.pptxReport Back from SGO: What’s New in Uterine Cancer?.pptx
Report Back from SGO: What’s New in Uterine Cancer?.pptxbkling
 
Lippincott Microcards_ Microbiology Flash Cards-LWW (2015).pdf
Lippincott Microcards_ Microbiology Flash Cards-LWW (2015).pdfLippincott Microcards_ Microbiology Flash Cards-LWW (2015).pdf
Lippincott Microcards_ Microbiology Flash Cards-LWW (2015).pdfSreeja Cherukuru
 
call girls in munirka DELHI 🔝 >༒9540349809 🔝 genuine Escort Service 🔝✔️✔️
call girls in munirka  DELHI 🔝 >༒9540349809 🔝 genuine Escort Service 🔝✔️✔️call girls in munirka  DELHI 🔝 >༒9540349809 🔝 genuine Escort Service 🔝✔️✔️
call girls in munirka DELHI 🔝 >༒9540349809 🔝 genuine Escort Service 🔝✔️✔️saminamagar
 

Último (20)

97111 47426 Call Girls In Delhi MUNIRKAA
97111 47426 Call Girls In Delhi MUNIRKAA97111 47426 Call Girls In Delhi MUNIRKAA
97111 47426 Call Girls In Delhi MUNIRKAA
 
PULMONARY EMBOLISM AND ITS MANAGEMENTS.pdf
PULMONARY EMBOLISM AND ITS MANAGEMENTS.pdfPULMONARY EMBOLISM AND ITS MANAGEMENTS.pdf
PULMONARY EMBOLISM AND ITS MANAGEMENTS.pdf
 
call girls in aerocity DELHI 🔝 >༒9540349809 🔝 genuine Escort Service 🔝✔️✔️
call girls in aerocity DELHI 🔝 >༒9540349809 🔝 genuine Escort Service 🔝✔️✔️call girls in aerocity DELHI 🔝 >༒9540349809 🔝 genuine Escort Service 🔝✔️✔️
call girls in aerocity DELHI 🔝 >༒9540349809 🔝 genuine Escort Service 🔝✔️✔️
 
PULMONARY EDEMA AND ITS MANAGEMENT.pdf
PULMONARY EDEMA AND  ITS  MANAGEMENT.pdfPULMONARY EDEMA AND  ITS  MANAGEMENT.pdf
PULMONARY EDEMA AND ITS MANAGEMENT.pdf
 
Culture and Health Disorders Social change.pptx
Culture and Health Disorders Social change.pptxCulture and Health Disorders Social change.pptx
Culture and Health Disorders Social change.pptx
 
epilepsy and status epilepticus for undergraduate.pptx
epilepsy and status epilepticus  for undergraduate.pptxepilepsy and status epilepticus  for undergraduate.pptx
epilepsy and status epilepticus for undergraduate.pptx
 
Presentation on General Anesthetics pdf.
Presentation on General Anesthetics pdf.Presentation on General Anesthetics pdf.
Presentation on General Anesthetics pdf.
 
Let's Talk About It: To Disclose or Not to Disclose?
Let's Talk About It: To Disclose or Not to Disclose?Let's Talk About It: To Disclose or Not to Disclose?
Let's Talk About It: To Disclose or Not to Disclose?
 
world health day presentation ppt download
world health day presentation ppt downloadworld health day presentation ppt download
world health day presentation ppt download
 
call girls in paharganj DELHI 🔝 >༒9540349809 🔝 genuine Escort Service 🔝✔️✔️
call girls in paharganj DELHI 🔝 >༒9540349809 🔝 genuine Escort Service 🔝✔️✔️call girls in paharganj DELHI 🔝 >༒9540349809 🔝 genuine Escort Service 🔝✔️✔️
call girls in paharganj DELHI 🔝 >༒9540349809 🔝 genuine Escort Service 🔝✔️✔️
 
Hematology and Immunology - Leukocytes Functions
Hematology and Immunology - Leukocytes FunctionsHematology and Immunology - Leukocytes Functions
Hematology and Immunology - Leukocytes Functions
 
call girls in Dwarka Sector 21 Metro DELHI 🔝 >༒9540349809 🔝 genuine Escort Se...
call girls in Dwarka Sector 21 Metro DELHI 🔝 >༒9540349809 🔝 genuine Escort Se...call girls in Dwarka Sector 21 Metro DELHI 🔝 >༒9540349809 🔝 genuine Escort Se...
call girls in Dwarka Sector 21 Metro DELHI 🔝 >༒9540349809 🔝 genuine Escort Se...
 
Presentació "Real-Life VR Integration for Mild Cognitive Impairment Rehabilit...
Presentació "Real-Life VR Integration for Mild Cognitive Impairment Rehabilit...Presentació "Real-Life VR Integration for Mild Cognitive Impairment Rehabilit...
Presentació "Real-Life VR Integration for Mild Cognitive Impairment Rehabilit...
 
Presentation on Parasympathetic Nervous System
Presentation on Parasympathetic Nervous SystemPresentation on Parasympathetic Nervous System
Presentation on Parasympathetic Nervous System
 
Statistical modeling in pharmaceutical research and development.
Statistical modeling in pharmaceutical research and development.Statistical modeling in pharmaceutical research and development.
Statistical modeling in pharmaceutical research and development.
 
Apiculture Chapter 1. Introduction 2.ppt
Apiculture Chapter 1. Introduction 2.pptApiculture Chapter 1. Introduction 2.ppt
Apiculture Chapter 1. Introduction 2.ppt
 
Primary headache and facial pain. (2024)
Primary headache and facial pain. (2024)Primary headache and facial pain. (2024)
Primary headache and facial pain. (2024)
 
Report Back from SGO: What’s New in Uterine Cancer?.pptx
Report Back from SGO: What’s New in Uterine Cancer?.pptxReport Back from SGO: What’s New in Uterine Cancer?.pptx
Report Back from SGO: What’s New in Uterine Cancer?.pptx
 
Lippincott Microcards_ Microbiology Flash Cards-LWW (2015).pdf
Lippincott Microcards_ Microbiology Flash Cards-LWW (2015).pdfLippincott Microcards_ Microbiology Flash Cards-LWW (2015).pdf
Lippincott Microcards_ Microbiology Flash Cards-LWW (2015).pdf
 
call girls in munirka DELHI 🔝 >༒9540349809 🔝 genuine Escort Service 🔝✔️✔️
call girls in munirka  DELHI 🔝 >༒9540349809 🔝 genuine Escort Service 🔝✔️✔️call girls in munirka  DELHI 🔝 >༒9540349809 🔝 genuine Escort Service 🔝✔️✔️
call girls in munirka DELHI 🔝 >༒9540349809 🔝 genuine Escort Service 🔝✔️✔️
 

Improving Children's Health: A Chartbook about the Roles of Medicaid and SCHIP

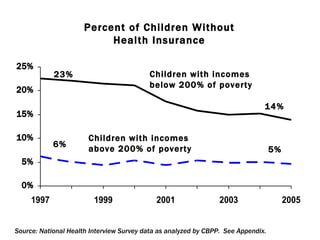
  • 1. FIGURE 1 6% 5% 14% 23% Children with incomes below 200% of poverty Children with incomes above 200% of poverty Percent of Children Without Health Insurance Source: National Health Interview Survey data as analyzed by CBPP. See Appendix.
  • 2. FIGURE 2 5.6 million or 19% of all low-income children are uninsured. 7.2 million or 36% of all low-income parents are uninsured. Number of Uninsured Children and Parents With Incomes Below 200% of Poverty Source: Current Population Survey data as analyzed by CBPP. See Appendix.
  • 3. FIGURE 3 Percent of Uninsured Children Who Are Eligible or Not Eligible for Medicaid or SCHIP Source: Dubay, Holahan, and Cook, 2006. Analyses of 2004 CPS data. See Appendix. 9.0 million total uninsured children in 2005 6.7 million uninsured children already eligible
  • 4. FIGURE 4 Percent of Medicaid and SCHIP Children Who Are in Working Families Source: Current Population Survey data for 2005, as analyzed by CBPP. See Appendix.
  • 5. FIGURE 5 Coverage of Recent SCHIP Enrollees During the Six Months Before They Enrolled Source: Wooldridge et al., 2005. Congressionally-mandated evaluation of SCHIP. The categories do not necessarily sum to 100% due to rounding.
  • 6. FIGURE 6 Coverage of Low-Income Urban and Rural Children, by Insurance Type Source: Current Population Survey data for 2005, as analyzed by CBPP. Uninsured 19% Private 28% Medicaid/ SCHIP 51% Private 29% Uninsured 17% Medicaid/ SCHIP 52% Urban Rural Other Public 2% Other Public 2%
  • 7. FIGURE 7 African American Hispanic White Percent of Children Under 200% of Poverty Without Insurance, by Racial/Ethnic Group Source: Current Population Survey data as analyzed by CBPP. See Appendix.
  • 8. FIGURE 8 Health Insurance Coverage of Low-Income Children by Citizenship Status Source: Current Population Survey data as analyzed by CBPP. Citizen Children in Native-born Families Immigrant Children
  • 9. FIGURE 9 Percent of Eligible Children With and Without Special Health Care Needs Who Participate in Medicaid or SCHIP * Difference between children with and without special health care needs is significant with 95 percent or better confidence. Source: Davidoff et al., 2004.  Analyses of 2000-1 National Health Interview Survey.  See Appendix.
  • 10. FIGURE 10 Medicaid Participation Rates Among Young Low-Income Children in States With and Without Parent Expansions Source: Ku and Broaddus, 2000. Analyses of Current Population Survey data.
  • 11. FIGURE 11 Participation Rates for Eligible Children in Medicaid in States With and Without Expanded Parent Coverage, 1999 Source: Dubay and Kenney, 2003. Analyses of Current Population Survey.
  • 12. FIGURE 12 Health Status of Children, by Insurance Type Health Status Source: CDC, 2006. Analysis of 2005 National Health Interview Survey. The categories do not necessarily sum to 100% due to rounding.
  • 13. FIGURE 13 Percent of Children With Asthma *Difference from Medicaid/SCHIP is significant with 90% or better confidence. Source: CDC, 2006. Analysis of 2005 National Health Interview Survey.
  • 14. FIGURE 10 Percent of Children Who Are Overweight by Insurance Type Source: Haas et al., 2003. Based on 1996 Medical Expenditure Panel Survey (MEPS) data.
  • 15. FIGURE 14 Percent of Children With Learning Disabilities *Difference from Medicaid/SCHIP is significant with 90% or better confidence. Source: CDC, 2006. Analysis of 2005 National Health Interview Survey.
  • 16. FIGURE 15 Percent of Children Who Need Prescription Drugs on a Regular Basis *Difference from Medicaid/SCHIP is significant with 90% or better confidence. Source: CDC, 2006. Analysis of 2005 National Health Interview Survey.
  • 17. FIGURE 16 Percent of Children With No Usual Source of Health Care *Difference from Medicaid/SCHIP is significant with 90% or better confidence. Source: CDC, 2006. Analysis of 2005 National Health Interview Survey. See Appendix.
  • 18. FIGURE 17 Percent of Children With No Usual Source of Health Care Source: CDC, 2006. Analysis of the National Health Interview Survey. See Appendix.
  • 19. FIGURE 18 Percent of SCHIP Children With a Usual Source of Care Before and After Enrollment, By Racial/Ethnic Group Source: Shone et al., 2005. Based on survey of SCHIP enrollees in New York State.
  • 20. FIGURE 19 Percent of Children With One or More Doctor or Health Professional Visits in Last Year *Difference from Medicaid/SCHIP is significant with 90% or better confidence. Source: CDC, 2006. Analysis of 2005 National Health Interview Survey.
  • 21. FIGURE 20 Percent of Children With One or More Well-Child Visits in the Past Year *Difference from Medicaid/SCHIP is significant with 90% or better confidence. Source: CBPP analysis of the 2005 National Health Interview Survey.
  • 22. FIGURE 21 Likelihood of Having a Preventive Health Visit in the Prior Year, Compared to Children With Full-Year Private Insurance *Difference from full-year private coverage is significant with 95% or better confidence. Source: Duderstadt et al., 2006. Based on analyses of 2003 NHIS. See Appendix.
  • 23. FIGURE 22 Percent of Children Who Visit the Emergency Room Two or More Times a Year *The difference between 1997 and 2005 Medicaid/SCHIP figures is significant with 90% or better confidence. Source: 2005 National Health Interview Survey as analyzed by CBPP.
  • 24. FIGURE 23 Percent of Children Whose Medical Care Was Delayed Due to Cost *Difference from Medicaid/SCHIP is significant with 90% or better confidence. Source: CDC, 2006. Analysis of 2005 National Health Interview Survey.
  • 25. FIGURE 28 Percent of Children With Unmet Medical and Dental Needs in the Last Year *Difference from Medicaid/SCHIP is significant with 90% or better confidence. Source: CDC, 2006. Analysis of 2005 National Health Interview Survey.
  • 26. FIGURE 29 Percent of SCHIP Children With Unmet Needs Before and After Enrollment, by Racial/Ethnic Group Source: Shone et al., 2005. Based on a survey of children enrolled in SCHIP in New York State.
  • 27. FIGURE 24 Likelihood of Seeing a Dentist in the Prior Year, Compared to Children With Full-Year Private Insurance *Difference from full-year private coverage is significant with 95% or better confidence. Source: Duderstadt et al., 2006, based on 2003 National Health Interview Survey. See Appendix.
  • 28. FIGURE 25 Percent of Children With Improved Health Status in the Past 12 Months *Difference from Medicaid/SCHIP is significant with 90% or better confidence. Source: CDC, 2006. Analysis of 2005 National Health Interview Survey. See Appendix.
  • 29. FIGURE 26 Percent of Children Hospitalized Due to Asthma Source: Szilyagi, et al. 2006. Based on a survey of children enrolled in New York’s SCHIP program.
  • 30. FIGURE 27 Children’s Average School Performance Ratings Before SCHIP Enrollment and After One Year of SCHIP Source: Managed Risk Medical Insurance Board, 2002.