More Related Content
Similar to Chapter 8 (19)
Chapter 8
- 1. S.L. Tails z-criticalx1 x2 s1 n1 s2 n2 stan. Err z
0.01 Left -2.326 29000 29700 600 30 900 40 179.583 -3.898
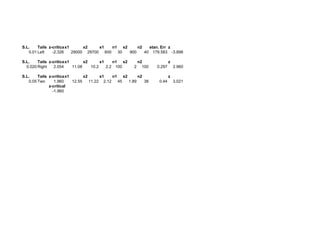
S.L. Tails z-criticalx1 x2 s1 n1 s2 n2 z
0.020 Right 2.054 11.08 10.2 2.2 100 2 100 0.297 2.960
S.L. Tails z-criticalx1 x2 s1 n1 s2 n2 z
0.05 Two 1.960 12.55 11.22 2.12 45 1.89 38 0.44 3.021
z-critical
-1.960
- 2. S.L. Tails t-critical x1 x2 s1 n1 s2 n2 stan. Err t
0.100 Left -1.306 23.1 25.3 8.69 14 0.21 23 1.796 -1.225
Pop Var=
S.L. Tails t-critical x1 x2 s1 n1 s2 n2 stan. Err t
0.1 Left -1.350 574 734 185 14 268 23 74.615 -2.144
Pop Var ≠
S.L. Tails t-critical x1 x2 s1 n1 s2 n2 stan. Err t
0.03 Right 2.048 12.1 12.27 2.4 5 2.5 25 1.218 -0.140
Pop Var =
S.L. Tails t-critical x1 x2 s1 n1 s2 n2 stan. Err t
0.05 Right 2.015 32 30.2 4.47 7 0.65 6 1.710 1.052
Pop Var ≠
S.L. Tails t-critical x1 x2 s1 n1 s2 n2 stan. Err t
0.05 Two 2.052 93.1 97.9 5.7 13 5.2 16 2.027 -2.368
Pop Var = t-critical
-2.052
S.L. Tails t-critical x1 x2 s1 n1 s2 n2 stan. Err t
0.01 Two 3.250 80 84 3.37 10 5.4 10 2.011 -1.989
Pop Var ≠ t-critical
-3.250
- 3. Second Sample Critical
First Data Data Size d d2 Sum d Sum d2 d-avg sd Sig Score
139 104 5 35 1225 63 2847 12.60 22.6561 0.01 Left
122 113 9 81 -3.747
126 100 26 676 Right
64 88 -24 576 3.747
78 61 17 289 Two
0 0 4.604
0 0 -4.604
0 0
0 0 Score
0 0 1.24
0 0
0 0
0 0
0 0
0 0
0 0
0 0
0 0
0 0
0 0
0 0
0 0
0 0
0 0
0 0
0 0
0 0
0 0
0 0
0 0
0 0
0 0
- 4. Sig Level Critical Score x1 n1 x2 n2 P-bar Q-bar p1^ p2^ Z-Score
0.05 -1.645 178 378 320 516 0.56 0.44 0.47 0.62 -4.438
Left
Sig Level Critical Score x1 n1 x2 n2 P-bar Q-bar p1^ p2^ Z-Score
0.05 1.645 193 1484 61 1013 0.1 0.9 0.13 0.06 5.669
Right
Sig Level Critical Score x1 n1 x2 n2 P-bar Q-bar p1^ p2^ Z-Score
0.05 -1.960 246 300 165 300 0.685 0.32 0.82 0.55 7.119
Two-Tail 1.960
- 5. Advanced Confidence Intervals
Z-Test
Conf Critical Stan Left Right
Level Z n1 x1 s1 n2 x2 s2 Test Error Endpoint Endpoint
0.95 1.960 42 3.2 3.3 42 4.1 3.9 -0.9 0.7883 -2.445 0.645
T-test = Variances
Conf Critical Stan Left Right
Level T n1 x1 s1 n2 x2 s2 Test Error Endpoint Endpoint
0.95 2.060 15 230 6.2 12 240 8.1 -10 2.7494 -15.663 -4.337
T-test ≠ Variances
Conf Critical Stan Left Right
Level T n1 x1 s1 n2 x2 s2 Test Error Endpoint Endpoint
0.9 1.796 15 41 2.42 12 38 1.65 3 0.7857 1.589 4.411