Carrying Capacity
•
1 recomendación•1,393 vistas

Worksheet on limiting factors and carrying capacity

Recomendados
Más contenido relacionado
La actualidad más candente
La actualidad más candente (20)
Similar a Carrying Capacity
Similar a Carrying Capacity (20)
Más de Colonial Heights Middle School
Más de Colonial Heights Middle School (20)
Último
Último (20)
Carrying Capacity
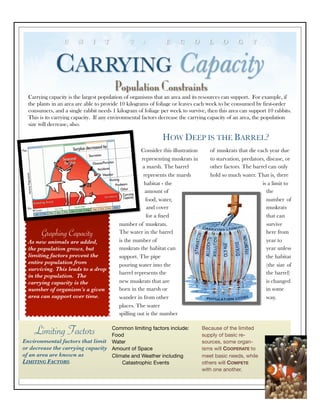
- 1. U N I T 3 : E C O L O G Y CARRYING Capacity z Population Constraints z Carrying capacity is the largest population of organisms that an area and its resources can support. For example, if the plants in an area are able to provide 10 kilograms of foliage or leaves each week to be consumed by first-order consumers, and a single rabbit needs 1 kilogram of foliage per week to survive, then this area can support 10 rabbits. This is its carrying capacity. If any environmental factors decrease the carrying capacity of an area, the population size will decrease, also. HOW DEEP IS THE BARREL? Consider this illustration of muskrats that die each year due representing muskrats in to starvation, predators, disease, or a marsh. The barrel other factors. The barrel can only represents the marsh hold so much water. That is, there habitat - the is a limit to amount of the food, water, number of and cover muskrats for a fixed that can number of muskrats. survive Graphing Capacity The water in the barrel here from As new animals are added, is the number of year to the population grows, but muskrats the habitat can year unless limiting factors prevent the support. The pipe the habitat entire population from pouring water into the (the size of surviving. This leads to a drop barrel represents the the barrel) in the population. The carrying capacity is the new muskrats that are is changed number of organism’s a given born in the marsh or in some area can support over time. wander in from other way. places. The water spilling out is the number Limiting Factors Common limiting factors include: Food Because of the limited supply of basic re- Environmental factors that limit Water sources, some organ- or decrease the carrying capacity Amount of Space isms will COOPERATE to of an area are known as Climate and Weather including meet basic needs, while LIMITING FACTORS. Catastrophic Events others will COMPETE with one another.
- 2. A B D C Illustrations .The pictures above show the effects of limiting factors on various populations. In A, a pelican competes with a duck for the same food source. Figure B shows the mutualistic symbiotic relationship between bees and a daisy - the bee gets nectar and the daisy gets pollination. Figures C and D show competition between members of the same species - the insects in figure C are competing for food and the rams in figure D are competing for mates. Questions 1. What is carrying capacity? 2. What is a limiting factor? Give two examples. 3.Each owl needs to eat 3 small rodents per day to survive. You take a population sample and discover 2,190 rodents living in a large pasture. How many owls could this support in one year? (Remember there are 365 days in a year.) Show your work. 4. Remember the energy pyramid, and think about carrying capacity. At which trophic level would you expect to see more competition, primary level consumers or tertiary level consumers.