Protein Conformation and Aggregation Analysis
•
1 recomendación•380 vistas

Philo, J. S. (2003), Amer. Biotech. Lab. 21, 22-26.

Recomendados
Recomendados
Más contenido relacionado
La actualidad más candente
La actualidad más candente (19)
Similar a Protein Conformation and Aggregation Analysis
Similar a Protein Conformation and Aggregation Analysis (20)
Más de KBI Biopharma
Más de KBI Biopharma (20)
Último
Último (20)
Protein Conformation and Aggregation Analysis
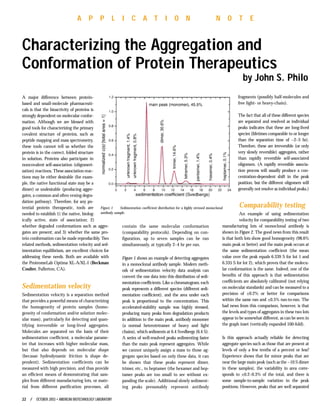
- 1. A major difference between protein- based and small-molecule pharmaceuti- cals is that the bioactivity of proteins is strongly dependent on molecular confor- mation. Although we are blessed with good tools for characterizing the primary covalent structure of proteins, such as peptide mapping and mass spectrometry, these tools cannot tell us whether the protein is in the correct, folded structure in solution. Proteins also participate in noncovalent self-association (oligomeri- zation) reactions. These association reac- tions may be either desirable (for exam- ple, the native functional state may be a dimer) or undesirable (producing aggre- gates, a common and often vexing degra- dation pathway). Therefore, for any po- tential protein therapeutic, tools are needed to establish 1) the native, biolog- ically active, state of association; 2) whether degraded conformations such as aggre- gates are present; and 3) whether the same pro- tein conformation can be made reproducibly. Two related methods, sedimentation velocity and sed- imentation equilibrium, are excellent choices for addressing these needs. Both are available with the ProteomeLab Optima XL-A/XL-I (Beckman Coulter, Fullerton, CA). Sedimentation velocity Sedimentation velocity is a separation method that provides a powerful means of characterizing the homogeneity of protein samples (homo- geneity of conformation and/or solution molec- ular mass), particularly for detecting and quan- tifying irreversible or long-lived aggregates. Molecules are separated on the basis of their sedimentation coefficient, a molecular parame- ter that increases with higher molecular mass, but that also depends on molecular shape (because hydrodynamic friction is shape de- pendent). Sedimentation coefficients can be measured with high precision, and thus provide an efficient means of demonstrating that sam- ples from different manufacturing lots, or mate- rial from different purification processes, all contain the same molecular conformation (comparability protocols). Depending on con- figuration, up to seven samples can be run simultaneously, at typically 2–4 hr per run. Figure 1 shows an example of detecting aggregates in a monoclonal antibody sample. Modern meth- ods of sedimentation velocity data analysis can convert the raw data into this distribution of sedi- mentation coefficients. Like a chromatogram, each peak represents a different species (different sedi- mentation coefficient), and the area under each peak is proportional to the concentration. This accelerated-stability sample was highly stressed, producing many peaks from degradation products in addition to the main peak, antibody monomer (a normal heterotetramer of heavy and light chains), which sediments at 6.4 Svedbergs (6.4 S). A series of well-resolved peaks sedimenting faster than the main peak represent aggregates. While we cannot uniquely assign a mass to those ag- gregate species based on only these data, it can be shown that these peaks represent dimer, trimer, etc., to heptamer (the hexamer and hep- tamer peaks are too small to see without ex- panding the scale). Additional slowly sediment- ing peaks presumably represent antibody fragments (possibly half-molecules and free light- or heavy-chain). The fact that all of these different species are separated and resolved as individual peaks indicates that these are long-lived species (lifetimes comparable to or longer than the separation time of ~2–3 hr). Therefore, these are irreversible (or only very slowly reversible) aggregates, rather than rapidly reversible self-associated oligomers. (A rapidly reversible associa- tion process will usually produce a con- centration-dependent shift in the peak position, but the different oligomers will generally not resolve as individual peaks.) Comparability testing An example of using sedimentation velocity for comparability testing of two manufacturing lots of monoclonal antibody is shown in Figure 2. The good news from this result is that both lots show good homogeneity (98.6% main peak or better) and the main peak occurs at the same sedimentation coefficient (the mean value over the peak equals 6.339 S for lot 1 and 6.335 S for lot 2), which proves that the molecu- lar conformation is the same. Indeed, one of the benefits of this approach is that sedimentation coefficients are absolutely calibrated (not relying on molecular standards) and can be measured to a precision of ±0.2% or better for comparisons within the same run and ±0.5% run-to-run. The bad news from this comparison, however, is that the levels and types of aggregates in these two lots appear to be somewhat different, as can be seen in the graph inset (vertically expanded 100-fold). Is this approach actually reliable for detecting aggregate species such as those that are present at levels of only a few tenths of a percent or less? Experience shows that for minor peaks that are near the large main peak (such as the ~10 S dimer in these samples), the variability in area corre- sponds to ±0.2–0.3% of the total, and there is some sample-to-sample variation in the peak positions. However, peaks that are well separated 22 / OCTOBER 2003 • AMERICAN BIOTECHNOLOGY LABORATORY A P P L I C A T I O N N O T E Characterizing the Aggregation and Conformation of Protein Therapeutics by John S. Philo Figure 1 Sedimentation coefficient distribution for a highly stressed monoclonal antibody sample.
- 2. from the main peak, such as the ~23 S species in lot 2, can be reliably detected down to levels of 0.05% or lower. Thus, the differences in aggregate content and distribution for these two samples are indeed significant in comparison to the reproducibility of the method. Another important aspect of this method is that samples can generally be run directly in their formulation buffers. There is also no potential irreversible binding of aggregate species to a column resin. In contrast, for size-exclusion (gel filtration) chromatography (SEC), which is often employed as an aggregation assay, the elution buffer usually must be at quite high ionic strength. Further, aggregate species are often much more sticky than the native state, and they are easily lost to the column matrix. Because of this, and to obtain good resolution and symmetric peaks, chromatographers often add or- ganic cosolvents and/or use strongly acidic elution buffers. However, the use of an elution buffer that is very different from the formulation buffer, or even par- tially denaturing, may drastically alter the distribution of noncovalent aggregates that was initially present. Sedimentation equilibrium While the strong suit of sedimentation velocity is molecular conformation and the characterization of mixtures of different species, sedimentation equi- librium is a complementary tool the strengths of which are measuring mo- lecular mass in solution and studying samples involved in rapidly reversible binding equilibria (self-association or binding between different macromole- cules). In contrast to the strong separation applied during sedimentation velocity experi- ments, in sedimentation equilibrium, only a very gentle force is applied, allowing the sample to maintain thermodynamic equilibrium for its binding interactions. One major and important use of sedimentation equilibrium is simply to identify whether the native state of a protein in solution is monomer, dimer, or some higher oligomer (determination of quaternary structure). This may seem fairly trivial, but often the state of association is im- portant for biological function (e.g., a ligand may need to be a dimer in order to dimerize its cell-surface receptor); over the years the author has seen a remarkable number of cases in which such assignments were made incorrectly. The need for this type of data often arises at the two extreme ends of the development cycle. At the discovery stage, new leads or targets have usually been identified by proteomic and/or genomic approaches, and often on the basis of homology to other proteins known to be biolog- ically or therapeutically significant. When the interest in a particular protein is based largely on homology, it is important to confirm that there is actually homology of solution structure and conformation, including the correct state of association. One such example is a new homologue of tumor necrosis factor (TNF). When cloned and expressed in E. coli, this pro- tein was assigned as a monomer based on SEC, whereas a trimeric structure is a hallmark of the TNF family. Hence, a monomeric structure would suggest either that this was not a true TNF homologue, or possibly that the protein had not been correctly refolded from inclusion bodies. However, as shown in Figure 3, sedimentation equilibrium eas- ily showed that the protein is indeed a trimer in solution. When a protein therapeutic enters clin- ical development, a measurement of so- lution molecular mass is usually in cluded as part of the basic characteriza- tion package. Precisely because methods such as SEC do not always provide the correct solution mass, the regulatory agencies prefer a more robust method that is independent of molecular shape. Thus, sedimentation equilibrium data are increasingly used to provide this basic characterization information. Such data can also be useful if compara- bility studies are needed to support changes in purification or formulation that may be needed during clinical development or for postapproval manu- facturing changes. Depending on the configuration, up to 28 samples can be run simultaneously. Some proteins may not exist in essen- tially a single state of association, but instead may be present in reversible association equilibrium between two or more association states at the protein concen- tration and solution conditions used for the for- mulation. The characterization of such reversi- ble interactions is a particular strength of sedimentation equilibrium, but space limita- tions prevent examples and details of those applications to be given here. Formation of protein aggregates at high concentrations The fact that many new protein therapeutics, A P P L I C A T I O N N O T E Figure 2 Comparability of conformation and aggregation for two different manufacturing lots of a monoclonal antibody. Figure 3 Sedimentation equilibrium data for a sequence homologue of tumor necrosis factor-α, part of a family of proteins that are usually trimers. In this form of plot, a single species gives a straight line with a slope proportional to solution mass. The blue line shows the slope predicted for a monomer, while the red is for a trimer. Clearly, this protein is indeed a trimer, as expected. 24 / OCTOBER 2003 • AMERICAN BIOTECHNOLOGY LABORATORY
- 3. especially monoclonal antibodies, are being for- mulated at high protein concentrations (10–50 mg/mL or higher) has heightened concerns about aggregation and the potential immuno- genicity or pharmacokinetic changes that may result. This concern is also creating consider- able confusion. One source of confusion is the term “aggregate” itself. Proteins can associate to form either reversible or irreversible oligomers. The reversible oligomers are held together by noncovalent bonds only; the irreversible ones may be linked covalently (e.g., by disulfide bonds) or noncovalently. Further, as illustrated in Figure 4, reversible oligomers are generally precursors to the irreversible ones; therefore pushing up the protein concentration can drive formation of both types. Some scientists term all oligomers “aggregates,” including the native state of the TNF homo- logue discussed above; some reserve the label for irreversible cases only, and others adopt inter- mediate definitions. Adding further to the mis- understanding is the fact that some analytical methods may detect only a subset of the various types (or sizes) of oligomers, either because they are strongly dissociating for noncovalent inter- actions (like sodium dodecyl sulfate-polyacry- lamide gel electrophoresis [SDS-PAGE]), or because the measurement involves a large dilu- tion that dissociates weak rapidly reversible interactions (like SEC). What is perhaps least appreciated and most confusing, however, is the fact that reversible association–dissociation reactions can sometimes have surprisingly slow kinetics, such that it may take hours or even days to reestablish mass-action equilibrium after a change in concentration, pH, or temperature. Thus, whether oligomers are detected by a given separation method can depend on the time scale of the separation relative to the kinetics of association–dissociation, and when the kinetics are slow the results may depend strongly on the sample preparation history. Are all types and sizes of oligomers of equal con- cern? With regard to size, there appear to be few quantitative data about the relative effects of dimers, trimers, and tetramers, etc., but very large aggregates are a particular concern for immunogenicity. Is there cause for concern if, for example, a protein only forms dimers at con- centrations above 10 mg/mL? If these dimers dissociate very rapidly (a few minutes or less) as the protein is diluted in vivo, then it seems unlikely they will have any effect on safety or efficacy. On the other hand, oligomers that are irreversible or that persist for several hours clearly could potentially alter pharmacokinet- ics, potency, and/or immunogenicity. Thus, the lifetime of an oligomer or aggregate can be an important parameter both for biological conse- quences and for selecting and evaluating appro- priate analytical methods. Sedimentation equi- librium can detect all associated states, even very rapidly reversible ones, whereas, as noted above, for sedimentation velocity only the long- lived species are resolved as separate species. With regard to directly measuring the state of association for samples at concentrations >10 mg/mL, unfortunately, even when one can make the measurements, the interpretation of all phys- ical methods (light scattering, sedimentation, osmotic pressure, viscosity, etc.) is strongly com- promised by the strong solution nonideality (molecular crowding) effects. These effects, and methods for high-concentration studies, are complex topics well beyond the scope of this article. However, one protocol that has been found to be very useful for such samples is to directly measure the long-lived aggregates by diluting the samples down to ≤1 mg/mL and immediately running sedimentation velocity. A comparison of such data to samples equilibrated at low concentration for several days allows dis- crimination of the very slowly dissociating aggregates, and dilution into phosphate-buffered saline can be used to more closely mimic the dilution that will happen in vivo. Summary The above techniques provide a complementary set of true solution methods for characterizing protein conformation, heterogeneity, state of association, aggregation, and the strength of solution binding interactions. Sedimentation velocity is uniquely able to provide a sensitive and quantitative way to demonstrate compara- bility of molecular conformation, while sedi- mentation equilibrium is widely considered the “gold standard” for solution molecular mass. These methods are based on simple physical principles and do not rely on so-called standard proteins for calibration. Indeed, their absolute calibration even allows valid comparisons between data collected years apart. Dr. Philo is the Director of Biophysical Chemistry, Alliance Protein Laboratories, 3957 Corte Cancion, Thousand Oaks, CA 91360, U.S.A.; tel.: 805-388-1074; fax: 805-388- 7252; e-mail: jphilo@ap-lab.com. A P P L I C A T I O N N O T E Figure 4 Typical pathways for formation of protein oligomers and aggregates. As noted, the rates of association/dissociation can be remarkably slow (hours to days), obscuring the distinction between reversible and irreversible events. The transition from reversible to irreversible oligomers may, of course, occur at an ear- lier stage (e.g., a disulfide-linked dimer). Not illustrated is the fact that the initial association may be preceded by a partial unfolding of the native monomer, or that association may be strongly promoted by chemical degradation pathways (deamidation, oxidation). 26 / OCTOBER 2003 • AMERICAN BIOTECHNOLOGY LABORATORY