LCROSS: The lunar hitch-hiker that made an impact (literally!) on lunar science
•
1 recomendación•1,505 vistas

LCROSS was a NASA impactor mission that launched in June 2009 with the goal of determining if water ice exists on the Moon. It consisted of a spent rocket stage that impacted a permanently shadowed crater at the Moon's south pole in October 2009, followed by the LCROSS spacecraft itself impacting 4 minutes later to observe the ejecta plume. The impacts excavated over 200 tons of lunar material and LCROSS's instruments detected evidence of water ice in the plume, confirming its presence on the Moon.

Recomendados
Más contenido relacionado
La actualidad más candente
La actualidad más candente (17)
Destacado
Destacado (14)
Similar a LCROSS: The lunar hitch-hiker that made an impact (literally!) on lunar science
Similar a LCROSS: The lunar hitch-hiker that made an impact (literally!) on lunar science (20)
Último
Último (20)
LCROSS: The lunar hitch-hiker that made an impact (literally!) on lunar science
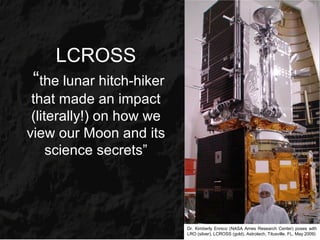
- 1. LCROSS “the lunar hitch-hiker that made an impact (literally!) on how we view our Moon and its science secrets” Dr. Kimberly Ennico (NASA Ames Research Center) poses with LRO (silver), LCROSS (gold), Astrotech, Titusville, FL, May 2009)
- 2. LCROSS...at a glance... Launch: June 18, 2009 Impact: October 9, 2009 (LCROSS was required to meet a 28 month, ATP to launch, schedule, and to have minimal impact to LRO development and launch.)
- 3. Why LCROSS? Mission Primary Objective: To test whether or not water ice deposits exist on the Moon. (Classic Scientific Method)
- 4. Why Look for Water? • Humans exploring the Moon will need water: – Option 1: Carry it there* – Option 2: Use water that may be there already • Learning to “Live off the land” could make (long-term) human lunar exploration easier. (*At $10K/lb to orbit. $3-5K more to Moon. At 8 lbs/gallon, it could cost >$100,000/gallon of water to the Moon.)
- 5. Early Evidence of Water Clementine Lunar Prospector (1994) (1999) Two previous missions, Clementine and Lunar Prospector gave us preliminary evidence that there may be deposits of water ice at the lunar poles.
- 6. Controversial: ice or rough terrain? Clementine bistatic radar – 1994 Ref: Nozette, S. et al. Science 274, 1495-1498 (1996) • Circular polarization ratio (CPR) consistent with ice crystals in the south polar regolith. • Ground-based studies (Arecibo) confirmed high-CPR in some permanently- shadowed craters. – However, Arecibo scans also found high-CPR in some areas that are illuminated, probably due to surface roughness. Ref: Stacy, N. et al. Science, 276, 1527-1530 (1997)
- 7. Accepted, not conclusive re: ice Lunar Prospector – Hydrogen 1998 Ref: Feldman, W.C. et al. Science 281, 1496-1500 (1998) Map courtesy of D. Lawrence, Los Alamos National Laboratory. • Neutron spectrometer maps of both lunar poles • Low resolution data indicate elevated concentrations of hydrogen at both poles • It does not tell us the form of the hydrogen
- 8. The “Famous” LP maps Feldman, W.C. et al. Science 281, 1496-1500 (1998) Map courtesy of D. Lawrence, Los Alamos National Laboratory. (dark blue/purple <-> low # neutrons <-> high hydrogen <-> water?)
- 9. Evidence against ice lakes at poles Hi-Res Arecibo & Green Bank radar – 2005 Ref: Campbell, D.B. et al. Nature, 443, 835-837 (2006) • Higher spatial res. (20 m) than 1994 Clementine & 1992 Arecibo data (125 m) • Surveyed south pole and nearside to latitude ~65° S • Data indicate correlation between areas of high CPR with walls and ejecta deposits – Shackleton had same CPR values as Schomberger A&G, and many other young craters – High CPR areas in Shackleton are in both permanent shadow and seasonal illumination • Conclude high CPR in Shackleton is not due to ice deposits – But they conclude they are open to possibility very low abundance (1-2% Radar image Moon South Pole by mass) mixed in grains from the (left) OC 100m; (right) CPR 500 m Fig1 from Campbell, D.B. et al. Nature, 443, 835 (2006) upper 1 m of regolith
- 10. Evidence against ice lakes at poles; temperature is cold enough to support ice Selene (Kaguya) Terrain Camera – 2007 Ref: Haruyama, J. et al. Science, 322, 938-939 (2008) • Terrain Camera (10 m res.) surveyed inside Shackleton Crater – Targeted during lunar mid-summer to get max. illumination of the shadowed regions by sunlight scattered off nearby higher terrains – Discovered small craters on inner wall (100’s m dia.), mount-like features (300-400m thick), & central hill (200m height) • Derived temperature measurement of Shackleton floor ~88 K (max) – Cold enough to retain water-ice • Did not find bright areas in Shackleton that could be due to pure water-ice – Looking for albedo ~1.0 • They also conclude they are open to possibility very low abundance (1-2% by mass) mixed in grains from the upper 1 m of regolith
- 11. How could there be water at the lunar poles? • The Sun never rises more than a few degrees above the polar horizon so the crater floors are in permanent shadow (PSR). • The crater floors are very cold with temperatures < -200° C (70K, -328° F), so Many orbits Clementine data water molecules move very South Pole (Ben Bussey, APL) slowly and are trapped for billions of years. (On October 9, 2009, LCROSS performed the first “in-situ” study of a PSR.)
- 12. Where could water ice come from? • Over the history of the Moon, when comets or • Water molecules at lower latitudes may form asteroids impact the Moon's surface, they from interactions with hydrogen streaming out briefly produce a very thin atmosphere that in the solar wind. quickly escapes into space. • These water molecules may get baked out of • Any water vapor that enters permanently the lunar soil and can then get trapped in polar shadowed craters could condense and craters. concentrate there. (volatiles from comets, asteroids, IDPs, solar wind, GMCs, the Moon itself!)
- 13. How much water could there be? • There is ~12,500 km2 of permanently shadowed terrain on the Moon. • If the top 1 meter of this area were to hold 1% water (by mass)*, that would be equivalent to about 4.1 x 10¹¹ liters of water! • This is approximately 2% the volume of the Great Salt Lake in Utah. (*The Sahara desert is 1.2% water (by mass) in its top 20cm, with 2.5-4.5% at 3m.)
- 14. Enter LCROSS-The pathfinder LCROSS had a challenging set of constraints: • We had to fit within 1000Kg wet mass… • We had to design and build the payload, spacecraft and mission in only 30 months! • We had a cost-cap of $79M, including reserves… • We couldn’t levy any requirements on LRO… • As a NASA Class D mission some programmatic and technical simplifications could be leveraged
- 15. The LCROSS Experiment Flash Curtain Crater ~0.1 min 3.0 min 1 min • Impact the Moon at 2.5 km/sec (5,600 mph) with a ~2366 kg (5216 lb) Centaur upper stage and create an ejecta cloud into the sunlight for observation • Observe the impact and ejecta with instruments that can detect water • Four minutes later the ~625 kg (1378 lb) LCROSS S/C itself impacts at 2.5 km/s
- 16. Excavating with 6.5-7 billion Joules • About equal to 1.5 tons of TNT • Minimum of 200 tons lunar rock and soil expected to be excavated • New crater estimated to have ~20-25 m diameter and ~3m depth • Similar in size to East Crater at Apollo 11 landing site
- 17. Anatomy of an Impact – flash, curtain, crater ARC Vertical Gun Experiments Step 1 Step 5 Impact flash Nadir View of Impact and Ejecta Curtain Step 2 Step 6 Incandescent particles Crater rim Time Time Step 3 Step 7 “Sunrise” Reverse ejecta Ejecta Step 4 Step 8 Curtain Into sunlight Scales to ~2 sec after Pete Schultz Centaur impact
- 18. Recent “Controlled” Lunar Impacts S/C Impact Date S/C Mass S/C Velocity Impact angle Impact Location Observations at impact from horizon. Hiten/ 10 Apr 1993 143 kg 2.33 km/s 42° 55°E, 32.4°S Flash Muses (hydrazine) LP 31 Jul 1999 161 kg 1.69 km/s 6.3° South pole area Null SMART-1 3 Sep 2006 285 kg 2 km/s 1° 46.2°W, 34.4° S Flash, plume Change’1 1 Mar 2009 2350 kg ? ? just south of the ? lunar equator, at 52.36 degrees East Longitude Kaguya 10 Jun 2009 ~1800 kg 1.8 km/s 1° 80.4°E, 65.5°S Flash (Selene) LCROSS 09 Oct 2009 2366 kg 2.5 km/s >85 ° 48.703°W, 84.675°S; Flash, Plume, Crater LCROSS 09 Oct 2009 625 kg 2.5 km/s >85 ° 48.703°W, 84.675°S; Null (to date) S-S/C
- 19. Why LCROSS would be different…. 400 LCROSS SMART-1 LCROSS Centaur 350 LP 300 LCROSS S-S/C NOTE: LCROSS Predictions shown. LP/SMART-1 250 actuals shown 200 LCROSS S-S/C 150 100 SMART-1 (hill side impact) Ejecta Mass (Metric Tones) 50 0 0 LP 20 40 60 80 Impact Angle (degrees) SMART-1 (grazing impact)
- 20. ARC Vertical Gun Experiments
- 21. LCROSS was an artificial impactor (natural impacts* happen all the time) Ref: Montañés-Rodríguez, Pallé, & Goode, AJ, 134, 1145-1149 (2007) NASA Marshall Lunar Impact Monitoring Program http://www.nasa.gov/centers/marshall/news/lunar/ (*Natural impacts typically have much more energy than LCROSS’s 6-7e9 Joules.)
- 22. The LCROSS Mission Recipe • Step 1: Hitch a ride to the Moon • (Thanks LRO) • Step 2: Part with LRO, but hang onto that rocket! • (we’ll use it later) • Step 3: Tug it around the Earth • Step 4: Point it toward our crater • Step 5: Let go! • Step 6: Slow-down & watch what kicks-up • Step 7: Send pics & data back to Earth • Step 8: Say good-bye • (Taste regolith!)
- 23. The LCROSS Mission Concept 1. Launched stacked with LRO 2. After Lunar swing-by, enter a 4 June 18, 2009 month cruise around Earth 3. October 9, 4. S-S/C observes 2009, target the impact, ejecta Centaur Upper cloud and Stage and resulting crater, position S-S/C making to fly 4 minutes measurements behind until impacting itself
- 25. Secondary Payload Approach Atlas V LCROSS literally hitched a ride to the moon! Delta II When LRO upgraded to a larger launch vehicle, there was an extra 1kg launch mass available. (LCROSS was required to meet a 28 month, ATP to launch, schedule, and to have minimal impact to LRO development and launch.)
- 28. “Creativity Loves Constraints” LCROSS’ Innovative Approach Re-use of upper- Centaur stage as the 2300kg impactor Turn the ESPA ring into the actual spacecraft mechanical structure Spare Tracking Data Relay System satellite propellant tank Petal-like panels fold up and down during I&T, eased access http://lcross.arc.nasa.gov/spacecraft.htm
- 29. “Creativity Loves Constraints” Leveraged Technology Shares the same build-to-print Propulsion System uses all avionics suite as LRO commercially available parts Star Tracker & IRU & ACS FSW similar to LRO’s arrangement NG Flight Software Heritage, using 10 year old code, just updated http://lcross.arc.nasa.gov/spacecraft.htm
- 30. “Creativity Loves Constraints” COTS Payload
- 31. Kimberly Ennico & Mark Shirley testing the LCROSS payload at NASA ARC (left) and NGST (right)
- 32. Mission Day 0 (09-169; Jun 18) Launch! 5:32pm EDT Mission Ops Center NASA Ames Launch from Cape Canaveral, FL Fairing Earth LCROSS star tracker Fairing separation
- 33. Where’s LCROSS?
- 34. LCROSS taken through Liverpool 2-meter Telescope, La Palma, Canary Islands – Robert Smith
- 35. LCROSS in flight taken through an amateur 16-inch telescope – Paul Mortfield
- 36. Where’s LCROSS? LCROSS in flight taken through an amateur 16-inch telescope – Paul Mortfield
- 37. Where’s LCROSS?
- 39. Mission Day 4 (09-173; Jun 22) Starfield Calibration Angular distance between αAquila (Altair) and γAquila (Tarazed) on the sky is 1.86 degrees and was measured to be 46 pixels (along the diagonal) on NIR2. This confirmed a platescale of ~1.89/46 = 0.04 degrees/pixel for NIR2 (at least within the central region of the array).
- 40. Mission Day 5 (09-174; Jun 23) Lunar Swingby Ennico, et al. (2009)
- 41. Mission Day 5 (09-174; Jun 23) Lunar Swingby (This was the scene of Lunar Swingby, June 23, ~2:30am.) Tony Colaprete (maroon shirt), reviews live data, Kim Ennico (black shirt) in front compares live data to expected performance using checklists. Jen Heldmann (in back) updates STK viewpoint for live streaming test.
- 42. Mission Day 44 (09-213; Aug 01) Earth Calibration at 360,000 km North North NIR1 MIR1* NIR2 MIR2 Full Earth at 360,000km O3 O2γ CO2 H2O H2O H2O CO2 CH4 O3 Ennico, et al. in prep.
- 43. Mission Day 60 (09-229; Aug 17) Earth Calibration at 520,000 km Crescent Earth at 520,000km. Crescent Moon at 881,000 km.
- 44. Mission Day 92 (09-261; Sep 18) Earth Calibration at 560,000 km STK Boresight Map NIR1 (1.4-1.7um) NIR2 (0.9-1.7um) MIR1 (6.0-10um) MIR2 (6.0-13.5um) Quarter-Earth at 560,000 km Ennico, et al. in prep.
- 45. Mission Day 113 (09-282; Oct 09) Separation MIR_S1_W0000_T3425736m453 MIR_S1_W0000_T3425953m305 d = 150 m d = 300 m Cam6_W0000_T3425736m969 MIR_S1_W0000_T3426668m025 d = 150 m d = 800 m Ennico, et al. (2009)
- 46. Mission Day 113 (09-282; Oct 09) Separation Centaur Light curves observed from Earth 3-5 hrs before impact Buie & Ryan, SWRI & Magdalena Ridge
- 47. Mission Day 113 (09-282; Oct 09) Impact! (This was the scene of Impact at the Science Ops Center, Oct 9, ~4:30am.) Tony Colaprete (black shirt), reviews live data, Kim Ennico (maroon shirt) on voice command to MOS to command camera change request based on live data analysis by Tony & Kim (on the fly).
- 48. Where did we go and why? Target Selection Criteria: 1. Ejecta Illumination 2. Association with hydrogen • 3. Observable to Earth 4. “Smooth”, flat terrain LCROSS Visible Camera Image 2009-09-09 11:00 UTC Cabeus Crater Final decision considered available data, status of LCROSS payload, ability of LRO to observe, and limits of Earth observing for each site.
- 49. Where did we go? X Goldstone map http://www.nasa.gov/mission_pages/LCROSS/main/candidate_craters_story.html
- 50. Where did we go? X Goldstone map http://www.nasa.gov/mission_pages/LCROSS/main/candidate_craters_story.html
- 51. Where did we go? Cabeus A: • Best Earth observing (not perfect since backdrop would have been lit moon) • Hydrogen association was questionable Cabeus B: • No obvious association with hydrogen Cabeus: Obvious hydrogen, but worst Earth observing LCROSS Visible Camera Image 2009-09-09 11:30 UTC (Viewpoint from LCROSS, Oct 9)
- 52. Where did we go? Target Crater Cabeus Target Crater Cabeus Nancy Chanover, APO (Viewpoint from Earth, Oct 9)
- 53. Where did we go? Expected Plume Area Nancy Chanover, APO (Viewpoint from Earth, Oct 9)
- 54. Where did we go? (Target area with good elevation angles to Sun for ejecta illumination. Source: LRO LOLA.)
- 55. How Close Did We Hit? Marshall, W., Shirley, M. et al. in prep. (We hit within 100 meters of our predicted target!)
- 56. So... Why no big plume? Schultz, et al (2010) Predicted What we think we did
- 57. What did we see? Cam1_W0000_T3460421m473 Schultz, et al (2010) (Observed expanded ejecta cloud 10-12km in diameter at 20s after impact. Visible camera imaged curtain at t+8s through t+42s, before cloud dropped below sensitivity range).
- 58. What did we see? Multi-pixel signature >1km structure t+0s t+2s t+4s MIR_S1_W0000_T3460402m651.png MIR_S1_W0000_T3460404m653.png MIR_S1_W0000_T3460406m655.png t+6s t+8s t+10s MIR_S1_W0000_T3460408m657.png MIR_S1_W0000_T3460410m659.png MIR_S1_W0000_T3460412m159.png (Thermal signature seen in mid-IR cameras t+2-10s believed to be impact-heated ballistic ejecta that did not get into sunlight (low-angle plume). Ejecta after 4s is within a single pixel, ~1km/pix at this altitude.)
- 59. Coordinating Observations View of Moon from Earth on 9 October 2009, 4:30 a.m. PDT
- 60. Coordinating Observations A Coordinated Professional Observation Campaign using Earth, Earth-Orbit and LRO has been part of the mission from the start.
- 61. Coordinating Observations Backyard astronomer observations are coordinated through the LCROSS Google Group http://groups.google.com/group/lcross_observation?hl=en
- 62. Other Eyes Canada France Hawaii Telescope (Hawaii) Apache Point Observatory (New Mexico) Infrared Telescope Facility (IRTF, Hawaii) MMT Observatory (Arizona) Magdalena Ridge Observatory (New Mexico) Keck (Hawaii) Gemini North (Hawaii) Subaru Telescope (Hawaii) Korea Astronomy & Space Science Institute (Arizona & Korea) Mount Wilson (California) Air Force AEOS Telescope (Hawaii) Allen Telescope Array (California) Palomar Observatory (California) Lick Observatory (California) Hubble Space Telescope, Lunar Reconnaissance Orbiter Odin, IKONOS, GeoEye-1 LCROS EBOC Campaign
- 63. Coordinating Observations NASA GSFC
- 65. Coordinating Observations Apache Point Observatory (New Mexico) Nancy Chanover, APO
- 66. Coordinating Observations Keck guider image (Mauna Kea, Hawaii) Wooden, et al.
- 67. Coordinating Observations Canada France Hawaii Telescope Christian Veillet, CFHT
- 68. Coordinating Observations MMT Observatory, Arizona BEFORE AFTER Faith Vilas, MMT
- 70. New Lunar Water Evidence (?)- 2009 Must excavate 1 ton regolith to get 32oz (0.25 gal) ‘water.’ (1000 ppm) Chandrayaan-1 Deep Impact Cassini Data from these probes has shown that small amounts of water are widespread across the upper millimeter surface of the Moon. The amount of water may change during the course of the lunar day. Clark, et al (2009), Pieters, et al (2009), Sunshine, et al (2009)
- 71. LCROSS’ (different) water measurement The measurement...
- 72. LCROSS’ (different) water measurement Model a 230°C (500K) greybody...
- 73. LCROSS’ (different) water measurement H2O H2O H2O Add to it a water model...
- 74. LCROSS’ (different) water measurement H2O H2O Other Other H2O Add in some other simple molecules...
- 75. So... How Much water? • LCROSS (Colaprete, et al 2010) – sampled one area, created a 20-30m diameter crater, excavated ~250 metric tons (from model) – only observed 2202-4382 kg sunlit material (above 833m alt) at impact+8s. – two band depths measured • H2O (1.4 & 1.8um) -> 145 kg H2O vapor+ice • OH (308-310nm) -> 110 kg H2O vapor+ice – model dependent (mixing) -> mean water concentration 7.4 wt% ± 5.4 wt% – observed 688-1369 kg sunlit material at impact +30-200s • LAMP/LRO (Hurley, et al. 2009) – observed H2, peak column density ~158kg H2 released, – fit models -> <400 kg H2O released, – assumed 20,000kg was released -> <2% wt% • LEND/LRO (Mitrofanov, et al. 2010) – 2100-5400 ppm measurements -> 1.9-4.9 wt% • Diviner/LRO (Hayne, et al. 2010) – observed 760-1800 kg sunlit material at impact +90s M3 “0.25 gal H2O/1 ton soil”; LCROSS “10 gal H2O/1 ton soil”
- 76. In Summary (1 of 3) • LCROSS proved that a new class of mission (NASA Class D) high science payoff at low cost/high risk is possible • Tight schedule & budget constraints (or you would lose your ride) forced proactive and rigorous project management with very visible risk management • Lifecycle of “cradle to grave” in <3 years excellent training experience • Design engineers used as part of ops team was essential in quick turn-around response to anomalies and events • Ruggedized-COTS instruments did perform well in space (~5-10 hrs operation time), high performance at low cost • Never underestimate the importance of on-orbit calibration data (saved our bacon)
- 77. In Summary (2 of 3) • Impact appears to have occurred in a volatile rich area: • Water …and other stuff!! (e.g., CH4, CO2, SO2, NH3, Na, K, CO, NH2) possibly observed…work occurring now to get unique identification • Band depths and OH emission strengths indicate significant amounts of water (>150 kg vapor and ice) – Reported concentration: 7.4 wt% ± 5.4 wt% (Colaprete, et al. 2010) – From LEND: ~ 1.9 - 4.9 wt% (for 3 cm dry layer) (Mitrofanov, et al. 2010) – Remember, ESMD requirement for moon base was 1 wt% • The amount and types of volatiles suggest: – The very cold temperatures sequester all sorts of volatiles (see Zhang & Paige, 2009) – Need multiple source model (see Lucey, 2000)
- 78. In Summary (3 of 3) Science can be surprising! Updates on the LCROSS mission results are posted at http://www.nasa.gov/LCROSS http://lcross.arc.nasa.gov Prediction What may have happened...
- 79. LCROSS Papers/Presentations Lunar Exploration Analysis Group (LEAG), November 17-19, 2009, Houston, TX (Impact +1 m) Colaprete et al., Schultz et al., Heldmann et al., Wooden et al., American Geophysical Union (AGU), December 12-16, 2009, San Francisco, CA (Impact +2 m) Colaprete et al., Schultz et al., Chin et al., McClanahan et al., Hermalyn et al., Ennico et al., Heldmann et al., Wooden et al., Hurley et al., Submitted to Science, Jan 2010 (Impact + 3m) Colaprete et al., Schultz et al., Hayne, et al. Goldstone et al. Mitrofanov, et al. Lunar and Planetary Science Conference, March 1-5, 2010, Houston , TX (Impact +5 m) Seven (7) oral and eleven (11) poster presentations in Special Session: “A New Moon: LCROSS, Chandrayaan Chang'E-1 Results”
Notas del editor
- Neutrons are produced in lunar surface by galactic cosmic rays interacting with nuclei in lunar materials. Hydrogen is good at removing energy from neutrons. Area of high-Hydrogen <-> low epithermal neutron counts. The dark blue and purple areas indicate low counting rates and are consistent with hydrogen-rich deposits covered by desiccated regolith. Explanation: Hydrogen acts as a excellent “neutron tracer” since mass of H is similar to that of a neutron. Neutrons are produced in lunar surface by galactic cosmic rays interacting with nuclei in lunar materials. This interaction produces HIGH-energy neutrons (>100skeV) which are scattered away & lose energy with each scatter. The hydrogen nucleus is good at removing energy from neutrons. So in areas of HIGH HYDROGEN, neutrons of low energy (epithermal) will BE DEPLETED (less of them) than in areas of low-hydrogen.
- Impactors range in mass from 100 g to 1000 kg Current meteoroid models indicate that the moon is struck by a meteoroid with a mass greater than 1 kg (2 lbs) over 260 times per year The slowest impact velocities are 20 km/sec (4500 mph) The fastest impact velocities are over 72 km/sec (160,000 mph) At such speeds even a small meteoroid has incredible energy -- one with a mass of only 5 kg (10 lbs) can excavate a crater over 9 meters (30 ft) across, hurling 75 metric tons (165,000 lbs) of lunar soil and rock on ballistic trajectories above the lunar surface.
- (b) Centaur impact’s actual location derivation by multiple approaches on a 500 m x 400 m grid (Note: meter scale). North/South runs along vertical axis. The target supplied by the science team is placed at origin (large blue X). Estimates using trajectory propagation are shown by orange triangles. Their 1- errors are represented by large orange circle (156 m radius). Magenta squares are bundle-adjusted image registration against LOLA terrain. Forward propagation from S-S/C trajectory using LCROSS MIR1 imagery produced the green diamonds. Their 1- errors are shown by green ellipse 3 m by 75 m (semi axis). Vectors to Sun and Earth are shown. Inset at lower right shows comparison of S-S/C impact location, derived from trajectory analysis, to its planned target location.