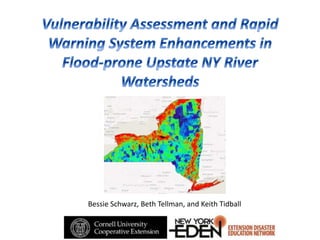
Vulnerability Assessment and Rapid Warning System Enhancements in

This presentation represents initial efforts to down scale a global flood vulnerability model developed in a cloud based computing tool Google Earth Engine for the noncoastal “upstate areas” of the State of New York. This customized New York application of the model is the result of collaboration with colleagues at Yale University. The model analyzes social and physical vulnerability to riverine flooding based on multiple data inputs, outputs the high risk areas for flooding, and runs statistics on the population living in the flooded zone. Initial results examine the ability for the model to predict risk for a specific storm area, county, or watershed in 1-30 seconds. Future work requires further testing and validation of the model, a more advanced algorithm, and dynamic user-friendly interface for public risk communication of both underlying vulnerability and an early warning system.

Recomendados
Recomendados
Más contenido relacionado
La actualidad más candente
La actualidad más candente (19)
Destacado
Destacado (20)
Similar a Vulnerability Assessment and Rapid Warning System Enhancements in
Similar a Vulnerability Assessment and Rapid Warning System Enhancements in (20)
Más de Keith G. Tidball
Más de Keith G. Tidball (20)
Último
Último (20)
Vulnerability Assessment and Rapid Warning System Enhancements in
- 1. Bessie Schwarz, Beth Tellman, and Keith Tidball
- 7. Social Vulnerability Combined Eco-Social Risk
- 10. • Application in the new Google Earth Engine Application Programming Interface (API) • Google Earth Engine produces coarse results at a global scale. • Refine to run at higher resolution on watersheds in NYS. • Draws from modeling data readily available on the Google cloud platform • First find the flood zone using a set of biophysical indicators of vulnerability, then analyze social vulnerability • Model finds physical area of highest risk, the number of people living in the risk area and depicts these areas visually.
- 11. • draws from a social-ecological systems approach • assumes flood vulnerability the product of biophysical & social risk • computes underlying vulnerability index for riverine flooding based on basic assumptions in physical and social sciences (NOTE: not coastal flooding/ storm surge)
- 12. • flooding occurs in areas that are low and flat, pools at the bottom of larger watersheds, occurs in watersheds that have a lot of impervious surfaces and less capacity to infiltrate rainfall. • people who are very poor, very old, and very young, live in fragile communities and are less likely to have the means to evacuate themselves, or to be evacuated by their neighbors (see Cutter et al 2003 and Cutter et al 2008). • The model scores each pixel by adding up each of these biophysical and social indicators.
- 13. • The biophysical risk prediction area refines already existing weather prediction of general “flood risk.” • This is not a physically process based watershed hydrologic and hydraulic model that “flows” quantitative precipitation estimates over a surface in real time.. • The parallelization process sends individual pixels (or potentially groups a region of pixels) in a grid to different parallel servers to process each step of an algorithm, and then puts them back together again. • Simplifies the assumptions made in these more complex models and computes factors with simple algebra on a pixel by pixel basis. • Takes advantage of Google’s cloud computing and is tailored towards a rapid assessment evaluation in an oncoming storm; it is not meant to replace detailed 3-D hydrologic modeling.
- 14. • 1. Elevation: uses 10m pixel resolution DEM from the National Elevation Dataset for analysis in US. Elevation is rescaled from 0-5, with low elevations (below 125 meters above sea level receiving a score of 5, elevations between 140 and 125 a score of 4, etc.). • 2. Slope: calculated in degrees using the elevation layer. Slope is rescaled from 0-5, with slopes of .00001 to 0 gaining a score of 5, slopes of .5 to .00001 a score of 4, etc. • 3. Impervious Surface: calculated from vegetation data using an NDVI index with a 2012 global composite of Landsat 7. A 2012 composite of Landsat 7, representing the average pixel radiance for the year, was pulled into the earth engine API. We selected the near infrared and infrared banks to calculate NDVI, the normalized vegetation index. This equation is infrared-red bands/infrared+red bands. The NDVI output is a relative index of vegetative cover from -1 to 1. Thus, less vegetation represents lower infiltration rates, and higher risk areas in a flood. Low vegetation areas, such as cemented urban surfaces, have a low NDVI. The NDVI was rescaled from 0-5, such that NDVI less than zero receives a score of 5, and .2 to 0 a score of 4, and so on. • 4. Topographic Index: describes the spatial distribution of the soil moisture and related landscape processes (equation in Moore et al 1991). This final indicator is a function of the contributing area of each pixel in its watershed and slope gradient. As catchment area increases and slope gradient decreases, topographic index and soil moisture content increase. Topographic index is used in flood models such as TOPMODEL (variable contributing area conceptual flood mode- see Beven et al 1984l), in which the major factors affecting runoff generation are the catchment topography, and the soil transmissivity that diminishes with depth. Topographic index controls flow accumulation, soil moisture, distribution of saturation zones, depth of water table, evapotranspiration, thickness of soil horizons, organic matter, pH, silt and sand content, and plant cover distribution.
- 15. All four biophysical variables are combined (added) to yield a composite score of 1-20. The risk surface displayed here shows increasing redness as the risk score increases. Note that existing standing water (lakes, ponds, and rivers, shown in bright blue) have been masked out of the biophysical risk index based on the “open waters” categories of the National Land Cover data set. Open water thus receives a default risk score of “0”
- 16. The predicted flood area includes all pixels in the 95th percentile of the biophysical risk surface. This results in variable thresholds for what “level” of biophysical risk denotes a truly “flooded” area, shown in medium blue, here for the Albany/Schenectady area.
- 17. • Predicts social vulnerability to disaster by adapting techniques and scholarship by Dr. Susan Cutter (Cutter et al 2003, Cutter et al 2008). • Scaled five of Cutter’s indicators to NY social data using US Census tract level data from 2010. • Each indicator is converted into a five-point scale of risk based on its absolute numbers. • Combined social risk index is on a twenty five point scale.
- 18. • 1. (Age) Children: calculated based on tracts with a large number of children under five (5). Areas with a large number of young children are more vulnerable because they require assistance during evacuation, potentially endangering themselves and their caretakers. • 2. (Age) Elderly: calculated based on tracts with a large number of people over 85 • 3. Community Cohesion: calculated based on percentage of change in the population between 2000 and 2010 as a proxy for communities with increasing or decreasing populations. The higher the change the less “cohesive” the community is deemed to be. • 4. Density: calculated based on tracts with a high population per square Kilometer • 5. Poverty: calculated based on tracts with a large number of individuals below the poverty line.
- 19. The social risk index in the model is run solely on the predicted flood zone by applying the 25 level social risk surfaces to the flood zone. The threshold for the high risk zone is dynamically determined based on the overall risk for the area of interested input into the model, examining the 95th percentile of risk for the area of interest.
- 20. The model naturally favors the physical indicators of risk, predicting results only within the flood. The desired percentile of risk for the index can be selected and the highest risk zone will then be used for further analysis.
- 21. • This link leads to an interactive web map with several of the risk indexes and the watersheds of NY (full link: https://mapsengine.google.com/080391054257 37821391-10002667888828033184- 4/mapview/?authuser=1)
- 22. After determining physical and social risk indexes and identifying the highest risk zones within the area of interest, the model analyzes areas most at risk to determine key attributes including: physical size, number of residents within, and the county with most number of people at high risk.
- 25. • Many exciting directions for this project based on initial research. • More advanced regression based flooding algorithm. • Partnership with Azavea to create web based communication vulnerability tools. • Higher resolution social data, and additional analysis on proximity to hospitals and safe evacuation routes out of flood zones.
Notas del editor
- Application in the new Google Earth Engine Application Programming Interface (API) uses highly parallelized cloud computing to model social-ecological vulnerability to flooding at high spatial resolution. Google Earth Engine model is currently designed to produce coarse results at a global scale. Refine the model to run at higher resolution on watersheds in New York State. Draws from modeling data readily available on the Google cloud platform, including elevation, satellite imagery, and census data to dynamically refine a surface of risk within a flood prediction zone produced by weather services (i.e. NOAA). Algorithm first finds the flood zone using a set of biophysical indicators of vulnerability and then analyzes social vulnerability within the flood risk zone to find the overall area of risk. The current application finds the physical area of highest risk, and the number of people living in the risk area and depicts these areas visually.
- flooding occurs in areas that are low and flat, pools at the bottom of larger watersheds, occurs in watersheds that have a lot of impervious surfaces and less capacity to infiltrate rainfall people who are very poor, very old, and very young, live in fragile communities and are less likely to have the means to evacuate themselves, or to be evacuated by their neighbors (see Cutter et al 2003 and Cutter et al 2008). The model scores each pixel by adding up each of these biophysical and social indicators.
- The biophysical risk prediction area refines already existing weather prediction of general “flood risk.” This is not a physically process based watershed hydrologic and hydraulic model that “flows” quantitative precipitation estimates over a surface in real time. Examples of complex flood mapping models with 2 and 3-d differential and numerical equations include LISFLOOD, MIKE-SHE, and TOPKAPI that involve flow routing routines that are not possible in the parallelized computing environment in Google Earth Engine. The parallelization process sends individual pixels (or potentially groups a region of pixels) in a grid to different parallel servers to process each step of an algorithm, and then puts them back together again. Our model simplifies the assumptions made in these more complex models and computes factors with simple algebra on a pixel by pixel basis. This model takes advantage of Google’s cloud computing and is tailored towards a rapid assessment evaluation in an oncoming storm; it is not meant to replace detailed 3-D hydrologic modeling.