SlideShare una empresa de Scribd logo
1 de 22
Descargar para leer sin conexión
Journal of Economic Perspectives—Volume 24, Number 3—Summer 2010—Pages 97–118
TT
eaching may be the most-scrutinized occupation in the economy. Over theeaching may be the most-scrutinized occupation in the economy. Over the
past four decades, empirical researchers—many of them economists—havepast four decades, empirical researchers—many of them economists—have
accumulated an impressive amount of evidence on teachers: the hetero-accumulated an impressive amount of evidence on teachers: the hetero-
geneity in teacher productivity, the rise in productivity associated with teachinggeneity in teacher productivity, the rise in productivity associated with teaching
credentials and on-the-job experience, rates of turnover, the costs of recruitment,credentials and on-the-job experience, rates of turnover, the costs of recruitment,
the relationship between supply and quality, the effect of class size and the monetarythe relationship between supply and quality, the effect of class size and the monetary
value of academic achievement gains over a student’s lifetime. Since the passagevalue of academic achievement gains over a student’s lifetime. Since the passage
of the No Child Left Behind Act, along with a number of state-level educationalof the No Child Left Behind Act, along with a number of state-level educational
initiatives, the data needed to estimate individual teacher performance based oninitiatives, the data needed to estimate individual teacher performance based on
student achievement gains have become more widely available. However, there havestudent achievement gains have become more widely available. However, there have
been relatively few efforts to examine the implications of this voluminous literaturebeen relatively few efforts to examine the implications of this voluminous literature
on teacher performance. In this paper, we ask what the existing evidence implieson teacher performance. In this paper, we ask what the existing evidence implies
for how school leaders might recruit, evaluate, and retain teachers.for how school leaders might recruit, evaluate, and retain teachers.
We begin by summarizing the evidence on five key points, referring to existingWe begin by summarizing the evidence on five key points, referring to existing
work and to evidence we have accumulated from our research with the nation’swork and to evidence we have accumulated from our research with the nation’s
two largest school districts: Los Angeles and New York City. First, teachers displaytwo largest school districts: Los Angeles and New York City. First, teachers display
considerable heterogeneity in their effects on student achievement gains. The stan-considerable heterogeneity in their effects on student achievement gains. The stan-
dard deviation across teachers in their impact on student achievement gains is ondard deviation across teachers in their impact on student achievement gains is on
the order of 0.1 to 0.2 student-level standard deviations, which would improve thethe order of 0.1 to 0.2 student-level standard deviations, which would improve the
Searching for Effective Teachers with
Imperfect Information
■■ Douglas O. Staiger is John French Professor of Economics, Dartmouth College, Hanover,Douglas O. Staiger is John French Professor of Economics, Dartmouth College, Hanover,
New Hampshire. Jonah E. Rockoff is Sidney Taurel Associate Professor of Business, ColumbiaNew Hampshire. Jonah E. Rockoff is Sidney Taurel Associate Professor of Business, Columbia
Business School, New York City, New York. Their e-mail addresses areBusiness School, New York City, New York. Their e-mail addresses are 〈〈Douglas.O.Staiger@Douglas.O.Staiger@
dartmouth.edudartmouth.edu〉〉 andand 〈〈jonah.rockoff@columbia.edujonah.rockoff@columbia.edu〉〉..
doi=10.1257/jep.24.3.97
Douglas O. Staiger and Jonah E. Rockoff
98 Journal of Economic Perspectives
median student’s test score 4 to 8 percentiles in a single year.median student’s test score 4 to 8 percentiles in a single year.11
Second, estimates ofSecond, estimates of
teacher effectiveness based on student achievement data are noisy measures andteacher effectiveness based on student achievement data are noisy measures and
can be thought of as having reliability in the range of 30 to 50 percent. Third,can be thought of as having reliability in the range of 30 to 50 percent. Third,
teachers’ effectiveness rises rapidly in the first year or two of their teaching careersteachers’ effectiveness rises rapidly in the first year or two of their teaching careers
but then quickly levels out. Fourth, the primary cost of teacher turnover is notbut then quickly levels out. Fourth, the primary cost of teacher turnover is not
the direct cost of hiring and firing, but rather is the loss to students who will bethe direct cost of hiring and firing, but rather is the loss to students who will be
taught by a novice teacher rather than one with several years of experience. Fifth,taught by a novice teacher rather than one with several years of experience. Fifth,
it is difficult to identify those teachers who will prove more effective at the time ofit is difficult to identify those teachers who will prove more effective at the time of
hire. As a result, better teachers can only be identified after some evidence on theirhire. As a result, better teachers can only be identified after some evidence on their
actual job performance has accumulated.actual job performance has accumulated.
We then explore what these facts imply for how principals and school districtsWe then explore what these facts imply for how principals and school districts
should act, using a simple model in which schools must search for teachers usingshould act, using a simple model in which schools must search for teachers using
noisy signals of teacher effectiveness. Due to a lack of information available at thenoisy signals of teacher effectiveness. Due to a lack of information available at the
time of hire, we will argue for a hiring process that is not highly selective—that is,time of hire, we will argue for a hiring process that is not highly selective—that is,
while it might require evidence of general educational achievement like a collegewhile it might require evidence of general educational achievement like a college
degree, it would not require individuals to make costly up-front specific invest-degree, it would not require individuals to make costly up-front specific invest-
ments before being permitted to teach. We then argue that, given the substantialments before being permitted to teach. We then argue that, given the substantial
observed heterogeneity of teacher effects, the modest rise in productivity withobserved heterogeneity of teacher effects, the modest rise in productivity with
on-the-job experience, and the fact that tenure is a lifetime job, tenure protec-on-the-job experience, and the fact that tenure is a lifetime job, tenure protec-
tions should be limited to those who meet a very high bar. Even with the imprecisetions should be limited to those who meet a very high bar. Even with the imprecise
estimates of teacher effectiveness currently available, our simulations suggest that aestimates of teacher effectiveness currently available, our simulations suggest that a
strategy that would sample extensively from the pool of potential teachers but offerstrategy that would sample extensively from the pool of potential teachers but offer
tenure only to a small percentage could yield substantial annual gains in studenttenure only to a small percentage could yield substantial annual gains in student
achievement.achievement.
The implications of our analysis are strikingly different from current practice.The implications of our analysis are strikingly different from current practice.
Schools and school districts attempt to screen at the point of hiring and requireSchools and school districts attempt to screen at the point of hiring and require
significant investment in education-specific coursework but then grant tenuresignificant investment in education-specific coursework but then grant tenure
status to teachers as a matter of course after two to three years on the job. Perfor-status to teachers as a matter of course after two to three years on the job. Perfor-
mance evaluation is typically a perfunctory exercise and, at least officially, verymance evaluation is typically a perfunctory exercise and, at least officially, very
few teachers are considered ineffective (Weisberg, Sexton, Mulhern, and Keeling,few teachers are considered ineffective (Weisberg, Sexton, Mulhern, and Keeling,
2009). Rather than screening at the time of hire, the evidence on heterogeneity of2009). Rather than screening at the time of hire, the evidence on heterogeneity of
teacher performance suggests a better strategy would be identifying large differ-teacher performance suggests a better strategy would be identifying large differ-
ences between teachers by observing the first few years of teaching performanceences between teachers by observing the first few years of teaching performance
and retaining only the highest-performing teachers.and retaining only the highest-performing teachers.
1
The metric of standard deviations is commonly used to assess the effect of educational interven-
tions, and we will use it throughout this paper. To provide some context for readers unversed in this
literature, the gap in achievement between poor and nonpoor students (or between black and white
students) in the United States is roughly 0.8–0.9 standard deviations (authors’ calculations based on
data from the 2009 National Assessment of Educational Progress).
Douglas O. Staiger and Jonah E. Rockoff 99
Five Facts about Teacher EffectivenessFive Facts about Teacher Effectiveness
Any approach to recruiting and retaining teachers is based, at least implicitly,Any approach to recruiting and retaining teachers is based, at least implicitly,
on a set of beliefs. Here, we describe the evidence on five key parameters regardingon a set of beliefs. Here, we describe the evidence on five key parameters regarding
teacher effectiveness.teacher effectiveness.
Fact 1: Teacher Productivity Based on Gains in Student Achievement isFact 1: Teacher Productivity Based on Gains in Student Achievement is
Heterogeneous.Heterogeneous.
The fact that teachers are heterogeneous in their productivity suggests thatThe fact that teachers are heterogeneous in their productivity suggests that
there are potentially large gains to students if it is possible for school leaders tothere are potentially large gains to students if it is possible for school leaders to
attract and retain highly effective teachers, and conversely to discourage or at leastattract and retain highly effective teachers, and conversely to discourage or at least
to avoid giving tenure to ineffective teachers.to avoid giving tenure to ineffective teachers.
More than three decades ago, Hanushek (1971) and Murnane (1975) wereMore than three decades ago, Hanushek (1971) and Murnane (1975) were
the first economists to report large differences in student achievement in differentthe first economists to report large differences in student achievement in different
teachers’ classrooms, even after controlling for students’ prior achievement andteachers’ classrooms, even after controlling for students’ prior achievement and
characteristics. That literature has accelerated in recent years. Especially followingcharacteristics. That literature has accelerated in recent years. Especially following
the No Child Left Behind Act, many states and school districts began collectingthe No Child Left Behind Act, many states and school districts began collecting
annual data on students and matching it to teachers.annual data on students and matching it to teachers.22
Research has producedResearch has produced
remarkably consistent estimates of the heterogeneity in teacher impacts in differentremarkably consistent estimates of the heterogeneity in teacher impacts in different
sites. For example, using data from Texas, Rivkin, Hanushek, and Kain (2005) findsites. For example, using data from Texas, Rivkin, Hanushek, and Kain (2005) find
that a standard deviation in teacher quality is associated with 0.11 student-levelthat a standard deviation in teacher quality is associated with 0.11 student-level
standard deviations in math and 0.095 standard deviations in reading. Using datastandard deviations in math and 0.095 standard deviations in reading. Using data
from two school districts in New Jersey, Rockoff (2004) reports that one standardfrom two school districts in New Jersey, Rockoff (2004) reports that one standard
deviation in teacher effects is associated with a 0.1 student-level standard deviationdeviation in teacher effects is associated with a 0.1 student-level standard deviation
in achievement. Using data from Chicago, Aaronson, Barrow, and Sander (2007)in achievement. Using data from Chicago, Aaronson, Barrow, and Sander (2007)
report that a standard deviation in teacher quality is associated with a difference inreport that a standard deviation in teacher quality is associated with a difference in
math performance of 0.09 to 0.16 student-level standard deviations.math performance of 0.09 to 0.16 student-level standard deviations.33
How much should we care about these differences in effectiveness acrossHow much should we care about these differences in effectiveness across
teachers? To attach an approximate dollar value to them, one needs an estimateteachers? To attach an approximate dollar value to them, one needs an estimate
of the value of student achievement over the course of a student’s lifetime. Thereof the value of student achievement over the course of a student’s lifetime. There
is a long tradition in labor economics estimating the relationship between variousis a long tradition in labor economics estimating the relationship between various
types of test scores and the earnings of early-career workers (for example, Murnane,types of test scores and the earnings of early-career workers (for example, Murnane,
2
The data requirements for measuring heterogeneity in teaching effectiveness are high. First, one
needs longitudinal data on achievement for individual students matched to specific teachers. Second,
achievement data are needed on an annual basis to be able to track gains for each student over a single
school year. (Prior to the No Child Left Behind legislation, many states tested at longer intervals,
such as fourth and eighth grade.) Third, panel data on teachers are required as well, to be able to
track performance of individual teachers over time. Teacher-level panel data are needed to account
for school-level or classroom-level shocks to student achievement that contribute to the measurement
error in classroom-level measures. In this journal, Kane and Staiger (2002) showed that conventional
estimates of sampling error cannot account for the lack of persistence in school-level value-added
estimates. There appear to be other school-level and classroom-level sources of error.
3
Aaronson, Barrow, and Sander (2007) report the variance in teacher quality to be .02 to .06 grade-
level equivalents (adjusted for sampling error). In table 1, they report the standard deviation in
grade-level equivalents of eighth grade students to be 1.55 (√
_
.02/1.55 = .09, √
_
.06/1.55 = .16). Their
study adjusted for sampling variation, but not for other classroom level sources of error.
100 Journal of Economic Perspectives
Willett, and Levy, 1995; Neal and Johnson, 1996).Willett, and Levy, 1995; Neal and Johnson, 1996).44
Kane and Staiger (2002) esti-Kane and Staiger (2002) esti-
mated that the value of a one standard deviation gain in math scores would havemated that the value of a one standard deviation gain in math scores would have
been worth $110,000 at age 18 using the Murnane et al. estimates, and $256,000been worth $110,000 at age 18 using the Murnane et al. estimates, and $256,000
using the Neal and Johnson results. This implies that a one standard deviationusing the Neal and Johnson results. This implies that a one standard deviation
increase in teacher effectiveness (that is, one that leads to an increase of aboutincrease in teacher effectiveness (that is, one that leads to an increase of about
0.15 standard deviations of student achievement for 20 students) has a value of0.15 standard deviations of student achievement for 20 students) has a value of
around $330,000 to $760,000.around $330,000 to $760,000.
As several recent papers remind us, the statistical assumptions required for theAs several recent papers remind us, the statistical assumptions required for the
identification of causal teacher effects with observational data are extraordinarilyidentification of causal teacher effects with observational data are extraordinarily
strong and rarely tested (Andrabi, Das, Khwaja, and Zajonc, 2009; McCaffrey,strong and rarely tested (Andrabi, Das, Khwaja, and Zajonc, 2009; McCaffrey,
Lockwood, Koretz, Louis, and Hamilton, 2004; Raudenbush, 2004; Rothstein,Lockwood, Koretz, Louis, and Hamilton, 2004; Raudenbush, 2004; Rothstein,
2010; Rubin, Stuart, and Zanutto, 2004; Todd and Wolpin, 2003). Teachers may be2010; Rubin, Stuart, and Zanutto, 2004; Todd and Wolpin, 2003). Teachers may be
assigned classrooms of students that differ in unmeasured ways—such as consistingassigned classrooms of students that differ in unmeasured ways—such as consisting
of more motivated students, or students with stronger unmeasured prior achieve-of more motivated students, or students with stronger unmeasured prior achieve-
ment or more engaged parents—that result in varying student achievement gains.ment or more engaged parents—that result in varying student achievement gains.
Despite these concerns, several pieces of evidence suggest that the magnitudeDespite these concerns, several pieces of evidence suggest that the magnitude
of variation in teacher effects is driven by real differences in teacher quality. First,of variation in teacher effects is driven by real differences in teacher quality. First,
estimates tend to be highly correlated across a wide variety of specifications (Harrisestimates tend to be highly correlated across a wide variety of specifications (Harris
and Sass, 2006). Second, researchers have consistently found strong correlationsand Sass, 2006). Second, researchers have consistently found strong correlations
between teacher effect estimates and evaluations made by school principals andbetween teacher effect estimates and evaluations made by school principals and
other professional educators (Murnane, 1975; Jacob and Lefgren, 2008; Harrisother professional educators (Murnane, 1975; Jacob and Lefgren, 2008; Harris
and Sass, 2009; Rockoff and Speroni, 2010; Tyler, Taylor, Kane, and Wooten, 2010).and Sass, 2009; Rockoff and Speroni, 2010; Tyler, Taylor, Kane, and Wooten, 2010).
Third, while most studies of teacher effects rely on assumptions regarding matchingThird, while most studies of teacher effects rely on assumptions regarding matching
of students with teachers at the classroom level, Rivkin, Hanushek, and Kain (2005)of students with teachers at the classroom level, Rivkin, Hanushek, and Kain (2005)
use a completely different approach that does not rely on this assumption and finduse a completely different approach that does not rely on this assumption and find
similar estimates to the rest of the literature.similar estimates to the rest of the literature.
Finally, two studies based on random assignment of teachers to classroomsFinally, two studies based on random assignment of teachers to classrooms
have found variation in teacher effects consistent with nonexperimental estimates,have found variation in teacher effects consistent with nonexperimental estimates,
suggesting that estimated differences in teacher effectiveness are not driven bysuggesting that estimated differences in teacher effectiveness are not driven by
student sorting. Nye, Konstantopoulos, and Hedges (2004) reexamined data fromstudent sorting. Nye, Konstantopoulos, and Hedges (2004) reexamined data from
the Tennessee STAR classroom size experiment, in which teachers were randomlythe Tennessee STAR classroom size experiment, in which teachers were randomly
assigned to classes of a given size. The differences in classroom-level studentassigned to classes of a given size. The differences in classroom-level student
achievement that emerged within given class size groups were larger than wouldachievement that emerged within given class size groups were larger than would
have been expected to occur due to chance and strikingly similar in magnitude tohave been expected to occur due to chance and strikingly similar in magnitude to
those estimated in nonexperimental studies. Kane and Staiger (2008) study a recentthose estimated in nonexperimental studies. Kane and Staiger (2008) study a recent
experiment in Los Angeles Unified School District in which pairs of teachers wereexperiment in Los Angeles Unified School District in which pairs of teachers were
4
Murnane, Willett, and Levy (1995) estimate that a one standard deviation difference in math test
performance is associated with an 8 percent hourly wage increase for men and a 12.6 percent increase
for women. These estimates may understate the value of academic achievement since the authors also
control for years of schooling completed. Neal and Johnson (1996), who do not condition on educa-
tional attainment, estimate that an improvement of one standard deviation in test performance is
associated with 18.7 and 25.6 percent increases in hourly wages for men and women, respectively. Of
course, the cross-sectional relationship between tested achievement and earnings may overstate the
causal value of academic achievement. However, while there have been attempts to estimate the causal
value of years of schooling, we are not aware of estimates of the causal value of academic achievement.
Searching for Effective Teachers with Imperfect Information 101
randomly assigned to classrooms within the same elementary school and grade.randomly assigned to classrooms within the same elementary school and grade.
They found that nonexperimental value-added estimates from a pre-experimentalThey found that nonexperimental value-added estimates from a pre-experimental
period were able to predict student achievement differences following randomperiod were able to predict student achievement differences following random
assignment: a one-point difference between randomly-assigned teachers in pre-assignment: a one-point difference between randomly-assigned teachers in pre-
experimental value added was associated with a one-point difference in studentexperimental value added was associated with a one-point difference in student
achievement following random assignment. Thus, the nonexperimental estimatesachievement following random assignment. Thus, the nonexperimental estimates
for individual teachers were unbiased predictors of a teacher’s impact on studentfor individual teachers were unbiased predictors of a teacher’s impact on student
achievement in the experiment.achievement in the experiment.
Fact 2: Estimates of Heterogeneous Teacher Effects Include a Substantial NoiseFact 2: Estimates of Heterogeneous Teacher Effects Include a Substantial Noise
Component.Component.
Ideally, estimates of the amount that teachers affect student achievement wouldIdeally, estimates of the amount that teachers affect student achievement would
be the same across classrooms or from year to year within the same teacher, but thisbe the same across classrooms or from year to year within the same teacher, but this
does not hold true in practice. The error in estimates of teacher effects on studentdoes not hold true in practice. The error in estimates of teacher effects on student
achievement derives from at least two sources. The first is sampling variation.achievement derives from at least two sources. The first is sampling variation.
The typical elementary classroom may have 20 to 25 students per year (althoughThe typical elementary classroom may have 20 to 25 students per year (although
middle and high school teachers have somewhat larger classes and typically teachmiddle and high school teachers have somewhat larger classes and typically teach
multiple sections). With samples of such modest size, naturally occurring variationmultiple sections). With samples of such modest size, naturally occurring variation
in the make-up of a teacher’s classroom from year to year will produce variationin the make-up of a teacher’s classroom from year to year will produce variation
in a teacher’s estimated effect. However, volatility in teacher (and school) effectsin a teacher’s estimated effect. However, volatility in teacher (and school) effects
exceeds that predicted by sampling error alone (Kane and Staiger, 2002; Kane,exceeds that predicted by sampling error alone (Kane and Staiger, 2002; Kane,
Rockoff, and Staiger, 2008). The source of this second type of error—which canRockoff, and Staiger, 2008). The source of this second type of error—which can
perhaps more accurately be thought of as nonpersistent variation in estimates ofperhaps more accurately be thought of as nonpersistent variation in estimates of
teacher effects on student achievement—could include a broad range of factorsteacher effects on student achievement—could include a broad range of factors
influencing the measured achievement gains of groups of students: for example,influencing the measured achievement gains of groups of students: for example,
interactions between a specific teacher’s lesson plans and the test used in a giveninteractions between a specific teacher’s lesson plans and the test used in a given
year, an (unpredictably) disruptive student that drags down his/her classmates, ayear, an (unpredictably) disruptive student that drags down his/her classmates, a
dog barking in the parking lot on the day of the test, or more mysterious forces thatdog barking in the parking lot on the day of the test, or more mysterious forces that
fall under the broad category of “classroom chemistry.”fall under the broad category of “classroom chemistry.”
For present purposes, any nonpersistent variation in a teacher’s measuredFor present purposes, any nonpersistent variation in a teacher’s measured
impact on student achievement represents estimation error. One approach toimpact on student achievement represents estimation error. One approach to
estimating the proportion of variance due to nonpersistent sources is to study theestimating the proportion of variance due to nonpersistent sources is to study the
correlation in estimated impacts across classrooms taught by the same teacher. Ifcorrelation in estimated impacts across classrooms taught by the same teacher. If
a teacher’s estimated impact,a teacher’s estimated impact, Ytt, represents the sum of a persistent component,, represents the sum of a persistent component,
, and an uncorrelated nonpersistent error,, and an uncorrelated nonpersistent error, εεtt, then the correlation between the, then the correlation between the
estimated effect this year and last year—that is, betweenestimated effect this year and last year—that is, between Ytt andand Ytt–1–1—represents—represents
an estimate of the reliability of the teacher-level estimate in any given year. Table 1an estimate of the reliability of the teacher-level estimate in any given year. Table 1
reports the standard deviation in estimated teacher effects, the estimated reliabilityreports the standard deviation in estimated teacher effects, the estimated reliability
(as measured by the correlation across classrooms taught by the same teacher), and(as measured by the correlation across classrooms taught by the same teacher), and
implied standard deviation in true teacher impacts (implied standard deviation in true teacher impacts (σσ ) for teachers in two school) for teachers in two school
districts: Los Angeles Unified and New York City. When reported in terms of thedistricts: Los Angeles Unified and New York City. When reported in terms of the
student-level standard deviation in test scores in a given grade and subject, thestudent-level standard deviation in test scores in a given grade and subject, the
standard deviation in estimated value added for teachers was remarkably similarstandard deviation in estimated value added for teachers was remarkably similar
in the two districts, with estimates in both math and English Language Arts in thein the two districts, with estimates in both math and English Language Arts in the
102 Journal of Economic Perspectives
narrow range from .23 to .27. Although the estimated reliability of teacher effectsnarrow range from .23 to .27. Although the estimated reliability of teacher effects
was higher in math than in English Language Arts, and higher in Los Angeles thanwas higher in math than in English Language Arts, and higher in Los Angeles than
in New York City, all the reliability estimates suggest that there is considerable errorin New York City, all the reliability estimates suggest that there is considerable error
or volatility in the teacher impact estimates. Indeed, more than half of the variationor volatility in the teacher impact estimates. Indeed, more than half of the variation
in estimated impacts in math and English Language Arts are nonpersistent. Thein estimated impacts in math and English Language Arts are nonpersistent. The
standard deviation of the persistent teacher effect is between .12 and .19, similar tostandard deviation of the persistent teacher effect is between .12 and .19, similar to
that found in the previous literature discussed above.that found in the previous literature discussed above.
Fact 3: Teachers Improve Substantially in Their First Few Years on the Job.Fact 3: Teachers Improve Substantially in Their First Few Years on the Job.
Table 1 also reports the degree to which average teacher effects on studentTable 1 also reports the degree to which average teacher effects on student
achievement differ from that of experienced teachers during the first few yearsachievement differ from that of experienced teachers during the first few years
on the job in these same two districts. In both Los Angeles and New York, teacheron the job in these same two districts. In both Los Angeles and New York, teacher
effects on student achievement appear to rise rapidly during the first several yearseffects on student achievement appear to rise rapidly during the first several years
on the job and then flatten out. This finding has been replicated in a numberon the job and then flatten out. This finding has been replicated in a number
of states and districts (Rivkin, Hanushek, and Kain, 2005; Clotfelter, Ladd, andof states and districts (Rivkin, Hanushek, and Kain, 2005; Clotfelter, Ladd, and
Vigdor, 2006; Harris and Sass, 2006; Jacob, 2007). When assigned to a first-yearVigdor, 2006; Harris and Sass, 2006; Jacob, 2007). When assigned to a first-year
teacher, the average student gains .06 to .08 standard deviations of achievementteacher, the average student gains .06 to .08 standard deviations of achievement
less than observably similar students assigned to experienced teachers. However,less than observably similar students assigned to experienced teachers. However,
the achievement gains of students assigned to second-year teachers lagged those inthe achievement gains of students assigned to second-year teachers lagged those in
Table 1
Evidence on Teacher Value Added from Schools in Los Angeles and New York City
(teacher value added measured in standard deviations of student performance)
Los Angeles New York City
Math
English
Language
Arts Math
English
Language
Arts
Variation in Teacher Value Added:
Standard deviation of annual value-added
measure
0.27 0.23 0.25 0.23
Reliability of annual value-added measure 0.50 0.37 0.39 0.28
Implied standard deviation of persistent
teacher effect
0.19 0.14 0.15 0.12
Difference in Value Added Relative to
Teachers with 3+ Years Experience:
No experience teaching (novice) –0.08 –0.06 –0.07 –0.07
One year of experience teaching –0.02 –0.01 –0.03 –0.04
Two years of experience teaching –0.01 –0.01 –0.02 –0.02
Notes: Teacher value-added estimates are from analysis of data on fourth and fifth graders in years
2000–2003 for Los Angeles and 2000–2005 for New York City. Teacher value added is measured in
standard deviations of student performance. Reliability of the value-added measure refers to the
correlation of the value-added measure across classrooms taught by the same teacher. Estimates are
based on regressions of student achievement that include student-level controls for baseline test scores,
race/ethnicity, special education, English Language Learners (ELL), and free lunch status; classroom
peer means of the student-level characteristics; and grade-by-year fixed effects.
Douglas O. Staiger and Jonah E. Rockoff 103
more experienced teachers’ classrooms by only .01 to .04 standard deviations. Inmore experienced teachers’ classrooms by only .01 to .04 standard deviations. In
Los Angeles, students of third-year teachers saw gains comparable to those of moreLos Angeles, students of third-year teachers saw gains comparable to those of more
experienced teachers, while there was a small difference for third-year teachers inexperienced teachers, while there was a small difference for third-year teachers in
New York (.01 to .02 standard deviations).New York (.01 to .02 standard deviations).
Fact 4: The Main Cost of Teacher Turnover is the Reduction in StudentFact 4: The Main Cost of Teacher Turnover is the Reduction in Student
Achievement when an Experienced Teacher is Replaced by a Novice, not DirectAchievement when an Experienced Teacher is Replaced by a Novice, not Direct
Hiring Costs.Hiring Costs.
Milanowski and Odden (2007) carefully studied costs of teacher recruitmentMilanowski and Odden (2007) carefully studied costs of teacher recruitment
and hiring in a large urban Midwestern school district. They estimate total costsand hiring in a large urban Midwestern school district. They estimate total costs
of roughly $8,200: recruiting costs per vacancy of $1,100 in central office staffof roughly $8,200: recruiting costs per vacancy of $1,100 in central office staff
time and $2,600 in school-level staff time, plus $4,500 for the cost of trainingtime and $2,600 in school-level staff time, plus $4,500 for the cost of training
a new teacher. In addition, some of these costs will be defrayed by the salariesa new teacher. In addition, some of these costs will be defrayed by the salaries
earned by new teachers, which are typically lower than the salaries of the teachersearned by new teachers, which are typically lower than the salaries of the teachers
they replace.they replace.
Based on the gains that teachers make in their first few years of experience,Based on the gains that teachers make in their first few years of experience,
every time a school district loses an experienced teacher with two or more yearsevery time a school district loses an experienced teacher with two or more years
of experience and is forced to hire a novice teacher, the students assigned to theof experience and is forced to hire a novice teacher, the students assigned to the
novice teacher over the first two years of their career lose roughly .10 standardnovice teacher over the first two years of their career lose roughly .10 standard
deviations in student achievement. As discussed above, estimates suggest a .10 stan-deviations in student achievement. As discussed above, estimates suggest a .10 stan-
dard deviation gain in math scores has a value of roughly $10,000 to $25,000 perdard deviation gain in math scores has a value of roughly $10,000 to $25,000 per
student. Thus, the economic cost of lost academic achievement when replacing anstudent. Thus, the economic cost of lost academic achievement when replacing an
experienced elementary teacher with a novice would be roughly $10,000 to $25,000experienced elementary teacher with a novice would be roughly $10,000 to $25,000
times 20 students per class—or $200,000 to $500,000. This is obviously a back-of-times 20 students per class—or $200,000 to $500,000. This is obviously a back-of-
the-envelope calculation, but it dwarfs the direct costs of teacher hiring.the-envelope calculation, but it dwarfs the direct costs of teacher hiring.
Fact 5: School Leaders Have Very Little Ability to Select Effective TeachersFact 5: School Leaders Have Very Little Ability to Select Effective Teachers
During the Initial Hiring Process.During the Initial Hiring Process.
Reliable screening at the hiring stage would be an efficient tool for raisingReliable screening at the hiring stage would be an efficient tool for raising
student achievement because it avoids the cost of placing ineffective teachers instudent achievement because it avoids the cost of placing ineffective teachers in
front of students. Unfortunately, there is scant evidence that school districts orfront of students. Unfortunately, there is scant evidence that school districts or
principals can effectively separate effective and ineffective teachers when theyprincipals can effectively separate effective and ineffective teachers when they
make hiring decisions. Indeed, this notion is supported by the fact that most ofmake hiring decisions. Indeed, this notion is supported by the fact that most of
the variation in teacher effects occurs among teachers hired into the same school.the variation in teacher effects occurs among teachers hired into the same school.
One of the most interesting pieces of evidence on this topic comes from aOne of the most interesting pieces of evidence on this topic comes from a
natural experiment that occurred in California in the late 1990s (Kane andnatural experiment that occurred in California in the late 1990s (Kane and
Staiger, 2005). Beginning in the academic year 1996–1997, the state of CaliforniaStaiger, 2005). Beginning in the academic year 1996–1997, the state of California
provided cash incentives to school districts to keep class sizes in kindergartenprovided cash incentives to school districts to keep class sizes in kindergarten
through third grade to a maximum of 20 children. To take advantage of the statethrough third grade to a maximum of 20 children. To take advantage of the state
incentive, school districts throughout the state dramatically increased hiring ofincentive, school districts throughout the state dramatically increased hiring of
new elementary teachers. In the years before 1997, the Los Angeles Unified Schoolnew elementary teachers. In the years before 1997, the Los Angeles Unified School
District hired 1,200 to 1,400 elementary school teachers per year, but in 1997 LosDistrict hired 1,200 to 1,400 elementary school teachers per year, but in 1997 Los
Angeles nearlyAngeles nearly tripled the number of elementary school teachers it hired, to 3,335,the number of elementary school teachers it hired, to 3,335,
and continued to hire at more than double its earlier level for the next five years.and continued to hire at more than double its earlier level for the next five years.
104 Journal of Economic Perspectives
If the district were able to discern teacher effectiveness in the hiring process,If the district were able to discern teacher effectiveness in the hiring process,
we would have expected a large increase in hiring to have had a negative effect onwe would have expected a large increase in hiring to have had a negative effect on
the average effectiveness of the teachers hired. Such an effect would likely havethe average effectiveness of the teachers hired. Such an effect would likely have
been heightened by the fact that nearly every other school district in California wasbeen heightened by the fact that nearly every other school district in California was
on a hiring spree because of the same state law, the fact that teacher compensationon a hiring spree because of the same state law, the fact that teacher compensation
in Los Angeles did not increase more than usual during this period, and that thein Los Angeles did not increase more than usual during this period, and that the
proportion of new hires in L.A. without teaching credentials rose from 59 percentproportion of new hires in L.A. without teaching credentials rose from 59 percent
to 72 percent.to 72 percent.55
However, Kane and Staiger (2005) find that, despite the size of theHowever, Kane and Staiger (2005) find that, despite the size of the
hiring bubble, value added in the period 2001–2004 for teachers hired in 1997 washiring bubble, value added in the period 2001–2004 for teachers hired in 1997 was
no worse than for teachers hired in the years immediately before 1997.no worse than for teachers hired in the years immediately before 1997.66
Overall,Overall,
there was no evidence that tripling the number of new hires had any effect on theirthere was no evidence that tripling the number of new hires had any effect on their
average effectiveness in the classroom.average effectiveness in the classroom. 77
Other evidence on this issue comes from decades of work in which researchersOther evidence on this issue comes from decades of work in which researchers
have tried, unsuccessfully, to link teacher characteristics observable to bothhave tried, unsuccessfully, to link teacher characteristics observable to both
researchers and principals to student outcomes (see reviews by Hanushek, 1986, 1997;researchers and principals to student outcomes (see reviews by Hanushek, 1986, 1997;
Jacob, 2007). With the exception of teaching experience, there is little to suggestJacob, 2007). With the exception of teaching experience, there is little to suggest
that the credentials commonly used to determine teacher certification and pay arethat the credentials commonly used to determine teacher certification and pay are
related to teachers’ impacts on student outcomes. Some studies find that a teacher’srelated to teachers’ impacts on student outcomes. Some studies find that a teacher’s
academic background (like college grade point average or SAT test scores) is relatedacademic background (like college grade point average or SAT test scores) is related
to student outcomes, but Ballou (1996) finds that teaching applicants with strongto student outcomes, but Ballou (1996) finds that teaching applicants with strong
academic records are no more likely to be hired by school principals.academic records are no more likely to be hired by school principals.
More recent work suggests that selecting teaching candidates who are likelyMore recent work suggests that selecting teaching candidates who are likely
to be effective is difficult, but not impossible. For example, several studies haveto be effective is difficult, but not impossible. For example, several studies have
estimated the effect of novice teachers recruited under the Teach for Americaestimated the effect of novice teachers recruited under the Teach for America
program (Decker, Mayer, and Glazerman, 2004; Boyd, Grossman, Lankford, Loeb,program (Decker, Mayer, and Glazerman, 2004; Boyd, Grossman, Lankford, Loeb,
and Wyckoff, 2006; Kane, Rockoff, and Staiger, 2008). Teach for America is highlyand Wyckoff, 2006; Kane, Rockoff, and Staiger, 2008). Teach for America is highly
selective, drawing applicants from the top universities in the country and offeringselective, drawing applicants from the top universities in the country and offering
positions to only a small fraction of the thousands of individuals who apply.positions to only a small fraction of the thousands of individuals who apply.
However, these applicants have not generally taken college courses in K–12 educa-However, these applicants have not generally taken college courses in K–12 educa-
tion nor have they majored in education. Decker, Mayer, and Glazerman (2004) usetion nor have they majored in education. Decker, Mayer, and Glazerman (2004) use
random assignment to estimate the effect of the program in elementary schoolsrandom assignment to estimate the effect of the program in elementary schools
and find that students assigned to Teach For America members scored 2 percentileand find that students assigned to Teach For America members scored 2 percentile
5
It may seem surprising that the fraction of teachers without credentials didn’t rise by more, but
the number of individuals with teaching certification that do not teach is quite large. Data from the
Baccalaureate and Beyond study indicate that roughly one in five college graduates receive teaching
certification in the ten years after graduation, but 45 percent of college graduates that obtained
teaching certification are not teaching, and 15 percent have never taught (author’s calculations using
National Center for Education Statistics QuickStats on 6/8/2010).
6
Their analysis focuses on grades two through five in Los Angeles from 2001 through 2004. By 2001,
roughly two-thirds of both the 1996 and 1997 hiring cohorts were still employed by the district; thus,
there is little evidence to suggest any differential selective attrition for the larger cohort. Also, while
their value-added model controls for baseline scores and other student characteristics, there was virtu-
ally no difference in the types of students to which the cohorts had been assigned.
7
This evidence runs counter to the prevailing wisdom among some policy analysts that it was a decline
in the average quality of the teaching force that accounts for the failure to see an increase in achieve-
ment in California resulting from the class size reduction (Bohrnstedt and Stecher, 2002).
Searching for Effective Teachers with Imperfect Information 105
points (0.095 standard deviations) higher in math and no higher in reading thanpoints (0.095 standard deviations) higher in math and no higher in reading than
those assigned to other teachers. Using nonexperimental data from New York City,those assigned to other teachers. Using nonexperimental data from New York City,
in Kane, Rockoff, and Staiger (2008), we find positive effects of Teach For Americain Kane, Rockoff, and Staiger (2008), we find positive effects of Teach For America
teachers in math of .02 standard deviations and no statistically significant effectteachers in math of .02 standard deviations and no statistically significant effect
in English Language Arts. Boyd, Grossman, Lankford, Loeb, and Wyckoff (2006)in English Language Arts. Boyd, Grossman, Lankford, Loeb, and Wyckoff (2006)
report comparable results, also using data from New York City.report comparable results, also using data from New York City.
More evidence comes from studies collecting data on recently-hired noviceMore evidence comes from studies collecting data on recently-hired novice
math teachers in New York City. In Rockoff, Jacob, Kane, and Staiger (forth-math teachers in New York City. In Rockoff, Jacob, Kane, and Staiger (forth-
coming), we collected information on a number of nontraditional predictors ofcoming), we collected information on a number of nontraditional predictors of
effectiveness—including teaching-specific content knowledge, cognitive ability,effectiveness—including teaching-specific content knowledge, cognitive ability,
personality traits, feelings of self-efficacy, and scores on a commercially availablepersonality traits, feelings of self-efficacy, and scores on a commercially available
teacher selection instrument—and then used these to predict a teacher’s effect onteacher selection instrument—and then used these to predict a teacher’s effect on
math achievement. When the variables were combined into two primary factorsmath achievement. When the variables were combined into two primary factors
summarizing cognitive and noncognitive skills, teachers who were one standardsummarizing cognitive and noncognitive skills, teachers who were one standard
deviation higher on either the cognitive or noncognitive factor were found to raisedeviation higher on either the cognitive or noncognitive factor were found to raise
student achievement in math by .033 student-level standard deviations more thanstudent achievement in math by .033 student-level standard deviations more than
teachers with average skill levels. Those who were one standard deviation higherteachers with average skill levels. Those who were one standard deviation higher
on both measures were estimated to raise achievement by .066 standard deviations.on both measures were estimated to raise achievement by .066 standard deviations.
Rockoff and Speroni (2010) examined the achievement of students assigned toRockoff and Speroni (2010) examined the achievement of students assigned to
teachers recruited through an alternative certification program—the New Yorkteachers recruited through an alternative certification program—the New York
City Teaching Fellows—and asked whether achievement gains were higher forCity Teaching Fellows—and asked whether achievement gains were higher for
students assigned to teachers rated as more attractive candidates by the certificationstudents assigned to teachers rated as more attractive candidates by the certification
program’s interview protocol. They found no significant relationship with Englishprogram’s interview protocol. They found no significant relationship with English
Language Arts test scores and a small positive relationship with math test scores: aLanguage Arts test scores and a small positive relationship with math test scores: a
one standard deviation in interview score was associated with .013 standard devia-one standard deviation in interview score was associated with .013 standard devia-
tions higher math achievement gain.tions higher math achievement gain.
Implications for How We Should (and Should Not) Search forImplications for How We Should (and Should Not) Search for
Effective TeachersEffective Teachers
Here, we first lay out a way of thinking about the appropriate search strategyHere, we first lay out a way of thinking about the appropriate search strategy
for school leaders based on these empirical findings. Based on this approach, wefor school leaders based on these empirical findings. Based on this approach, we
then present simulation estimates of how these different strategies would affectthen present simulation estimates of how these different strategies would affect
average teacher productivity.average teacher productivity.
A Reservation Value or Cut-off Score ModelA Reservation Value or Cut-off Score Model
Suppose that school districts do not observe any useful pre-hire signal—thereSuppose that school districts do not observe any useful pre-hire signal—there
are a substantial number of potential applicants for teaching jobs who appear toare a substantial number of potential applicants for teaching jobs who appear to
have the general skill level to succeed in teaching, but we cannot tell in advancehave the general skill level to succeed in teaching, but we cannot tell in advance
which ones will actually succeed. However, after teachers accept a job, the schoolwhich ones will actually succeed. However, after teachers accept a job, the school
can observe the gains that students make in test scores. Thus, the principal facescan observe the gains that students make in test scores. Thus, the principal faces
a search problem: the principal draws teachers from the applicant pool, observesa search problem: the principal draws teachers from the applicant pool, observes
noisy signals over time about teacher productivity, and decides whether to dismissnoisy signals over time about teacher productivity, and decides whether to dismiss
106 Journal of Economic Perspectives
unproductive teachers and start the process over again. In this kind of model, theunproductive teachers and start the process over again. In this kind of model, the
optimal decision rule has a reservation property: at the end of a year, the principaloptimal decision rule has a reservation property: at the end of a year, the principal
makes a decision on whether to dismiss a teacher if the expected effectiveness ofmakes a decision on whether to dismiss a teacher if the expected effectiveness of
that teacher, given the information to date, lies below a reservation value.that teacher, given the information to date, lies below a reservation value.88
At a broad level, the principal should set the cut-off score where the produc-At a broad level, the principal should set the cut-off score where the produc-
tivity of thetivity of the marginal teacher is expected to be equal to the productivity of theteacher is expected to be equal to the productivity of the
averageaverage teacher. In other words, this decision rule tells principals to keep only theteacher. In other words, this decision rule tells principals to keep only the
rookies who are expected to be better than therookies who are expected to be better than the average teacher. Imagine if thisteacher. Imagine if this
were not true—that is, suppose the marginal teacher were less productive than thewere not true—that is, suppose the marginal teacher were less productive than the
average teacher. Then the school district could raise average performance by raisingaverage teacher. Then the school district could raise average performance by raising
its standard for new hires by a small amount. Likewise, if the marginal teacherits standard for new hires by a small amount. Likewise, if the marginal teacher
accepted under the standard were more productive than the average teacher, thenaccepted under the standard were more productive than the average teacher, then
the district could raise average performance by lowering the cut-off score for newthe district could raise average performance by lowering the cut-off score for new
hires and adding one more above-average teacher. This result is analogous to thehires and adding one more above-average teacher. This result is analogous to the
usual result that average costs are minimized at the point where marginal costusual result that average costs are minimized at the point where marginal cost
equals average cost.equals average cost.
However, determining the reservation value or cut-off score in practice will beHowever, determining the reservation value or cut-off score in practice will be
complex. The optimal reservation value depends on a set of underlying parameterscomplex. The optimal reservation value depends on a set of underlying parameters
similar to those already discussed: the extent of variation in performance acrosssimilar to those already discussed: the extent of variation in performance across
teachers, the return to experience, the number of years before tenure, the exog-teachers, the return to experience, the number of years before tenure, the exog-
enous turnover rate, the size of the applicant pool, and the magnitude of otherenous turnover rate, the size of the applicant pool, and the magnitude of other
hiring and firing costs. For example, if teachers are more heterogeneous, then thehiring and firing costs. For example, if teachers are more heterogeneous, then the
potential benefits of greater selection are higher. However, if there is more noisepotential benefits of greater selection are higher. However, if there is more noise
(and thus uncertainty) in the estimates of teacher heterogeneity, then the benefits(and thus uncertainty) in the estimates of teacher heterogeneity, then the benefits
of selection are lower. If the gains from teacher experience are worth more, thenof selection are lower. If the gains from teacher experience are worth more, then
the cost of dismissing experienced teachers and replacing them with novices isthe cost of dismissing experienced teachers and replacing them with novices is
larger. If the exogenous turnover rate of teachers is high, then the optimal cut-offlarger. If the exogenous turnover rate of teachers is high, then the optimal cut-off
for tenure falls because there is less benefit to giving tenure to highly effectivefor tenure falls because there is less benefit to giving tenure to highly effective
teachers if they do not stay long. Overall, the principal must set the bar to trade offteachers if they do not stay long. Overall, the principal must set the bar to trade off
the short-term cost of replacing an experienced teacher with a rookie against thethe short-term cost of replacing an experienced teacher with a rookie against the
long-term benefit of selecting only the most effective teachers.long-term benefit of selecting only the most effective teachers.
In what follows, we report the results of Monte Carlo simulations that examineIn what follows, we report the results of Monte Carlo simulations that examine
the consequences of different approaches to teacher evaluation and retention. We usethe consequences of different approaches to teacher evaluation and retention. We use
evidence on key underlying parameters to calibrate the model; all of these values lieevidence on key underlying parameters to calibrate the model; all of these values lie
in the middle of the estimates reported for Los Angeles and New York City in Table 1.in the middle of the estimates reported for Los Angeles and New York City in Table 1.
We set the standard deviation of the persistent teacher effect (in student-level stan-We set the standard deviation of the persistent teacher effect (in student-level stan-
dard deviation units) equal to 0.15, and the reliability of the value-added measuredard deviation units) equal to 0.15, and the reliability of the value-added measure
(the ratio of the persistent variance to total variance) equal to 40 percent. For the(the ratio of the persistent variance to total variance) equal to 40 percent. For the
return to experience, we assume that a first- and second-year teacher’s value addedreturn to experience, we assume that a first- and second-year teacher’s value added
is –0.07 and –0.02 student standard deviations below the value added of teachers inis –0.07 and –0.02 student standard deviations below the value added of teachers in
8
For a simple algebraic presentation of this model, with some discussion of its links to search models
with imperfect information in labor markets, see the online appendix available with this paper at
〈〈http://www.e-jep.org〉〉.
Douglas O. Staiger and Jonah E. Rockoff 107
their third year or higher. We ignore the direct costs of hiring a new teacher. Finally,their third year or higher. We ignore the direct costs of hiring a new teacher. Finally,
we assume a maximum teaching career of 30 years and an exogenous turnover ratewe assume a maximum teaching career of 30 years and an exogenous turnover rate
of 5 percent, which is approximately the proportion of experienced teachers whoof 5 percent, which is approximately the proportion of experienced teachers who
leave the Los Angeles and New York City districts each year.leave the Los Angeles and New York City districts each year.
Tenure or Dismiss after One YearTenure or Dismiss after One Year
We begin with a basic example in which the principal must either dismiss orWe begin with a basic example in which the principal must either dismiss or
tenure a teacher after one year of teaching based on just one year of student value-tenure a teacher after one year of teaching based on just one year of student value-
added data. Figure 1 reports the expected steady-state impact of dismissing a givenadded data. Figure 1 reports the expected steady-state impact of dismissing a given
proportion of teachers (the bottom axis) on value added of the average teacherproportion of teachers (the bottom axis) on value added of the average teacher
(left axis, solid line) and on the proportion of the teacher workforce who are in(left axis, solid line) and on the proportion of the teacher workforce who are in
their first year of teaching (right axis, dashed line).their first year of teaching (right axis, dashed line).
The implications of Figure 1 are stark. First, the simulation suggests thereThe implications of Figure 1 are stark. First, the simulation suggests there
are substantial gains from using value-added information to dismiss ineffectiveare substantial gains from using value-added information to dismiss ineffective
teachers and that the principal should set a very high bar for tenure. To maximizeteachers and that the principal should set a very high bar for tenure. To maximize
Figure 1
Effect of Dismissing a Given Proportion of Novice Teachers Based on One Year
of Data
Notes: Proportion dismissed (x-axis) refers to the proportion of teachers with the lowest value-added
estimates that are dismissed after their first year. The solid line (and left axis) shows the steady state
impact of each proportion dismissed on the value added of the average teacher, including those in their
first year of teaching. Teacher value added is measured in standard deviations of student performance.
The dashed line (and right axis) shows the steady state impact of each proportion dismissed on the
proportion of the teacher workforce in the first (or novice) year of teaching.
Averagevalueadded
.08
.06
.04
.02
0
Proportion dismissed
Proportionnovice
.8
.6
.4
.2
0
Average value added (left axis)
Proportion novice (right axis)
0 .2 .4 .6 .8 1
108 Journal of Economic Perspectives
average value added, about 80 percent of teachers should be dismissed after theiraverage value added, about 80 percent of teachers should be dismissed after their
first year. This aggressive strategy would raise the average value added of teachers infirst year. This aggressive strategy would raise the average value added of teachers in
the school to just over 0.08; put differently, the effectiveness of the average teacherthe school to just over 0.08; put differently, the effectiveness of the average teacher
(including the rookies) would be greater than roughly 70 percent of the tenured(including the rookies) would be greater than roughly 70 percent of the tenured
teachers under the old system. Moreover, it is not the case that most of the gain comesteachers under the old system. Moreover, it is not the case that most of the gain comes
from dismissing the very lowest-performing teachers. Indeed, until the principalfrom dismissing the very lowest-performing teachers. Indeed, until the principal
reaches the optimum, the gain to being increasingly selective in who receives tenurereaches the optimum, the gain to being increasingly selective in who receives tenure
is roughly linear. For example, if the principal dismissed the 40 percent of first-yearis roughly linear. For example, if the principal dismissed the 40 percent of first-year
teachers with the lowest value added, rather than 80 percent, the average value addedteachers with the lowest value added, rather than 80 percent, the average value added
among teachers in the school would increase by roughly 0.045 in the long run.among teachers in the school would increase by roughly 0.045 in the long run.
While these results are surprising relative to current practice, there are aWhile these results are surprising relative to current practice, there are a
number of clear reasons why principals might choose to dismiss a large proportionnumber of clear reasons why principals might choose to dismiss a large proportion
of novice teachers. Even unreliable performance measures such as value added canof novice teachers. Even unreliable performance measures such as value added can
identify substantial and lasting differences across teachers. Differences in teacheridentify substantial and lasting differences across teachers. Differences in teacher
effects are large and persistent relative to the short-lived costs of hiring a neweffects are large and persistent relative to the short-lived costs of hiring a new
teacher. Since the typical teacher getting tenure will teach for ten years or more,teacher. Since the typical teacher getting tenure will teach for ten years or more,
the benefit from setting a high tenure bar will be large. Of course, such unreli-the benefit from setting a high tenure bar will be large. Of course, such unreli-
able measures make mistakes. But the long-run cost of retaining an ineffectiveable measures make mistakes. But the long-run cost of retaining an ineffective
teacher far outweighs the short-run cost of dismissing an effective teacher. More-teacher far outweighs the short-run cost of dismissing an effective teacher. More-
over, because of the uncertainty at the time of hire, new teachers have considerableover, because of the uncertainty at the time of hire, new teachers have considerable
option value; for every five new hires, one will be identified as a highly effectiveoption value; for every five new hires, one will be identified as a highly effective
teacher and provide many years of valuable service.teacher and provide many years of valuable service.
There are many reasons why these simulations could overstate the benefitsThere are many reasons why these simulations could overstate the benefits
or understate the costs of such an aggressive tenure policy, and we have tried toor understate the costs of such an aggressive tenure policy, and we have tried to
enumerate a number of them here. In general, for reasonable variations in theenumerate a number of them here. In general, for reasonable variations in the
parameter values, these issues do not alter our qualitative conclusions.parameter values, these issues do not alter our qualitative conclusions.
First, we may have understated the hiring and firing costs facing a principal.First, we may have understated the hiring and firing costs facing a principal.
As we discussed earlier, the main cost of turnover is the lower effectiveness of newAs we discussed earlier, the main cost of turnover is the lower effectiveness of new
teachers, which corresponds to a cost of well over $100,000 in terms of foregoneteachers, which corresponds to a cost of well over $100,000 in terms of foregone
future student earnings. However, even if we double the difference in value addedfuture student earnings. However, even if we double the difference in value added
between rookies and experienced teachers (that is, from 0.07 to .14 student levelbetween rookies and experienced teachers (that is, from 0.07 to .14 student level
standard deviations), the optimal dismissal rate remains over 75 percent.standard deviations), the optimal dismissal rate remains over 75 percent.
Second, we may have understated turnover rates among tenured teachers, espe-Second, we may have understated turnover rates among tenured teachers, espe-
cially if principals focus on their own school (rather than the district as a whole)cially if principals focus on their own school (rather than the district as a whole)
and highly effective teachers are more likely to move to other schools. Similarly,and highly effective teachers are more likely to move to other schools. Similarly,
principals may discount the future more highly because of their own likelihood ofprincipals may discount the future more highly because of their own likelihood of
leaving the school, or because they believe that teacher effects will not persist intoleaving the school, or because they believe that teacher effects will not persist into
the future (although the evidence suggests otherwise). However, if we double thethe future (although the evidence suggests otherwise). However, if we double the
exogenous annual turnover rate from 5 to 10 percent, the optimal dismissal rateexogenous annual turnover rate from 5 to 10 percent, the optimal dismissal rate
remains over 70 percent.remains over 70 percent.
Third, we may have understated the cost of recruiting teachers. The simulationThird, we may have understated the cost of recruiting teachers. The simulation
indicates that a dismissal rate of 80 percent would result in more than 20 percentindicates that a dismissal rate of 80 percent would result in more than 20 percent
of the workforce being novice teachers at any time, more than double the currentof the workforce being novice teachers at any time, more than double the current
proportion of novices in Los Angeles and New York City. Districts would have toproportion of novices in Los Angeles and New York City. Districts would have to
Searching for Effective Teachers with Imperfect Information 109
hire many more teachers to accommodate this strategy, and these new hires wouldhire many more teachers to accommodate this strategy, and these new hires would
presumably demand higher wages to compensate for the substantial risk of beingpresumably demand higher wages to compensate for the substantial risk of being
dismissed. This is particularly true if we continue to require costly up-front teaching-dismissed. This is particularly true if we continue to require costly up-front teaching-
specific training. However, even a doubling of current teacher salaries would not bespecific training. However, even a doubling of current teacher salaries would not be
enough to offset the benefits of an aggressive dismissal policy, since a .08 annualenough to offset the benefits of an aggressive dismissal policy, since a .08 annual
increase in student achievement is worth more than $100,000 per teacher.increase in student achievement is worth more than $100,000 per teacher.
Fourth, our simulations focus on the steady state, and we have ignored whatFourth, our simulations focus on the steady state, and we have ignored what
happens along the way. This may be important if we discount the earnings of futurehappens along the way. This may be important if we discount the earnings of future
children relative to current children. Specifically, for a school that starts with allchildren relative to current children. Specifically, for a school that starts with all
new teachers, an aggressive dismissal policy will result in high fractions of inexpe-new teachers, an aggressive dismissal policy will result in high fractions of inexpe-
rienced teachers in the short run even if the equilibrium percentage of rookies isrienced teachers in the short run even if the equilibrium percentage of rookies is
lower. For example, if we compare a policy of retaining the top 20 percent of newlower. For example, if we compare a policy of retaining the top 20 percent of new
teachers with retaining 90 percent, average teacher effectiveness would be slightlyteachers with retaining 90 percent, average teacher effectiveness would be slightly
lower in the first two years after implementing the more aggressive policy, turnlower in the first two years after implementing the more aggressive policy, turn
positive in year three, and approach the steady state gains after roughly ten years.positive in year three, and approach the steady state gains after roughly ten years.
Nevertheless, we find the optimal dismissal rate is still above 70 percent for annualNevertheless, we find the optimal dismissal rate is still above 70 percent for annual
discount rates in a reasonable range (say 2 to 8 percent), and falls to 50 percent onlydiscount rates in a reasonable range (say 2 to 8 percent), and falls to 50 percent only
with annual discount rates on the order of 15 percent.with annual discount rates on the order of 15 percent.
Fifth, there may be spillover effects in teaching, where good teachers helpFifth, there may be spillover effects in teaching, where good teachers help
raise the achievement of their colleagues’ students (Jackson and Bruegmann,raise the achievement of their colleagues’ students (Jackson and Bruegmann,
2009; Koedell, forthcoming). This has two offsetting effects in the context of our2009; Koedell, forthcoming). This has two offsetting effects in the context of our
analysis. Spillover effects imply that our estimate of the variation in how teachersanalysis. Spillover effects imply that our estimate of the variation in how teachers
impact theirimpact their own students is overstated (because some of the observed effect is duestudents is overstated (because some of the observed effect is due
to their colleagues). However, if this bias is roughly 20 percent, as suggested byto their colleagues). However, if this bias is roughly 20 percent, as suggested by
Jackson and Bruegmann (2009), so that the true standard deviation in persistentJackson and Bruegmann (2009), so that the true standard deviation in persistent
teacher effects was 0.12 rather than 0.15, the optimal dismissal rate would still be 79teacher effects was 0.12 rather than 0.15, the optimal dismissal rate would still be 79
percent in our model. Moreover, spillover effects will also increase the benefits ofpercent in our model. Moreover, spillover effects will also increase the benefits of
filling schools entirely with highly effective teachers and could easily imply higherfilling schools entirely with highly effective teachers and could easily imply higher
optimal dismissal rates.optimal dismissal rates.
Sixth, we have assumed that teachers who do not receive tenure exit the teachingSixth, we have assumed that teachers who do not receive tenure exit the teaching
workforce. If teaching effectiveness is measured with error and principals have noworkforce. If teaching effectiveness is measured with error and principals have no
power to screen among candidates, then dismissed teachers could move to anotherpower to screen among candidates, then dismissed teachers could move to another
school and hope for better luck in their evaluation. If this occurred, the average qualityschool and hope for better luck in their evaluation. If this occurred, the average quality
of the applicant pool would decline. This type of phenomenon—poorly performingof the applicant pool would decline. This type of phenomenon—poorly performing
teachers moving to new schools, typically those serving more disadvantaged studentsteachers moving to new schools, typically those serving more disadvantaged students
(discussed in Boyd, Grossman, Lankford, Loeb, and Wyckoff, 2008)—is already well-(discussed in Boyd, Grossman, Lankford, Loeb, and Wyckoff, 2008)—is already well-
known in education, and is referred to as “the dance of the lemons.” This suggestsknown in education, and is referred to as “the dance of the lemons.” This suggests
that principals could benefit their colleagues at other schools by sharing performancethat principals could benefit their colleagues at other schools by sharing performance
information on teachers. However, if schools were highly selective in granting tenure, itinformation on teachers. However, if schools were highly selective in granting tenure, it
might also be true that teachers who receive a bad signal regarding their effectivenessmight also be true that teachers who receive a bad signal regarding their effectiveness
would have less incentive to “shop around.”would have less incentive to “shop around.”99
9
A similar complication arises if teaching skills are partially related to subject matter, grade level, or
the teacher–school match. The evidence on the specificity of teaching skill is mixed (Boyd, Grossman,
110 Journal of Economic Perspectives
Seventh, there is evidence that the impact of a teacher on the achievement ofSeventh, there is evidence that the impact of a teacher on the achievement of
current students may fade out over time as those students progress through theircurrent students may fade out over time as those students progress through their
remaining years of school (Jacob, Lefgren, and Sims, 2008; Kane and Staiger,remaining years of school (Jacob, Lefgren, and Sims, 2008; Kane and Staiger,
2008). It is unclear whether this greatly weakens the case for raising teacher quality.2008). It is unclear whether this greatly weakens the case for raising teacher quality.
We do not know whether fadeout is a general phenomenon or whether it is a resultWe do not know whether fadeout is a general phenomenon or whether it is a result
of current levels of heterogeneity in teacher effectiveness. For example, having aof current levels of heterogeneity in teacher effectiveness. For example, having a
highly effective teacher in the previous year may do students little good if they arehighly effective teacher in the previous year may do students little good if they are
placed with a highly ineffective teacher this year, or if their classmates were placedplaced with a highly ineffective teacher this year, or if their classmates were placed
with a highly ineffective teacher the previous year. In other words, teacher effectswith a highly ineffective teacher the previous year. In other words, teacher effects
might not fade out if a group of students is given a sequence of highly effectivemight not fade out if a group of students is given a sequence of highly effective
teachers. Moreover, raising a student’s academic achievement as measured in ateachers. Moreover, raising a student’s academic achievement as measured in a
particular grade may still be valuable even if the student’s score in later grade levelsparticular grade may still be valuable even if the student’s score in later grade levels
do not remain at the improved level. For instance, a better knowledge of numericaldo not remain at the improved level. For instance, a better knowledge of numerical
operations may still be valuable in the labor market even if it does not lead to betteroperations may still be valuable in the labor market even if it does not lead to better
test scores in algebra. Nevertheless, we do view “fade-out” as a primary empiricaltest scores in algebra. Nevertheless, we do view “fade-out” as a primary empirical
issue, not just in studies of teachers, but in studies of educational interventionsissue, not just in studies of teachers, but in studies of educational interventions
more broadly (for example, Currie and Thomas, 1995).more broadly (for example, Currie and Thomas, 1995).
Finally, we may have overstated the reliability of value-added measures. WeFinally, we may have overstated the reliability of value-added measures. We
address this issue in considerable detail below. However, even if we cut the reli-address this issue in considerable detail below. However, even if we cut the reli-
ability of value added in half (from 40 to 20 percent), the optimal dismissal rateability of value added in half (from 40 to 20 percent), the optimal dismissal rate
remains over 70 percent.remains over 70 percent.
The Effect of Changing the Time to Tenure ReviewThe Effect of Changing the Time to Tenure Review
In our next set of simulations, we evaluate how changing the time until tenureIn our next set of simulations, we evaluate how changing the time until tenure
review affects the optimal dismissal rate and the average value added of teachers.review affects the optimal dismissal rate and the average value added of teachers.
The first column of Table 2 repeats the results from our benchmark simulationsThe first column of Table 2 repeats the results from our benchmark simulations
in which dismissal could only occur at the end of the first year. The next threein which dismissal could only occur at the end of the first year. The next three
columns allow the principal to delay tenure review until the second, third, orcolumns allow the principal to delay tenure review until the second, third, or
fourth year, and to gather more information about teacher effectiveness beforefourth year, and to gather more information about teacher effectiveness before
making a decision regarding dismissal. The next three columnsmaking a decision regarding dismissal. The next three columns require a delay ina delay in
tenure review for 2 to 4 years, so that dismissal can occur only after multiple yearstenure review for 2 to 4 years, so that dismissal can occur only after multiple years
of value-added data are available to the principal.of value-added data are available to the principal.
Not surprisingly, giving a principal the option of waiting to gather more infor-Not surprisingly, giving a principal the option of waiting to gather more infor-
mation produces some benefits. Average value added rises to about 0.10 standardmation produces some benefits. Average value added rises to about 0.10 standard
deviations with the possibility of delaying tenure review to the fourth year, withdeviations with the possibility of delaying tenure review to the fourth year, with
most of the gain coming from delaying tenure until the second year. Even with themost of the gain coming from delaying tenure until the second year. Even with the
option to delay the tenure decision, the principal would still dismiss two-thirds ofoption to delay the tenure decision, the principal would still dismiss two-thirds of
Lankford, Loeb, and Wyckoff, 2008; Lockwood and McCaffrey, 2009; Jackson, 2010), but it is reason-
able to believe that, say, a mediocre teacher of high school physics in Harlem may have made a good
fifth grade math teacher in Brooklyn Heights, or vice versa. If principals do have access to informa-
tion on the past performance of teachers who did not make tenure, specificity in skill can simply be
interpreted as an additional source of error. This may lead principals to be more willing to “take a
chance” on a teacher who just missed tenure by trying them in a different subject, grade, or teaching
environment.
Douglas O. Staiger and Jonah E. Rockoff 111
new hires after the first year, but would wait to dismiss some teachers for whomnew hires after the first year, but would wait to dismiss some teachers for whom
there is a reasonable chance that an additional year of data could lead to a betterthere is a reasonable chance that an additional year of data could lead to a better
decision. Intuitively, the cut-off score for dismissing a new teacher rises with timedecision. Intuitively, the cut-off score for dismissing a new teacher rises with time
on the job, because the option value of waiting to dismiss a teacher declines as theon the job, because the option value of waiting to dismiss a teacher declines as the
principal accumulates better information. In other words, to avoid unnecessaryprincipal accumulates better information. In other words, to avoid unnecessary
turnover the principal may choose to wait a year before dismissing a teacher whoturnover the principal may choose to wait a year before dismissing a teacher who
the principal believes is “below the bar” so long as there is a reasonable chancethe principal believes is “below the bar” so long as there is a reasonable chance
that this evaluation could change. Thus, the principal dismisses teachers whosethat this evaluation could change. Thus, the principal dismisses teachers whose
expected effectiveness lies below a bar that increases with teacher experience.expected effectiveness lies below a bar that increases with teacher experience.
Overall dismissal rates do not change much as the principal is allowed to wait untilOverall dismissal rates do not change much as the principal is allowed to wait until
year 2, 3, or 4 to make a decision, but the extra time allows the principal to betteryear 2, 3, or 4 to make a decision, but the extra time allows the principal to better
identify the remaining subset of teachers for tenure.identify the remaining subset of teachers for tenure.
In contrast,In contrast, requiring principals to delay tenure review—that is, removing theprincipals to delay tenure review—that is, removing the
option of dismissal until year 2, 3, or 4—would lead to lower average teacher valueoption of dismissal until year 2, 3, or 4—would lead to lower average teacher value
added, relative to the baseline case. Essentially, this policy forces principals toadded, relative to the baseline case. Essentially, this policy forces principals to
retain low-performing teachers additional years, and this outweighs the benefits ofretain low-performing teachers additional years, and this outweighs the benefits of
the additional information the principal would obtain by waiting to see additionalthe additional information the principal would obtain by waiting to see additional
years of performance data. Note that this policy also leads to fewer teachers beingyears of performance data. Note that this policy also leads to fewer teachers being
dismissed overall, since the option value of hiring a new teacher (who may turn outdismissed overall, since the option value of hiring a new teacher (who may turn out
to be ineffective and must be retained for several years) has fallen.to be ineffective and must be retained for several years) has fallen.
Obtaining More Reliable Information at the Time of HireObtaining More Reliable Information at the Time of Hire
We have assumed that principals have no useful information at the time of hire.We have assumed that principals have no useful information at the time of hire.
This implies that radical increases in hiring rates (as required by a dismissal rateThis implies that radical increases in hiring rates (as required by a dismissal rate
of 80 percent) do not affect the quality of new hires—each individual is a randomof 80 percent) do not affect the quality of new hires—each individual is a random
Table 2
Effect of Delaying Tenure Decisions beyond the First Year, Options vs. Requirements
Baseline:
Dismissal at
T = 1
Dismissal allowed
at any time until
Require dismissal
only occur at time
T = 1 T = 2 T = 3 T = 4 T = 2 T = 3 T = 4
Average value added 0.080 0.095 0.099 0.101 0.075 0.068 0.061
% Dismissed overall 81% 83% 84% 84% 75% 71% 68%
% Dismissed annually
At T = 1 81% 67% 67% 67%
At T = 2 16% 8% 8% 75%
At T = 3 9% 4% 71%
At T = 4 5% 68%
Notes: Average value added refers to the average level of teachers’ value-added estimates in the steady
state under an optimal dismissal policy, and it includes both untenured and tenured teachers. (Teacher
value added is measured in standard deviations of student performance.) “Percentages dismissed”
refers to the percent of a single cohort of newly hired teachers dismissed during years leading up to
when a tenure decision is required (year T ).
112 Journal of Economic Perspectives
draw from a generally qualified applicant pool. But many districts and principalsdraw from a generally qualified applicant pool. But many districts and principals
put substantial effort into screening and interviewing new hires, suggesting thatput substantial effort into screening and interviewing new hires, suggesting that
even small amounts of information at the time of hire may be valuable.even small amounts of information at the time of hire may be valuable.
Figure 2 shows how changing the reliability of the pre-hire signal affects theFigure 2 shows how changing the reliability of the pre-hire signal affects the
optimal dismissal rate (right axis, dashed line), and the resulting value added ofoptimal dismissal rate (right axis, dashed line), and the resulting value added of
the average teacher in the school (left axis, solid line). For these simulations, wethe average teacher in the school (left axis, solid line). For these simulations, we
assumed that the principal could only dismiss teachers after the first year (assumed that the principal could only dismiss teachers after the first year (T == 1).1).
We also assumed that the pool of potential applicants was ten times the numberWe also assumed that the pool of potential applicants was ten times the number
needed to replace teachers leaving through exogenous turnover, corresponding toneeded to replace teachers leaving through exogenous turnover, corresponding to
estimates that New York City and Los Angeles currently have about 10 applicantsestimates that New York City and Los Angeles currently have about 10 applicants
for each position. Our baseline simulation corresponds to a reliability of 0 in thefor each position. Our baseline simulation corresponds to a reliability of 0 in the
pre-hire signal, at the far left in this figure.pre-hire signal, at the far left in this figure.
Figure 2 suggests that pre-hire information on teacher effectiveness is poten-Figure 2 suggests that pre-hire information on teacher effectiveness is poten-
tially quite valuable. Compared to having no information at the time of hire, atially quite valuable. Compared to having no information at the time of hire, a
Figure 2
Effect of Increasing the Reliability of the Pre-hire Performance Signal on
Value Added of Average Teacher and Proportion of Teachers Dismissed after
One Year
Notes: Reliability (x-axis) refers to the proportion of variance in the pre-hire performance signal that
is due to the persistent component of teacher performance. The solid line (and left axis) shows the
steady state impact of reliability on the value added of the average teacher, including those in their
first year of teaching, based on the optimal proportion of teachers dismissed after one year. (Teacher
value added is measured in standard deviations of student performance.) The dashed line (and right
axis) shows the steady state impact of reliability on the optimal proportion dismissed after one year.
Proportiondismissed
Reliability of pre-hire performance signal
Averagevalueadded
Average value added (left axis)
Proportion dismissed (right axis)
0 .2 .4 .6 .8 1
.25
.2
.15
.1
.8
.6
.4
.2
0
Searching for Effective Teachers with Imperfect Information 113
perfect pre-hire signal with 100 percent reliability would nearly triple the gain toperfect pre-hire signal with 100 percent reliability would nearly triple the gain to
the value added of the teacher workforce, and of course would eliminate the needthe value added of the teacher workforce, and of course would eliminate the need
to dismiss teachers after hire. More interestingly, even a low reliability signal ofto dismiss teachers after hire. More interestingly, even a low reliability signal of
20 percent at the time of hire doubles the gain to the value added of the teacher20 percent at the time of hire doubles the gain to the value added of the teacher
workforce relative to the benchmark case with no pre-hire information. However,workforce relative to the benchmark case with no pre-hire information. However,
access to a pre-hire signal does not eliminate the need to dismiss additional teachersaccess to a pre-hire signal does not eliminate the need to dismiss additional teachers
after hire. As long as there is remaining uncertainty about teacher effectivenessafter hire. As long as there is remaining uncertainty about teacher effectiveness
among the teachers that are hired, there will be a benefit to dismissing additionalamong the teachers that are hired, there will be a benefit to dismissing additional
teachers after observing classroom performance.teachers after observing classroom performance.
Obtaining More Reliable Measures of On-the-Job PerformanceObtaining More Reliable Measures of On-the-Job Performance
Figure 3 shows how changing the reliability of the on-the-job signal affects theFigure 3 shows how changing the reliability of the on-the-job signal affects the
optimal timing of tenure (regions delineated by dotted lines, labeled at top), theoptimal timing of tenure (regions delineated by dotted lines, labeled at top), the
optimal dismissal rate (right axis, dashed line), and the resulting value added ofoptimal dismissal rate (right axis, dashed line), and the resulting value added of
the average teacher in the school (left axis, solid line). For these simulations, wethe average teacher in the school (left axis, solid line). For these simulations, we
assumed that the principal could only dismiss teachers at tenure time (assumed that the principal could only dismiss teachers at tenure time (T).).
Many school districts are currently engaged in efforts to improve the reliabilityMany school districts are currently engaged in efforts to improve the reliability
with which they can measure teacher performance, through the use of additionalwith which they can measure teacher performance, through the use of additional
information from classroom observation, student work, and student or parentinformation from classroom observation, student work, and student or parent
surveys. Figure 3 suggests that more reliable measures of teacher performancesurveys. Figure 3 suggests that more reliable measures of teacher performance
are quite valuable. Relative to our baseline simulation, in which reliability of theare quite valuable. Relative to our baseline simulation, in which reliability of the
annual performance measure was 40 percent (.4 in the figure), a measure withannual performance measure was 40 percent (.4 in the figure), a measure with
perfect reliability would nearly double the gains from selecting effective teachers (toperfect reliability would nearly double the gains from selecting effective teachers (to
0.14 standard deviations) while having little impact on the proportion of teachers0.14 standard deviations) while having little impact on the proportion of teachers
dismissed. If districts relied on performance measures that were less reliable thandismissed. If districts relied on performance measures that were less reliable than
our baseline case, the gains from selecting effective teachers would be reduced, andour baseline case, the gains from selecting effective teachers would be reduced, and
it would become optimal for the principal to wait longer before dismissing a teacher.it would become optimal for the principal to wait longer before dismissing a teacher.
Interestingly, the proportion of teachers dismissed does not decline much until theInterestingly, the proportion of teachers dismissed does not decline much until the
reliability of the performance measure drops below 5 percent (.05 in the figure).reliability of the performance measure drops below 5 percent (.05 in the figure).
Even very weak signals of teacher performance eventually identify differencesEven very weak signals of teacher performance eventually identify differences
between teachers that make the benefits of selectively awarding tenure swamp thebetween teachers that make the benefits of selectively awarding tenure swamp the
cost of having to hire additional inexperienced teachers.cost of having to hire additional inexperienced teachers.
ConclusionConclusion
In the ongoing debate over how to improve teaching quality in public schools,In the ongoing debate over how to improve teaching quality in public schools,
there have been conflicting claims regarding the usefulness of currently availablethere have been conflicting claims regarding the usefulness of currently available
measures of teacher effectiveness. For example, in reference to a proposed initia-measures of teacher effectiveness. For example, in reference to a proposed initia-
tive to measure teacher effectiveness using student test scores, the head of the Newtive to measure teacher effectiveness using student test scores, the head of the New
York City teachers’ union Randi Weingarten stated: “There is no way that any of thisYork City teachers’ union Randi Weingarten stated: “There is no way that any of this
current data could actually, fairly, honestly or with any integrity be used to isolate thecurrent data could actually, fairly, honestly or with any integrity be used to isolate the
contributions of an individual teacher” (as reported by Medina, 2008). In contrast, thecontributions of an individual teacher” (as reported by Medina, 2008). In contrast, the
U.S. Secretary of Education Arne Duncan (2009) has stated: “I have an open mindU.S. Secretary of Education Arne Duncan (2009) has stated: “I have an open mind
114 Journal of Economic Perspectives
about teacher evaluation, but we need to find a way to measure classroom success andabout teacher evaluation, but we need to find a way to measure classroom success and
teacher effectiveness. Pretending that student outcomes are not part of the equation isteacher effectiveness. Pretending that student outcomes are not part of the equation is
like pretending that professional basketball has nothing to do with the score.”like pretending that professional basketball has nothing to do with the score.”
Given the available evidence, we have tried to evaluate systematically howGiven the available evidence, we have tried to evaluate systematically how
school leaders should use the currently available but imperfect measures of teacherschool leaders should use the currently available but imperfect measures of teacher
effectiveness to recruit, evaluate, and retain teachers. Our simulations suggesteffectiveness to recruit, evaluate, and retain teachers. Our simulations suggest
that using existing information on teacher performance to aggressively selectthat using existing information on teacher performance to aggressively select
teachers would yield substantial annual gains in academic achievement of aroundteachers would yield substantial annual gains in academic achievement of around
0.08 student level standard deviations. These are comparable to the annual test0.08 student level standard deviations. These are comparable to the annual test
score gains found in recent experimental evaluations of charter schools (Hoxbyscore gains found in recent experimental evaluations of charter schools (Hoxby
and Murarka, 2009; Abdulkadiroglu, Angrist, Dynarski, Kane, and Pathak, 2009)and Murarka, 2009; Abdulkadiroglu, Angrist, Dynarski, Kane, and Pathak, 2009)
Figure 3
Effect of Reliability of the Annual Performance Measure on Optimal Timing of
Tenure, Optimal Dismissal Rate, and Value Added of Average Teacher
Proportiondismissed
Reliability of annual performance measure
Averagevalueadded
Average value added (left axis)
Proportion dismissed (right axis)
0 .1 .2 .3 .4 .5 .6 .7 .8 .9 1
.16
.14
.12
.1
.08
.06
.04
.02
0
.8
.7
.6
.5
.4
.3
.2
.1
0
T = 3 T = 2 T = 1T > 3
Notes: Figure 3 shows how changing the reliability of the on-the-job signal affects the optimal timing
of tenure (regions delineated by dotted lines, labeled at top), the optimal dismissal rate (right axis,
dashed line), and the resulting value added of the average teacher in the school (left axis, solid line).
For these simulations, we assumed that the principal could only dismiss teachers at tenure time (T).
Reliability (x-axis) refers to the correlation of the annual performance measure across years within
the same teacher. The dashed line (and right axis) shows the steady state impact of reliability on the
proportion dismissed. The solid line (and left axis) shows the steady state impact of reliability on
the value added of the average teacher, including those in their first year of teaching, based on the
optimal proportion of teachers dismissed after the optimal waiting period (T). (Teacher value added
is measured in standard deviations of student performance.) The regions separated by horizontal
dotted lines denote the optimal year in which the tenure decision should be made (T) for different
levels of reliability.
Evidence on Teacher Effectiveness and Implications for Recruitment, Evaluation, and Retention

Más contenido relacionado

La actualidad más candente

Assignmnt of pd 2
Assignmnt of pd 2Assignmnt of pd 2
Assignmnt of pd 2shainaanwar
 
Analysis of teachers motivation on the overall performance of public basic sc...
Analysis of teachers motivation on the overall performance of public basic sc...Analysis of teachers motivation on the overall performance of public basic sc...
Analysis of teachers motivation on the overall performance of public basic sc...Alexander Decker
 
Lit Review Power Point
Lit Review Power PointLit Review Power Point
Lit Review Power Pointquincybryant
 
Analysis of teachers motivation on the overall performance of
Analysis of teachers motivation on the overall performance ofAnalysis of teachers motivation on the overall performance of
Analysis of teachers motivation on the overall performance ofAlexander Decker
 
Job satisfaction level among public and private university teachers
Job satisfaction level among  public and private university teachersJob satisfaction level among  public and private university teachers
Job satisfaction level among public and private university teachersAhasan Uddin Bhuiyan
 
Save us from the time of trial
Save us from the time of trialSave us from the time of trial
Save us from the time of trialMartin Brown
 
RESEARCH PROPOSAL
RESEARCH PROPOSALRESEARCH PROPOSAL
RESEARCH PROPOSALAin Manan
 
Application of nursing theories in evaluation
Application of nursing theories in evaluationApplication of nursing theories in evaluation
Application of nursing theories in evaluationArun Madanan
 
Research methodology
Research methodologyResearch methodology
Research methodologyAin Manan
 
PBL NY: Bringing PBL to Scale
PBL NY:  Bringing PBL to ScalePBL NY:  Bringing PBL to Scale
PBL NY: Bringing PBL to Scalemmcdowell13
 
Leader member exchange of maguidanaon school heads
Leader member exchange of maguidanaon school headsLeader member exchange of maguidanaon school heads
Leader member exchange of maguidanaon school headsErnie Cerado
 
Towards a framework of teaching effectiveness in public
Towards a framework of teaching effectiveness in publicTowards a framework of teaching effectiveness in public
Towards a framework of teaching effectiveness in publicjaderex
 
School Climate, Teachers’ Efficiency and Learning Outcomes
School Climate, Teachers’ Efficiency and Learning OutcomesSchool Climate, Teachers’ Efficiency and Learning Outcomes
School Climate, Teachers’ Efficiency and Learning OutcomesErnie Cerado
 
School Based Factors Influencing Preschool Teachers Job Performance in Public...
School Based Factors Influencing Preschool Teachers Job Performance in Public...School Based Factors Influencing Preschool Teachers Job Performance in Public...
School Based Factors Influencing Preschool Teachers Job Performance in Public...paperpublications3
 
Merit Pay Presentation - Nicholas Pitt - EDUC 6232
Merit Pay Presentation - Nicholas Pitt - EDUC 6232Merit Pay Presentation - Nicholas Pitt - EDUC 6232
Merit Pay Presentation - Nicholas Pitt - EDUC 6232brikah
 

La actualidad más candente (19)

Assignmnt of pd 2
Assignmnt of pd 2Assignmnt of pd 2
Assignmnt of pd 2
 
Analysis of teachers motivation on the overall performance of public basic sc...
Analysis of teachers motivation on the overall performance of public basic sc...Analysis of teachers motivation on the overall performance of public basic sc...
Analysis of teachers motivation on the overall performance of public basic sc...
 
Lit Review Power Point
Lit Review Power PointLit Review Power Point
Lit Review Power Point
 
Analysis of teachers motivation on the overall performance of
Analysis of teachers motivation on the overall performance ofAnalysis of teachers motivation on the overall performance of
Analysis of teachers motivation on the overall performance of
 
Job satisfaction level among public and private university teachers
Job satisfaction level among  public and private university teachersJob satisfaction level among  public and private university teachers
Job satisfaction level among public and private university teachers
 
Save us from the time of trial
Save us from the time of trialSave us from the time of trial
Save us from the time of trial
 
RESEARCH PROPOSAL
RESEARCH PROPOSALRESEARCH PROPOSAL
RESEARCH PROPOSAL
 
Nij
NijNij
Nij
 
Application of nursing theories in evaluation
Application of nursing theories in evaluationApplication of nursing theories in evaluation
Application of nursing theories in evaluation
 
Research methodology
Research methodologyResearch methodology
Research methodology
 
PBL NY: Bringing PBL to Scale
PBL NY:  Bringing PBL to ScalePBL NY:  Bringing PBL to Scale
PBL NY: Bringing PBL to Scale
 
Leader member exchange of maguidanaon school heads
Leader member exchange of maguidanaon school headsLeader member exchange of maguidanaon school heads
Leader member exchange of maguidanaon school heads
 
Towards a framework of teaching effectiveness in public
Towards a framework of teaching effectiveness in publicTowards a framework of teaching effectiveness in public
Towards a framework of teaching effectiveness in public
 
School Climate, Teachers’ Efficiency and Learning Outcomes
School Climate, Teachers’ Efficiency and Learning OutcomesSchool Climate, Teachers’ Efficiency and Learning Outcomes
School Climate, Teachers’ Efficiency and Learning Outcomes
 
School Based Factors Influencing Preschool Teachers Job Performance in Public...
School Based Factors Influencing Preschool Teachers Job Performance in Public...School Based Factors Influencing Preschool Teachers Job Performance in Public...
School Based Factors Influencing Preschool Teachers Job Performance in Public...
 
Topic 4 EDUC6353
Topic 4 EDUC6353Topic 4 EDUC6353
Topic 4 EDUC6353
 
Need for change in education
Need for change in educationNeed for change in education
Need for change in education
 
S1 msn theory_of_action
S1 msn theory_of_actionS1 msn theory_of_action
S1 msn theory_of_action
 
Merit Pay Presentation - Nicholas Pitt - EDUC 6232
Merit Pay Presentation - Nicholas Pitt - EDUC 6232Merit Pay Presentation - Nicholas Pitt - EDUC 6232
Merit Pay Presentation - Nicholas Pitt - EDUC 6232
 

Destacado

Film trailer planning
Film trailer planningFilm trailer planning
Film trailer planninge m
 
Actividad 3 tv_esmer_leonel_amorocho_abril
Actividad 3 tv_esmer_leonel_amorocho_abrilActividad 3 tv_esmer_leonel_amorocho_abril
Actividad 3 tv_esmer_leonel_amorocho_abrilleonelabril
 
2017ko Euskal Autonomi Erkidegoko Ekonomia aurreikuspenak
2017ko Euskal Autonomi Erkidegoko Ekonomia aurreikuspenak2017ko Euskal Autonomi Erkidegoko Ekonomia aurreikuspenak
2017ko Euskal Autonomi Erkidegoko Ekonomia aurreikuspenakLABORAL Kutxa
 
Crecimiento económico sostenido
Crecimiento económico sostenidoCrecimiento económico sostenido
Crecimiento económico sostenidoAdonike Ramirez
 
Hub or not to hub - Alison Blay-Palmer & Philip Mount
Hub or not to hub - Alison Blay-Palmer & Philip MountHub or not to hub - Alison Blay-Palmer & Philip Mount
Hub or not to hub - Alison Blay-Palmer & Philip MountLocal Food
 
Presentación de Esquemas felipe
Presentación de Esquemas felipePresentación de Esquemas felipe
Presentación de Esquemas felipeFelipe Cabral
 
Application of Lean Tools in the Oil Field Safety Management
Application of Lean Tools in the Oil Field Safety ManagementApplication of Lean Tools in the Oil Field Safety Management
Application of Lean Tools in the Oil Field Safety ManagementIJERA Editor
 
Character profiles
Character profilesCharacter profiles
Character profilesEllenorHandy
 
Planeación programa de radio1
Planeación programa de radio1Planeación programa de radio1
Planeación programa de radio1Malena Ortega
 
Brujas lineas rectas y curvas
Brujas lineas rectas y curvasBrujas lineas rectas y curvas
Brujas lineas rectas y curvasnoeliach
 

Destacado (20)

Folletos de sis[1]para_publiocar
Folletos de sis[1]para_publiocarFolletos de sis[1]para_publiocar
Folletos de sis[1]para_publiocar
 
Film trailer planning
Film trailer planningFilm trailer planning
Film trailer planning
 
FINAL REPORT_ Pradnya
FINAL REPORT_ PradnyaFINAL REPORT_ Pradnya
FINAL REPORT_ Pradnya
 
Actividad 3 tv_esmer_leonel_amorocho_abril
Actividad 3 tv_esmer_leonel_amorocho_abrilActividad 3 tv_esmer_leonel_amorocho_abril
Actividad 3 tv_esmer_leonel_amorocho_abril
 
MMRIResearch
MMRIResearchMMRIResearch
MMRIResearch
 
My Experience at VSM
My Experience at VSMMy Experience at VSM
My Experience at VSM
 
Revista senati 77
Revista senati 77 Revista senati 77
Revista senati 77
 
2017ko Euskal Autonomi Erkidegoko Ekonomia aurreikuspenak
2017ko Euskal Autonomi Erkidegoko Ekonomia aurreikuspenak2017ko Euskal Autonomi Erkidegoko Ekonomia aurreikuspenak
2017ko Euskal Autonomi Erkidegoko Ekonomia aurreikuspenak
 
FB posts
FB postsFB posts
FB posts
 
Act1 vhc.pptx
Act1 vhc.pptxAct1 vhc.pptx
Act1 vhc.pptx
 
Crecimiento económico sostenido
Crecimiento económico sostenidoCrecimiento económico sostenido
Crecimiento económico sostenido
 
CONCURSO CARNAVAL DE NIZA
CONCURSO CARNAVAL DE NIZACONCURSO CARNAVAL DE NIZA
CONCURSO CARNAVAL DE NIZA
 
Hub or not to hub - Alison Blay-Palmer & Philip Mount
Hub or not to hub - Alison Blay-Palmer & Philip MountHub or not to hub - Alison Blay-Palmer & Philip Mount
Hub or not to hub - Alison Blay-Palmer & Philip Mount
 
Presentación de Esquemas felipe
Presentación de Esquemas felipePresentación de Esquemas felipe
Presentación de Esquemas felipe
 
Application of Lean Tools in the Oil Field Safety Management
Application of Lean Tools in the Oil Field Safety ManagementApplication of Lean Tools in the Oil Field Safety Management
Application of Lean Tools in the Oil Field Safety Management
 
Character profiles
Character profilesCharacter profiles
Character profiles
 
Planeación programa de radio1
Planeación programa de radio1Planeación programa de radio1
Planeación programa de radio1
 
Turismo no Espaço Rural - Açores
Turismo no Espaço Rural - AçoresTurismo no Espaço Rural - Açores
Turismo no Espaço Rural - Açores
 
Brujas lineas rectas y curvas
Brujas lineas rectas y curvasBrujas lineas rectas y curvas
Brujas lineas rectas y curvas
 
Mystery Shopping
Mystery ShoppingMystery Shopping
Mystery Shopping
 

Similar a Evidence on Teacher Effectiveness and Implications for Recruitment, Evaluation, and Retention

Hattie teachers makea_difference
Hattie teachers makea_differenceHattie teachers makea_difference
Hattie teachers makea_differenceTria Azizah
 
Value-Added Assessment
Value-Added AssessmentValue-Added Assessment
Value-Added Assessmentswoodring
 
Thesis Teacher Pay & Student Performance Damy Duifhuis versie 09-07-2016
Thesis Teacher Pay & Student Performance Damy Duifhuis versie 09-07-2016Thesis Teacher Pay & Student Performance Damy Duifhuis versie 09-07-2016
Thesis Teacher Pay & Student Performance Damy Duifhuis versie 09-07-2016Damy Duifhuis
 
Effect of teaching method, choice of discipline and student lecturer relation...
Effect of teaching method, choice of discipline and student lecturer relation...Effect of teaching method, choice of discipline and student lecturer relation...
Effect of teaching method, choice of discipline and student lecturer relation...Alexander Decker
 
Value –Added Assessment
Value –Added AssessmentValue –Added Assessment
Value –Added Assessmenttammieedwards
 
Re-balancing Assessment_CEPA whitepaper_HofmanGoodwinKahl_Feb2015 (1)
Re-balancing Assessment_CEPA whitepaper_HofmanGoodwinKahl_Feb2015  (1)Re-balancing Assessment_CEPA whitepaper_HofmanGoodwinKahl_Feb2015  (1)
Re-balancing Assessment_CEPA whitepaper_HofmanGoodwinKahl_Feb2015 (1)Peter Hofman
 
C:\Users\Eric Sr\Desktop\Harpers Value Added Presentation
C:\Users\Eric Sr\Desktop\Harpers Value Added PresentationC:\Users\Eric Sr\Desktop\Harpers Value Added Presentation
C:\Users\Eric Sr\Desktop\Harpers Value Added PresentationSmith Elementary
 
What makes-great-teaching-final-4.11.14
What makes-great-teaching-final-4.11.14What makes-great-teaching-final-4.11.14
What makes-great-teaching-final-4.11.14mitch0101
 
Motivation, Satisfaction and Performance of College Teachers and Administrato...
Motivation, Satisfaction and Performance of College Teachers and Administrato...Motivation, Satisfaction and Performance of College Teachers and Administrato...
Motivation, Satisfaction and Performance of College Teachers and Administrato...QUESTJOURNAL
 
ppt two.pptdddfdvserfvwerwerfgvwrtvfdvvfe
ppt two.pptdddfdvserfvwerwerfgvwrtvfdvvfeppt two.pptdddfdvserfvwerwerfgvwrtvfdvvfe
ppt two.pptdddfdvserfvwerwerfgvwrtvfdvvfeSirajudinAkmel1
 
Achievement level and school climate of primary schools teachers
Achievement level and school climate of primary schools teachersAchievement level and school climate of primary schools teachers
Achievement level and school climate of primary schools teachersAlexander Decker
 
What makes-great-teaching?
What makes-great-teaching?What makes-great-teaching?
What makes-great-teaching?Scott Miller
 
Task Assessment of Fourth and Fifth Grade Teachers
Task Assessment of Fourth and Fifth Grade TeachersTask Assessment of Fourth and Fifth Grade Teachers
Task Assessment of Fourth and Fifth Grade TeachersChristopher Peter Makris
 
Teal Modern and Minimalist Thesis Defense Presentation (2).pptx
Teal Modern and Minimalist Thesis Defense Presentation (2).pptxTeal Modern and Minimalist Thesis Defense Presentation (2).pptx
Teal Modern and Minimalist Thesis Defense Presentation (2).pptxAlliahJoycePelaez1
 
Borgemenke, arthur j examining recurring critical events schooling v5 n1 2014
Borgemenke, arthur j examining recurring critical events schooling v5 n1 2014Borgemenke, arthur j examining recurring critical events schooling v5 n1 2014
Borgemenke, arthur j examining recurring critical events schooling v5 n1 2014William Kritsonis
 
Teacher evaluation presentation oregon
Teacher evaluation presentation   oregonTeacher evaluation presentation   oregon
Teacher evaluation presentation oregonJohn Cronin
 

Similar a Evidence on Teacher Effectiveness and Implications for Recruitment, Evaluation, and Retention (20)

Hattie teachers makea_difference
Hattie teachers makea_differenceHattie teachers makea_difference
Hattie teachers makea_difference
 
40 44
40 4440 44
40 44
 
Value-Added Assessment
Value-Added AssessmentValue-Added Assessment
Value-Added Assessment
 
Thesis Teacher Pay & Student Performance Damy Duifhuis versie 09-07-2016
Thesis Teacher Pay & Student Performance Damy Duifhuis versie 09-07-2016Thesis Teacher Pay & Student Performance Damy Duifhuis versie 09-07-2016
Thesis Teacher Pay & Student Performance Damy Duifhuis versie 09-07-2016
 
Effect of teaching method, choice of discipline and student lecturer relation...
Effect of teaching method, choice of discipline and student lecturer relation...Effect of teaching method, choice of discipline and student lecturer relation...
Effect of teaching method, choice of discipline and student lecturer relation...
 
Value –Added Assessment
Value –Added AssessmentValue –Added Assessment
Value –Added Assessment
 
02
0202
02
 
Re-balancing Assessment_CEPA whitepaper_HofmanGoodwinKahl_Feb2015 (1)
Re-balancing Assessment_CEPA whitepaper_HofmanGoodwinKahl_Feb2015  (1)Re-balancing Assessment_CEPA whitepaper_HofmanGoodwinKahl_Feb2015  (1)
Re-balancing Assessment_CEPA whitepaper_HofmanGoodwinKahl_Feb2015 (1)
 
C:\Users\Eric Sr\Desktop\Harpers Value Added Presentation
C:\Users\Eric Sr\Desktop\Harpers Value Added PresentationC:\Users\Eric Sr\Desktop\Harpers Value Added Presentation
C:\Users\Eric Sr\Desktop\Harpers Value Added Presentation
 
What makes-great-teaching-final-4.11.14
What makes-great-teaching-final-4.11.14What makes-great-teaching-final-4.11.14
What makes-great-teaching-final-4.11.14
 
Motivation, Satisfaction and Performance of College Teachers and Administrato...
Motivation, Satisfaction and Performance of College Teachers and Administrato...Motivation, Satisfaction and Performance of College Teachers and Administrato...
Motivation, Satisfaction and Performance of College Teachers and Administrato...
 
ppt two.pptdddfdvserfvwerwerfgvwrtvfdvvfe
ppt two.pptdddfdvserfvwerwerfgvwrtvfdvvfeppt two.pptdddfdvserfvwerwerfgvwrtvfdvvfe
ppt two.pptdddfdvserfvwerwerfgvwrtvfdvvfe
 
Achievement level and school climate of primary schools teachers
Achievement level and school climate of primary schools teachersAchievement level and school climate of primary schools teachers
Achievement level and school climate of primary schools teachers
 
Teacher
TeacherTeacher
Teacher
 
What makes-great-teaching?
What makes-great-teaching?What makes-great-teaching?
What makes-great-teaching?
 
Task Assessment of Fourth and Fifth Grade Teachers
Task Assessment of Fourth and Fifth Grade TeachersTask Assessment of Fourth and Fifth Grade Teachers
Task Assessment of Fourth and Fifth Grade Teachers
 
Teal Modern and Minimalist Thesis Defense Presentation (2).pptx
Teal Modern and Minimalist Thesis Defense Presentation (2).pptxTeal Modern and Minimalist Thesis Defense Presentation (2).pptx
Teal Modern and Minimalist Thesis Defense Presentation (2).pptx
 
Fowler-Final_Capstone
Fowler-Final_CapstoneFowler-Final_Capstone
Fowler-Final_Capstone
 
Borgemenke, arthur j examining recurring critical events schooling v5 n1 2014
Borgemenke, arthur j examining recurring critical events schooling v5 n1 2014Borgemenke, arthur j examining recurring critical events schooling v5 n1 2014
Borgemenke, arthur j examining recurring critical events schooling v5 n1 2014
 
Teacher evaluation presentation oregon
Teacher evaluation presentation   oregonTeacher evaluation presentation   oregon
Teacher evaluation presentation oregon
 

Último

Food processing presentation for bsc agriculture hons
Food processing presentation for bsc agriculture honsFood processing presentation for bsc agriculture hons
Food processing presentation for bsc agriculture honsManeerUddin
 
Incoming and Outgoing Shipments in 3 STEPS Using Odoo 17
Incoming and Outgoing Shipments in 3 STEPS Using Odoo 17Incoming and Outgoing Shipments in 3 STEPS Using Odoo 17
Incoming and Outgoing Shipments in 3 STEPS Using Odoo 17Celine George
 
INTRODUCTION TO CATHOLIC CHRISTOLOGY.pptx
INTRODUCTION TO CATHOLIC CHRISTOLOGY.pptxINTRODUCTION TO CATHOLIC CHRISTOLOGY.pptx
INTRODUCTION TO CATHOLIC CHRISTOLOGY.pptxHumphrey A Beña
 
Karra SKD Conference Presentation Revised.pptx
Karra SKD Conference Presentation Revised.pptxKarra SKD Conference Presentation Revised.pptx
Karra SKD Conference Presentation Revised.pptxAshokKarra1
 
THEORIES OF ORGANIZATION-PUBLIC ADMINISTRATION
THEORIES OF ORGANIZATION-PUBLIC ADMINISTRATIONTHEORIES OF ORGANIZATION-PUBLIC ADMINISTRATION
THEORIES OF ORGANIZATION-PUBLIC ADMINISTRATIONHumphrey A Beña
 
Barangay Council for the Protection of Children (BCPC) Orientation.pptx
Barangay Council for the Protection of Children (BCPC) Orientation.pptxBarangay Council for the Protection of Children (BCPC) Orientation.pptx
Barangay Council for the Protection of Children (BCPC) Orientation.pptxCarlos105
 
ENG 5 Q4 WEEk 1 DAY 1 Restate sentences heard in one’s own words. Use appropr...
ENG 5 Q4 WEEk 1 DAY 1 Restate sentences heard in one’s own words. Use appropr...ENG 5 Q4 WEEk 1 DAY 1 Restate sentences heard in one’s own words. Use appropr...
ENG 5 Q4 WEEk 1 DAY 1 Restate sentences heard in one’s own words. Use appropr...JojoEDelaCruz
 
How to do quick user assign in kanban in Odoo 17 ERP
How to do quick user assign in kanban in Odoo 17 ERPHow to do quick user assign in kanban in Odoo 17 ERP
How to do quick user assign in kanban in Odoo 17 ERPCeline George
 
Integumentary System SMP B. Pharm Sem I.ppt
Integumentary System SMP B. Pharm Sem I.pptIntegumentary System SMP B. Pharm Sem I.ppt
Integumentary System SMP B. Pharm Sem I.pptshraddhaparab530
 
ISYU TUNGKOL SA SEKSWLADIDA (ISSUE ABOUT SEXUALITY
ISYU TUNGKOL SA SEKSWLADIDA (ISSUE ABOUT SEXUALITYISYU TUNGKOL SA SEKSWLADIDA (ISSUE ABOUT SEXUALITY
ISYU TUNGKOL SA SEKSWLADIDA (ISSUE ABOUT SEXUALITYKayeClaireEstoconing
 
Keynote by Prof. Wurzer at Nordex about IP-design
Keynote by Prof. Wurzer at Nordex about IP-designKeynote by Prof. Wurzer at Nordex about IP-design
Keynote by Prof. Wurzer at Nordex about IP-designMIPLM
 
GRADE 4 - SUMMATIVE TEST QUARTER 4 ALL SUBJECTS
GRADE 4 - SUMMATIVE TEST QUARTER 4 ALL SUBJECTSGRADE 4 - SUMMATIVE TEST QUARTER 4 ALL SUBJECTS
GRADE 4 - SUMMATIVE TEST QUARTER 4 ALL SUBJECTSJoshuaGantuangco2
 
How to Add Barcode on PDF Report in Odoo 17
How to Add Barcode on PDF Report in Odoo 17How to Add Barcode on PDF Report in Odoo 17
How to Add Barcode on PDF Report in Odoo 17Celine George
 
ICS2208 Lecture6 Notes for SL spaces.pdf
ICS2208 Lecture6 Notes for SL spaces.pdfICS2208 Lecture6 Notes for SL spaces.pdf
ICS2208 Lecture6 Notes for SL spaces.pdfVanessa Camilleri
 
Transaction Management in Database Management System
Transaction Management in Database Management SystemTransaction Management in Database Management System
Transaction Management in Database Management SystemChristalin Nelson
 
HỌC TỐT TIẾNG ANH 11 THEO CHƯƠNG TRÌNH GLOBAL SUCCESS ĐÁP ÁN CHI TIẾT - CẢ NĂ...
HỌC TỐT TIẾNG ANH 11 THEO CHƯƠNG TRÌNH GLOBAL SUCCESS ĐÁP ÁN CHI TIẾT - CẢ NĂ...HỌC TỐT TIẾNG ANH 11 THEO CHƯƠNG TRÌNH GLOBAL SUCCESS ĐÁP ÁN CHI TIẾT - CẢ NĂ...
HỌC TỐT TIẾNG ANH 11 THEO CHƯƠNG TRÌNH GLOBAL SUCCESS ĐÁP ÁN CHI TIẾT - CẢ NĂ...Nguyen Thanh Tu Collection
 
ECONOMIC CONTEXT - PAPER 1 Q3: NEWSPAPERS.pptx
ECONOMIC CONTEXT - PAPER 1 Q3: NEWSPAPERS.pptxECONOMIC CONTEXT - PAPER 1 Q3: NEWSPAPERS.pptx
ECONOMIC CONTEXT - PAPER 1 Q3: NEWSPAPERS.pptxiammrhaywood
 
Q4-PPT-Music9_Lesson-1-Romantic-Opera.pptx
Q4-PPT-Music9_Lesson-1-Romantic-Opera.pptxQ4-PPT-Music9_Lesson-1-Romantic-Opera.pptx
Q4-PPT-Music9_Lesson-1-Romantic-Opera.pptxlancelewisportillo
 
ANG SEKTOR NG agrikultura.pptx QUARTER 4
ANG SEKTOR NG agrikultura.pptx QUARTER 4ANG SEKTOR NG agrikultura.pptx QUARTER 4
ANG SEKTOR NG agrikultura.pptx QUARTER 4MiaBumagat1
 

Último (20)

Food processing presentation for bsc agriculture hons
Food processing presentation for bsc agriculture honsFood processing presentation for bsc agriculture hons
Food processing presentation for bsc agriculture hons
 
Incoming and Outgoing Shipments in 3 STEPS Using Odoo 17
Incoming and Outgoing Shipments in 3 STEPS Using Odoo 17Incoming and Outgoing Shipments in 3 STEPS Using Odoo 17
Incoming and Outgoing Shipments in 3 STEPS Using Odoo 17
 
YOUVE_GOT_EMAIL_PRELIMS_EL_DORADO_2024.pptx
YOUVE_GOT_EMAIL_PRELIMS_EL_DORADO_2024.pptxYOUVE_GOT_EMAIL_PRELIMS_EL_DORADO_2024.pptx
YOUVE_GOT_EMAIL_PRELIMS_EL_DORADO_2024.pptx
 
INTRODUCTION TO CATHOLIC CHRISTOLOGY.pptx
INTRODUCTION TO CATHOLIC CHRISTOLOGY.pptxINTRODUCTION TO CATHOLIC CHRISTOLOGY.pptx
INTRODUCTION TO CATHOLIC CHRISTOLOGY.pptx
 
Karra SKD Conference Presentation Revised.pptx
Karra SKD Conference Presentation Revised.pptxKarra SKD Conference Presentation Revised.pptx
Karra SKD Conference Presentation Revised.pptx
 
THEORIES OF ORGANIZATION-PUBLIC ADMINISTRATION
THEORIES OF ORGANIZATION-PUBLIC ADMINISTRATIONTHEORIES OF ORGANIZATION-PUBLIC ADMINISTRATION
THEORIES OF ORGANIZATION-PUBLIC ADMINISTRATION
 
Barangay Council for the Protection of Children (BCPC) Orientation.pptx
Barangay Council for the Protection of Children (BCPC) Orientation.pptxBarangay Council for the Protection of Children (BCPC) Orientation.pptx
Barangay Council for the Protection of Children (BCPC) Orientation.pptx
 
ENG 5 Q4 WEEk 1 DAY 1 Restate sentences heard in one’s own words. Use appropr...
ENG 5 Q4 WEEk 1 DAY 1 Restate sentences heard in one’s own words. Use appropr...ENG 5 Q4 WEEk 1 DAY 1 Restate sentences heard in one’s own words. Use appropr...
ENG 5 Q4 WEEk 1 DAY 1 Restate sentences heard in one’s own words. Use appropr...
 
How to do quick user assign in kanban in Odoo 17 ERP
How to do quick user assign in kanban in Odoo 17 ERPHow to do quick user assign in kanban in Odoo 17 ERP
How to do quick user assign in kanban in Odoo 17 ERP
 
Integumentary System SMP B. Pharm Sem I.ppt
Integumentary System SMP B. Pharm Sem I.pptIntegumentary System SMP B. Pharm Sem I.ppt
Integumentary System SMP B. Pharm Sem I.ppt
 
ISYU TUNGKOL SA SEKSWLADIDA (ISSUE ABOUT SEXUALITY
ISYU TUNGKOL SA SEKSWLADIDA (ISSUE ABOUT SEXUALITYISYU TUNGKOL SA SEKSWLADIDA (ISSUE ABOUT SEXUALITY
ISYU TUNGKOL SA SEKSWLADIDA (ISSUE ABOUT SEXUALITY
 
Keynote by Prof. Wurzer at Nordex about IP-design
Keynote by Prof. Wurzer at Nordex about IP-designKeynote by Prof. Wurzer at Nordex about IP-design
Keynote by Prof. Wurzer at Nordex about IP-design
 
GRADE 4 - SUMMATIVE TEST QUARTER 4 ALL SUBJECTS
GRADE 4 - SUMMATIVE TEST QUARTER 4 ALL SUBJECTSGRADE 4 - SUMMATIVE TEST QUARTER 4 ALL SUBJECTS
GRADE 4 - SUMMATIVE TEST QUARTER 4 ALL SUBJECTS
 
How to Add Barcode on PDF Report in Odoo 17
How to Add Barcode on PDF Report in Odoo 17How to Add Barcode on PDF Report in Odoo 17
How to Add Barcode on PDF Report in Odoo 17
 
ICS2208 Lecture6 Notes for SL spaces.pdf
ICS2208 Lecture6 Notes for SL spaces.pdfICS2208 Lecture6 Notes for SL spaces.pdf
ICS2208 Lecture6 Notes for SL spaces.pdf
 
Transaction Management in Database Management System
Transaction Management in Database Management SystemTransaction Management in Database Management System
Transaction Management in Database Management System
 
HỌC TỐT TIẾNG ANH 11 THEO CHƯƠNG TRÌNH GLOBAL SUCCESS ĐÁP ÁN CHI TIẾT - CẢ NĂ...
HỌC TỐT TIẾNG ANH 11 THEO CHƯƠNG TRÌNH GLOBAL SUCCESS ĐÁP ÁN CHI TIẾT - CẢ NĂ...HỌC TỐT TIẾNG ANH 11 THEO CHƯƠNG TRÌNH GLOBAL SUCCESS ĐÁP ÁN CHI TIẾT - CẢ NĂ...
HỌC TỐT TIẾNG ANH 11 THEO CHƯƠNG TRÌNH GLOBAL SUCCESS ĐÁP ÁN CHI TIẾT - CẢ NĂ...
 
ECONOMIC CONTEXT - PAPER 1 Q3: NEWSPAPERS.pptx
ECONOMIC CONTEXT - PAPER 1 Q3: NEWSPAPERS.pptxECONOMIC CONTEXT - PAPER 1 Q3: NEWSPAPERS.pptx
ECONOMIC CONTEXT - PAPER 1 Q3: NEWSPAPERS.pptx
 
Q4-PPT-Music9_Lesson-1-Romantic-Opera.pptx
Q4-PPT-Music9_Lesson-1-Romantic-Opera.pptxQ4-PPT-Music9_Lesson-1-Romantic-Opera.pptx
Q4-PPT-Music9_Lesson-1-Romantic-Opera.pptx
 
ANG SEKTOR NG agrikultura.pptx QUARTER 4
ANG SEKTOR NG agrikultura.pptx QUARTER 4ANG SEKTOR NG agrikultura.pptx QUARTER 4
ANG SEKTOR NG agrikultura.pptx QUARTER 4
 

Evidence on Teacher Effectiveness and Implications for Recruitment, Evaluation, and Retention

  • 1. Journal of Economic Perspectives—Volume 24, Number 3—Summer 2010—Pages 97–118 TT eaching may be the most-scrutinized occupation in the economy. Over theeaching may be the most-scrutinized occupation in the economy. Over the past four decades, empirical researchers—many of them economists—havepast four decades, empirical researchers—many of them economists—have accumulated an impressive amount of evidence on teachers: the hetero-accumulated an impressive amount of evidence on teachers: the hetero- geneity in teacher productivity, the rise in productivity associated with teachinggeneity in teacher productivity, the rise in productivity associated with teaching credentials and on-the-job experience, rates of turnover, the costs of recruitment,credentials and on-the-job experience, rates of turnover, the costs of recruitment, the relationship between supply and quality, the effect of class size and the monetarythe relationship between supply and quality, the effect of class size and the monetary value of academic achievement gains over a student’s lifetime. Since the passagevalue of academic achievement gains over a student’s lifetime. Since the passage of the No Child Left Behind Act, along with a number of state-level educationalof the No Child Left Behind Act, along with a number of state-level educational initiatives, the data needed to estimate individual teacher performance based oninitiatives, the data needed to estimate individual teacher performance based on student achievement gains have become more widely available. However, there havestudent achievement gains have become more widely available. However, there have been relatively few efforts to examine the implications of this voluminous literaturebeen relatively few efforts to examine the implications of this voluminous literature on teacher performance. In this paper, we ask what the existing evidence implieson teacher performance. In this paper, we ask what the existing evidence implies for how school leaders might recruit, evaluate, and retain teachers.for how school leaders might recruit, evaluate, and retain teachers. We begin by summarizing the evidence on five key points, referring to existingWe begin by summarizing the evidence on five key points, referring to existing work and to evidence we have accumulated from our research with the nation’swork and to evidence we have accumulated from our research with the nation’s two largest school districts: Los Angeles and New York City. First, teachers displaytwo largest school districts: Los Angeles and New York City. First, teachers display considerable heterogeneity in their effects on student achievement gains. The stan-considerable heterogeneity in their effects on student achievement gains. The stan- dard deviation across teachers in their impact on student achievement gains is ondard deviation across teachers in their impact on student achievement gains is on the order of 0.1 to 0.2 student-level standard deviations, which would improve thethe order of 0.1 to 0.2 student-level standard deviations, which would improve the Searching for Effective Teachers with Imperfect Information ■■ Douglas O. Staiger is John French Professor of Economics, Dartmouth College, Hanover,Douglas O. Staiger is John French Professor of Economics, Dartmouth College, Hanover, New Hampshire. Jonah E. Rockoff is Sidney Taurel Associate Professor of Business, ColumbiaNew Hampshire. Jonah E. Rockoff is Sidney Taurel Associate Professor of Business, Columbia Business School, New York City, New York. Their e-mail addresses areBusiness School, New York City, New York. Their e-mail addresses are 〈〈Douglas.O.Staiger@Douglas.O.Staiger@ dartmouth.edudartmouth.edu〉〉 andand 〈〈jonah.rockoff@columbia.edujonah.rockoff@columbia.edu〉〉.. doi=10.1257/jep.24.3.97 Douglas O. Staiger and Jonah E. Rockoff
  • 2. 98 Journal of Economic Perspectives median student’s test score 4 to 8 percentiles in a single year.median student’s test score 4 to 8 percentiles in a single year.11 Second, estimates ofSecond, estimates of teacher effectiveness based on student achievement data are noisy measures andteacher effectiveness based on student achievement data are noisy measures and can be thought of as having reliability in the range of 30 to 50 percent. Third,can be thought of as having reliability in the range of 30 to 50 percent. Third, teachers’ effectiveness rises rapidly in the first year or two of their teaching careersteachers’ effectiveness rises rapidly in the first year or two of their teaching careers but then quickly levels out. Fourth, the primary cost of teacher turnover is notbut then quickly levels out. Fourth, the primary cost of teacher turnover is not the direct cost of hiring and firing, but rather is the loss to students who will bethe direct cost of hiring and firing, but rather is the loss to students who will be taught by a novice teacher rather than one with several years of experience. Fifth,taught by a novice teacher rather than one with several years of experience. Fifth, it is difficult to identify those teachers who will prove more effective at the time ofit is difficult to identify those teachers who will prove more effective at the time of hire. As a result, better teachers can only be identified after some evidence on theirhire. As a result, better teachers can only be identified after some evidence on their actual job performance has accumulated.actual job performance has accumulated. We then explore what these facts imply for how principals and school districtsWe then explore what these facts imply for how principals and school districts should act, using a simple model in which schools must search for teachers usingshould act, using a simple model in which schools must search for teachers using noisy signals of teacher effectiveness. Due to a lack of information available at thenoisy signals of teacher effectiveness. Due to a lack of information available at the time of hire, we will argue for a hiring process that is not highly selective—that is,time of hire, we will argue for a hiring process that is not highly selective—that is, while it might require evidence of general educational achievement like a collegewhile it might require evidence of general educational achievement like a college degree, it would not require individuals to make costly up-front specific invest-degree, it would not require individuals to make costly up-front specific invest- ments before being permitted to teach. We then argue that, given the substantialments before being permitted to teach. We then argue that, given the substantial observed heterogeneity of teacher effects, the modest rise in productivity withobserved heterogeneity of teacher effects, the modest rise in productivity with on-the-job experience, and the fact that tenure is a lifetime job, tenure protec-on-the-job experience, and the fact that tenure is a lifetime job, tenure protec- tions should be limited to those who meet a very high bar. Even with the imprecisetions should be limited to those who meet a very high bar. Even with the imprecise estimates of teacher effectiveness currently available, our simulations suggest that aestimates of teacher effectiveness currently available, our simulations suggest that a strategy that would sample extensively from the pool of potential teachers but offerstrategy that would sample extensively from the pool of potential teachers but offer tenure only to a small percentage could yield substantial annual gains in studenttenure only to a small percentage could yield substantial annual gains in student achievement.achievement. The implications of our analysis are strikingly different from current practice.The implications of our analysis are strikingly different from current practice. Schools and school districts attempt to screen at the point of hiring and requireSchools and school districts attempt to screen at the point of hiring and require significant investment in education-specific coursework but then grant tenuresignificant investment in education-specific coursework but then grant tenure status to teachers as a matter of course after two to three years on the job. Perfor-status to teachers as a matter of course after two to three years on the job. Perfor- mance evaluation is typically a perfunctory exercise and, at least officially, verymance evaluation is typically a perfunctory exercise and, at least officially, very few teachers are considered ineffective (Weisberg, Sexton, Mulhern, and Keeling,few teachers are considered ineffective (Weisberg, Sexton, Mulhern, and Keeling, 2009). Rather than screening at the time of hire, the evidence on heterogeneity of2009). Rather than screening at the time of hire, the evidence on heterogeneity of teacher performance suggests a better strategy would be identifying large differ-teacher performance suggests a better strategy would be identifying large differ- ences between teachers by observing the first few years of teaching performanceences between teachers by observing the first few years of teaching performance and retaining only the highest-performing teachers.and retaining only the highest-performing teachers. 1 The metric of standard deviations is commonly used to assess the effect of educational interven- tions, and we will use it throughout this paper. To provide some context for readers unversed in this literature, the gap in achievement between poor and nonpoor students (or between black and white students) in the United States is roughly 0.8–0.9 standard deviations (authors’ calculations based on data from the 2009 National Assessment of Educational Progress).
  • 3. Douglas O. Staiger and Jonah E. Rockoff 99 Five Facts about Teacher EffectivenessFive Facts about Teacher Effectiveness Any approach to recruiting and retaining teachers is based, at least implicitly,Any approach to recruiting and retaining teachers is based, at least implicitly, on a set of beliefs. Here, we describe the evidence on five key parameters regardingon a set of beliefs. Here, we describe the evidence on five key parameters regarding teacher effectiveness.teacher effectiveness. Fact 1: Teacher Productivity Based on Gains in Student Achievement isFact 1: Teacher Productivity Based on Gains in Student Achievement is Heterogeneous.Heterogeneous. The fact that teachers are heterogeneous in their productivity suggests thatThe fact that teachers are heterogeneous in their productivity suggests that there are potentially large gains to students if it is possible for school leaders tothere are potentially large gains to students if it is possible for school leaders to attract and retain highly effective teachers, and conversely to discourage or at leastattract and retain highly effective teachers, and conversely to discourage or at least to avoid giving tenure to ineffective teachers.to avoid giving tenure to ineffective teachers. More than three decades ago, Hanushek (1971) and Murnane (1975) wereMore than three decades ago, Hanushek (1971) and Murnane (1975) were the first economists to report large differences in student achievement in differentthe first economists to report large differences in student achievement in different teachers’ classrooms, even after controlling for students’ prior achievement andteachers’ classrooms, even after controlling for students’ prior achievement and characteristics. That literature has accelerated in recent years. Especially followingcharacteristics. That literature has accelerated in recent years. Especially following the No Child Left Behind Act, many states and school districts began collectingthe No Child Left Behind Act, many states and school districts began collecting annual data on students and matching it to teachers.annual data on students and matching it to teachers.22 Research has producedResearch has produced remarkably consistent estimates of the heterogeneity in teacher impacts in differentremarkably consistent estimates of the heterogeneity in teacher impacts in different sites. For example, using data from Texas, Rivkin, Hanushek, and Kain (2005) findsites. For example, using data from Texas, Rivkin, Hanushek, and Kain (2005) find that a standard deviation in teacher quality is associated with 0.11 student-levelthat a standard deviation in teacher quality is associated with 0.11 student-level standard deviations in math and 0.095 standard deviations in reading. Using datastandard deviations in math and 0.095 standard deviations in reading. Using data from two school districts in New Jersey, Rockoff (2004) reports that one standardfrom two school districts in New Jersey, Rockoff (2004) reports that one standard deviation in teacher effects is associated with a 0.1 student-level standard deviationdeviation in teacher effects is associated with a 0.1 student-level standard deviation in achievement. Using data from Chicago, Aaronson, Barrow, and Sander (2007)in achievement. Using data from Chicago, Aaronson, Barrow, and Sander (2007) report that a standard deviation in teacher quality is associated with a difference inreport that a standard deviation in teacher quality is associated with a difference in math performance of 0.09 to 0.16 student-level standard deviations.math performance of 0.09 to 0.16 student-level standard deviations.33 How much should we care about these differences in effectiveness acrossHow much should we care about these differences in effectiveness across teachers? To attach an approximate dollar value to them, one needs an estimateteachers? To attach an approximate dollar value to them, one needs an estimate of the value of student achievement over the course of a student’s lifetime. Thereof the value of student achievement over the course of a student’s lifetime. There is a long tradition in labor economics estimating the relationship between variousis a long tradition in labor economics estimating the relationship between various types of test scores and the earnings of early-career workers (for example, Murnane,types of test scores and the earnings of early-career workers (for example, Murnane, 2 The data requirements for measuring heterogeneity in teaching effectiveness are high. First, one needs longitudinal data on achievement for individual students matched to specific teachers. Second, achievement data are needed on an annual basis to be able to track gains for each student over a single school year. (Prior to the No Child Left Behind legislation, many states tested at longer intervals, such as fourth and eighth grade.) Third, panel data on teachers are required as well, to be able to track performance of individual teachers over time. Teacher-level panel data are needed to account for school-level or classroom-level shocks to student achievement that contribute to the measurement error in classroom-level measures. In this journal, Kane and Staiger (2002) showed that conventional estimates of sampling error cannot account for the lack of persistence in school-level value-added estimates. There appear to be other school-level and classroom-level sources of error. 3 Aaronson, Barrow, and Sander (2007) report the variance in teacher quality to be .02 to .06 grade- level equivalents (adjusted for sampling error). In table 1, they report the standard deviation in grade-level equivalents of eighth grade students to be 1.55 (√ _ .02/1.55 = .09, √ _ .06/1.55 = .16). Their study adjusted for sampling variation, but not for other classroom level sources of error.
  • 4. 100 Journal of Economic Perspectives Willett, and Levy, 1995; Neal and Johnson, 1996).Willett, and Levy, 1995; Neal and Johnson, 1996).44 Kane and Staiger (2002) esti-Kane and Staiger (2002) esti- mated that the value of a one standard deviation gain in math scores would havemated that the value of a one standard deviation gain in math scores would have been worth $110,000 at age 18 using the Murnane et al. estimates, and $256,000been worth $110,000 at age 18 using the Murnane et al. estimates, and $256,000 using the Neal and Johnson results. This implies that a one standard deviationusing the Neal and Johnson results. This implies that a one standard deviation increase in teacher effectiveness (that is, one that leads to an increase of aboutincrease in teacher effectiveness (that is, one that leads to an increase of about 0.15 standard deviations of student achievement for 20 students) has a value of0.15 standard deviations of student achievement for 20 students) has a value of around $330,000 to $760,000.around $330,000 to $760,000. As several recent papers remind us, the statistical assumptions required for theAs several recent papers remind us, the statistical assumptions required for the identification of causal teacher effects with observational data are extraordinarilyidentification of causal teacher effects with observational data are extraordinarily strong and rarely tested (Andrabi, Das, Khwaja, and Zajonc, 2009; McCaffrey,strong and rarely tested (Andrabi, Das, Khwaja, and Zajonc, 2009; McCaffrey, Lockwood, Koretz, Louis, and Hamilton, 2004; Raudenbush, 2004; Rothstein,Lockwood, Koretz, Louis, and Hamilton, 2004; Raudenbush, 2004; Rothstein, 2010; Rubin, Stuart, and Zanutto, 2004; Todd and Wolpin, 2003). Teachers may be2010; Rubin, Stuart, and Zanutto, 2004; Todd and Wolpin, 2003). Teachers may be assigned classrooms of students that differ in unmeasured ways—such as consistingassigned classrooms of students that differ in unmeasured ways—such as consisting of more motivated students, or students with stronger unmeasured prior achieve-of more motivated students, or students with stronger unmeasured prior achieve- ment or more engaged parents—that result in varying student achievement gains.ment or more engaged parents—that result in varying student achievement gains. Despite these concerns, several pieces of evidence suggest that the magnitudeDespite these concerns, several pieces of evidence suggest that the magnitude of variation in teacher effects is driven by real differences in teacher quality. First,of variation in teacher effects is driven by real differences in teacher quality. First, estimates tend to be highly correlated across a wide variety of specifications (Harrisestimates tend to be highly correlated across a wide variety of specifications (Harris and Sass, 2006). Second, researchers have consistently found strong correlationsand Sass, 2006). Second, researchers have consistently found strong correlations between teacher effect estimates and evaluations made by school principals andbetween teacher effect estimates and evaluations made by school principals and other professional educators (Murnane, 1975; Jacob and Lefgren, 2008; Harrisother professional educators (Murnane, 1975; Jacob and Lefgren, 2008; Harris and Sass, 2009; Rockoff and Speroni, 2010; Tyler, Taylor, Kane, and Wooten, 2010).and Sass, 2009; Rockoff and Speroni, 2010; Tyler, Taylor, Kane, and Wooten, 2010). Third, while most studies of teacher effects rely on assumptions regarding matchingThird, while most studies of teacher effects rely on assumptions regarding matching of students with teachers at the classroom level, Rivkin, Hanushek, and Kain (2005)of students with teachers at the classroom level, Rivkin, Hanushek, and Kain (2005) use a completely different approach that does not rely on this assumption and finduse a completely different approach that does not rely on this assumption and find similar estimates to the rest of the literature.similar estimates to the rest of the literature. Finally, two studies based on random assignment of teachers to classroomsFinally, two studies based on random assignment of teachers to classrooms have found variation in teacher effects consistent with nonexperimental estimates,have found variation in teacher effects consistent with nonexperimental estimates, suggesting that estimated differences in teacher effectiveness are not driven bysuggesting that estimated differences in teacher effectiveness are not driven by student sorting. Nye, Konstantopoulos, and Hedges (2004) reexamined data fromstudent sorting. Nye, Konstantopoulos, and Hedges (2004) reexamined data from the Tennessee STAR classroom size experiment, in which teachers were randomlythe Tennessee STAR classroom size experiment, in which teachers were randomly assigned to classes of a given size. The differences in classroom-level studentassigned to classes of a given size. The differences in classroom-level student achievement that emerged within given class size groups were larger than wouldachievement that emerged within given class size groups were larger than would have been expected to occur due to chance and strikingly similar in magnitude tohave been expected to occur due to chance and strikingly similar in magnitude to those estimated in nonexperimental studies. Kane and Staiger (2008) study a recentthose estimated in nonexperimental studies. Kane and Staiger (2008) study a recent experiment in Los Angeles Unified School District in which pairs of teachers wereexperiment in Los Angeles Unified School District in which pairs of teachers were 4 Murnane, Willett, and Levy (1995) estimate that a one standard deviation difference in math test performance is associated with an 8 percent hourly wage increase for men and a 12.6 percent increase for women. These estimates may understate the value of academic achievement since the authors also control for years of schooling completed. Neal and Johnson (1996), who do not condition on educa- tional attainment, estimate that an improvement of one standard deviation in test performance is associated with 18.7 and 25.6 percent increases in hourly wages for men and women, respectively. Of course, the cross-sectional relationship between tested achievement and earnings may overstate the causal value of academic achievement. However, while there have been attempts to estimate the causal value of years of schooling, we are not aware of estimates of the causal value of academic achievement.
  • 5. Searching for Effective Teachers with Imperfect Information 101 randomly assigned to classrooms within the same elementary school and grade.randomly assigned to classrooms within the same elementary school and grade. They found that nonexperimental value-added estimates from a pre-experimentalThey found that nonexperimental value-added estimates from a pre-experimental period were able to predict student achievement differences following randomperiod were able to predict student achievement differences following random assignment: a one-point difference between randomly-assigned teachers in pre-assignment: a one-point difference between randomly-assigned teachers in pre- experimental value added was associated with a one-point difference in studentexperimental value added was associated with a one-point difference in student achievement following random assignment. Thus, the nonexperimental estimatesachievement following random assignment. Thus, the nonexperimental estimates for individual teachers were unbiased predictors of a teacher’s impact on studentfor individual teachers were unbiased predictors of a teacher’s impact on student achievement in the experiment.achievement in the experiment. Fact 2: Estimates of Heterogeneous Teacher Effects Include a Substantial NoiseFact 2: Estimates of Heterogeneous Teacher Effects Include a Substantial Noise Component.Component. Ideally, estimates of the amount that teachers affect student achievement wouldIdeally, estimates of the amount that teachers affect student achievement would be the same across classrooms or from year to year within the same teacher, but thisbe the same across classrooms or from year to year within the same teacher, but this does not hold true in practice. The error in estimates of teacher effects on studentdoes not hold true in practice. The error in estimates of teacher effects on student achievement derives from at least two sources. The first is sampling variation.achievement derives from at least two sources. The first is sampling variation. The typical elementary classroom may have 20 to 25 students per year (althoughThe typical elementary classroom may have 20 to 25 students per year (although middle and high school teachers have somewhat larger classes and typically teachmiddle and high school teachers have somewhat larger classes and typically teach multiple sections). With samples of such modest size, naturally occurring variationmultiple sections). With samples of such modest size, naturally occurring variation in the make-up of a teacher’s classroom from year to year will produce variationin the make-up of a teacher’s classroom from year to year will produce variation in a teacher’s estimated effect. However, volatility in teacher (and school) effectsin a teacher’s estimated effect. However, volatility in teacher (and school) effects exceeds that predicted by sampling error alone (Kane and Staiger, 2002; Kane,exceeds that predicted by sampling error alone (Kane and Staiger, 2002; Kane, Rockoff, and Staiger, 2008). The source of this second type of error—which canRockoff, and Staiger, 2008). The source of this second type of error—which can perhaps more accurately be thought of as nonpersistent variation in estimates ofperhaps more accurately be thought of as nonpersistent variation in estimates of teacher effects on student achievement—could include a broad range of factorsteacher effects on student achievement—could include a broad range of factors influencing the measured achievement gains of groups of students: for example,influencing the measured achievement gains of groups of students: for example, interactions between a specific teacher’s lesson plans and the test used in a giveninteractions between a specific teacher’s lesson plans and the test used in a given year, an (unpredictably) disruptive student that drags down his/her classmates, ayear, an (unpredictably) disruptive student that drags down his/her classmates, a dog barking in the parking lot on the day of the test, or more mysterious forces thatdog barking in the parking lot on the day of the test, or more mysterious forces that fall under the broad category of “classroom chemistry.”fall under the broad category of “classroom chemistry.” For present purposes, any nonpersistent variation in a teacher’s measuredFor present purposes, any nonpersistent variation in a teacher’s measured impact on student achievement represents estimation error. One approach toimpact on student achievement represents estimation error. One approach to estimating the proportion of variance due to nonpersistent sources is to study theestimating the proportion of variance due to nonpersistent sources is to study the correlation in estimated impacts across classrooms taught by the same teacher. Ifcorrelation in estimated impacts across classrooms taught by the same teacher. If a teacher’s estimated impact,a teacher’s estimated impact, Ytt, represents the sum of a persistent component,, represents the sum of a persistent component, , and an uncorrelated nonpersistent error,, and an uncorrelated nonpersistent error, εεtt, then the correlation between the, then the correlation between the estimated effect this year and last year—that is, betweenestimated effect this year and last year—that is, between Ytt andand Ytt–1–1—represents—represents an estimate of the reliability of the teacher-level estimate in any given year. Table 1an estimate of the reliability of the teacher-level estimate in any given year. Table 1 reports the standard deviation in estimated teacher effects, the estimated reliabilityreports the standard deviation in estimated teacher effects, the estimated reliability (as measured by the correlation across classrooms taught by the same teacher), and(as measured by the correlation across classrooms taught by the same teacher), and implied standard deviation in true teacher impacts (implied standard deviation in true teacher impacts (σσ ) for teachers in two school) for teachers in two school districts: Los Angeles Unified and New York City. When reported in terms of thedistricts: Los Angeles Unified and New York City. When reported in terms of the student-level standard deviation in test scores in a given grade and subject, thestudent-level standard deviation in test scores in a given grade and subject, the standard deviation in estimated value added for teachers was remarkably similarstandard deviation in estimated value added for teachers was remarkably similar in the two districts, with estimates in both math and English Language Arts in thein the two districts, with estimates in both math and English Language Arts in the
  • 6. 102 Journal of Economic Perspectives narrow range from .23 to .27. Although the estimated reliability of teacher effectsnarrow range from .23 to .27. Although the estimated reliability of teacher effects was higher in math than in English Language Arts, and higher in Los Angeles thanwas higher in math than in English Language Arts, and higher in Los Angeles than in New York City, all the reliability estimates suggest that there is considerable errorin New York City, all the reliability estimates suggest that there is considerable error or volatility in the teacher impact estimates. Indeed, more than half of the variationor volatility in the teacher impact estimates. Indeed, more than half of the variation in estimated impacts in math and English Language Arts are nonpersistent. Thein estimated impacts in math and English Language Arts are nonpersistent. The standard deviation of the persistent teacher effect is between .12 and .19, similar tostandard deviation of the persistent teacher effect is between .12 and .19, similar to that found in the previous literature discussed above.that found in the previous literature discussed above. Fact 3: Teachers Improve Substantially in Their First Few Years on the Job.Fact 3: Teachers Improve Substantially in Their First Few Years on the Job. Table 1 also reports the degree to which average teacher effects on studentTable 1 also reports the degree to which average teacher effects on student achievement differ from that of experienced teachers during the first few yearsachievement differ from that of experienced teachers during the first few years on the job in these same two districts. In both Los Angeles and New York, teacheron the job in these same two districts. In both Los Angeles and New York, teacher effects on student achievement appear to rise rapidly during the first several yearseffects on student achievement appear to rise rapidly during the first several years on the job and then flatten out. This finding has been replicated in a numberon the job and then flatten out. This finding has been replicated in a number of states and districts (Rivkin, Hanushek, and Kain, 2005; Clotfelter, Ladd, andof states and districts (Rivkin, Hanushek, and Kain, 2005; Clotfelter, Ladd, and Vigdor, 2006; Harris and Sass, 2006; Jacob, 2007). When assigned to a first-yearVigdor, 2006; Harris and Sass, 2006; Jacob, 2007). When assigned to a first-year teacher, the average student gains .06 to .08 standard deviations of achievementteacher, the average student gains .06 to .08 standard deviations of achievement less than observably similar students assigned to experienced teachers. However,less than observably similar students assigned to experienced teachers. However, the achievement gains of students assigned to second-year teachers lagged those inthe achievement gains of students assigned to second-year teachers lagged those in Table 1 Evidence on Teacher Value Added from Schools in Los Angeles and New York City (teacher value added measured in standard deviations of student performance) Los Angeles New York City Math English Language Arts Math English Language Arts Variation in Teacher Value Added: Standard deviation of annual value-added measure 0.27 0.23 0.25 0.23 Reliability of annual value-added measure 0.50 0.37 0.39 0.28 Implied standard deviation of persistent teacher effect 0.19 0.14 0.15 0.12 Difference in Value Added Relative to Teachers with 3+ Years Experience: No experience teaching (novice) –0.08 –0.06 –0.07 –0.07 One year of experience teaching –0.02 –0.01 –0.03 –0.04 Two years of experience teaching –0.01 –0.01 –0.02 –0.02 Notes: Teacher value-added estimates are from analysis of data on fourth and fifth graders in years 2000–2003 for Los Angeles and 2000–2005 for New York City. Teacher value added is measured in standard deviations of student performance. Reliability of the value-added measure refers to the correlation of the value-added measure across classrooms taught by the same teacher. Estimates are based on regressions of student achievement that include student-level controls for baseline test scores, race/ethnicity, special education, English Language Learners (ELL), and free lunch status; classroom peer means of the student-level characteristics; and grade-by-year fixed effects.
  • 7. Douglas O. Staiger and Jonah E. Rockoff 103 more experienced teachers’ classrooms by only .01 to .04 standard deviations. Inmore experienced teachers’ classrooms by only .01 to .04 standard deviations. In Los Angeles, students of third-year teachers saw gains comparable to those of moreLos Angeles, students of third-year teachers saw gains comparable to those of more experienced teachers, while there was a small difference for third-year teachers inexperienced teachers, while there was a small difference for third-year teachers in New York (.01 to .02 standard deviations).New York (.01 to .02 standard deviations). Fact 4: The Main Cost of Teacher Turnover is the Reduction in StudentFact 4: The Main Cost of Teacher Turnover is the Reduction in Student Achievement when an Experienced Teacher is Replaced by a Novice, not DirectAchievement when an Experienced Teacher is Replaced by a Novice, not Direct Hiring Costs.Hiring Costs. Milanowski and Odden (2007) carefully studied costs of teacher recruitmentMilanowski and Odden (2007) carefully studied costs of teacher recruitment and hiring in a large urban Midwestern school district. They estimate total costsand hiring in a large urban Midwestern school district. They estimate total costs of roughly $8,200: recruiting costs per vacancy of $1,100 in central office staffof roughly $8,200: recruiting costs per vacancy of $1,100 in central office staff time and $2,600 in school-level staff time, plus $4,500 for the cost of trainingtime and $2,600 in school-level staff time, plus $4,500 for the cost of training a new teacher. In addition, some of these costs will be defrayed by the salariesa new teacher. In addition, some of these costs will be defrayed by the salaries earned by new teachers, which are typically lower than the salaries of the teachersearned by new teachers, which are typically lower than the salaries of the teachers they replace.they replace. Based on the gains that teachers make in their first few years of experience,Based on the gains that teachers make in their first few years of experience, every time a school district loses an experienced teacher with two or more yearsevery time a school district loses an experienced teacher with two or more years of experience and is forced to hire a novice teacher, the students assigned to theof experience and is forced to hire a novice teacher, the students assigned to the novice teacher over the first two years of their career lose roughly .10 standardnovice teacher over the first two years of their career lose roughly .10 standard deviations in student achievement. As discussed above, estimates suggest a .10 stan-deviations in student achievement. As discussed above, estimates suggest a .10 stan- dard deviation gain in math scores has a value of roughly $10,000 to $25,000 perdard deviation gain in math scores has a value of roughly $10,000 to $25,000 per student. Thus, the economic cost of lost academic achievement when replacing anstudent. Thus, the economic cost of lost academic achievement when replacing an experienced elementary teacher with a novice would be roughly $10,000 to $25,000experienced elementary teacher with a novice would be roughly $10,000 to $25,000 times 20 students per class—or $200,000 to $500,000. This is obviously a back-of-times 20 students per class—or $200,000 to $500,000. This is obviously a back-of- the-envelope calculation, but it dwarfs the direct costs of teacher hiring.the-envelope calculation, but it dwarfs the direct costs of teacher hiring. Fact 5: School Leaders Have Very Little Ability to Select Effective TeachersFact 5: School Leaders Have Very Little Ability to Select Effective Teachers During the Initial Hiring Process.During the Initial Hiring Process. Reliable screening at the hiring stage would be an efficient tool for raisingReliable screening at the hiring stage would be an efficient tool for raising student achievement because it avoids the cost of placing ineffective teachers instudent achievement because it avoids the cost of placing ineffective teachers in front of students. Unfortunately, there is scant evidence that school districts orfront of students. Unfortunately, there is scant evidence that school districts or principals can effectively separate effective and ineffective teachers when theyprincipals can effectively separate effective and ineffective teachers when they make hiring decisions. Indeed, this notion is supported by the fact that most ofmake hiring decisions. Indeed, this notion is supported by the fact that most of the variation in teacher effects occurs among teachers hired into the same school.the variation in teacher effects occurs among teachers hired into the same school. One of the most interesting pieces of evidence on this topic comes from aOne of the most interesting pieces of evidence on this topic comes from a natural experiment that occurred in California in the late 1990s (Kane andnatural experiment that occurred in California in the late 1990s (Kane and Staiger, 2005). Beginning in the academic year 1996–1997, the state of CaliforniaStaiger, 2005). Beginning in the academic year 1996–1997, the state of California provided cash incentives to school districts to keep class sizes in kindergartenprovided cash incentives to school districts to keep class sizes in kindergarten through third grade to a maximum of 20 children. To take advantage of the statethrough third grade to a maximum of 20 children. To take advantage of the state incentive, school districts throughout the state dramatically increased hiring ofincentive, school districts throughout the state dramatically increased hiring of new elementary teachers. In the years before 1997, the Los Angeles Unified Schoolnew elementary teachers. In the years before 1997, the Los Angeles Unified School District hired 1,200 to 1,400 elementary school teachers per year, but in 1997 LosDistrict hired 1,200 to 1,400 elementary school teachers per year, but in 1997 Los Angeles nearlyAngeles nearly tripled the number of elementary school teachers it hired, to 3,335,the number of elementary school teachers it hired, to 3,335, and continued to hire at more than double its earlier level for the next five years.and continued to hire at more than double its earlier level for the next five years.
  • 8. 104 Journal of Economic Perspectives If the district were able to discern teacher effectiveness in the hiring process,If the district were able to discern teacher effectiveness in the hiring process, we would have expected a large increase in hiring to have had a negative effect onwe would have expected a large increase in hiring to have had a negative effect on the average effectiveness of the teachers hired. Such an effect would likely havethe average effectiveness of the teachers hired. Such an effect would likely have been heightened by the fact that nearly every other school district in California wasbeen heightened by the fact that nearly every other school district in California was on a hiring spree because of the same state law, the fact that teacher compensationon a hiring spree because of the same state law, the fact that teacher compensation in Los Angeles did not increase more than usual during this period, and that thein Los Angeles did not increase more than usual during this period, and that the proportion of new hires in L.A. without teaching credentials rose from 59 percentproportion of new hires in L.A. without teaching credentials rose from 59 percent to 72 percent.to 72 percent.55 However, Kane and Staiger (2005) find that, despite the size of theHowever, Kane and Staiger (2005) find that, despite the size of the hiring bubble, value added in the period 2001–2004 for teachers hired in 1997 washiring bubble, value added in the period 2001–2004 for teachers hired in 1997 was no worse than for teachers hired in the years immediately before 1997.no worse than for teachers hired in the years immediately before 1997.66 Overall,Overall, there was no evidence that tripling the number of new hires had any effect on theirthere was no evidence that tripling the number of new hires had any effect on their average effectiveness in the classroom.average effectiveness in the classroom. 77 Other evidence on this issue comes from decades of work in which researchersOther evidence on this issue comes from decades of work in which researchers have tried, unsuccessfully, to link teacher characteristics observable to bothhave tried, unsuccessfully, to link teacher characteristics observable to both researchers and principals to student outcomes (see reviews by Hanushek, 1986, 1997;researchers and principals to student outcomes (see reviews by Hanushek, 1986, 1997; Jacob, 2007). With the exception of teaching experience, there is little to suggestJacob, 2007). With the exception of teaching experience, there is little to suggest that the credentials commonly used to determine teacher certification and pay arethat the credentials commonly used to determine teacher certification and pay are related to teachers’ impacts on student outcomes. Some studies find that a teacher’srelated to teachers’ impacts on student outcomes. Some studies find that a teacher’s academic background (like college grade point average or SAT test scores) is relatedacademic background (like college grade point average or SAT test scores) is related to student outcomes, but Ballou (1996) finds that teaching applicants with strongto student outcomes, but Ballou (1996) finds that teaching applicants with strong academic records are no more likely to be hired by school principals.academic records are no more likely to be hired by school principals. More recent work suggests that selecting teaching candidates who are likelyMore recent work suggests that selecting teaching candidates who are likely to be effective is difficult, but not impossible. For example, several studies haveto be effective is difficult, but not impossible. For example, several studies have estimated the effect of novice teachers recruited under the Teach for Americaestimated the effect of novice teachers recruited under the Teach for America program (Decker, Mayer, and Glazerman, 2004; Boyd, Grossman, Lankford, Loeb,program (Decker, Mayer, and Glazerman, 2004; Boyd, Grossman, Lankford, Loeb, and Wyckoff, 2006; Kane, Rockoff, and Staiger, 2008). Teach for America is highlyand Wyckoff, 2006; Kane, Rockoff, and Staiger, 2008). Teach for America is highly selective, drawing applicants from the top universities in the country and offeringselective, drawing applicants from the top universities in the country and offering positions to only a small fraction of the thousands of individuals who apply.positions to only a small fraction of the thousands of individuals who apply. However, these applicants have not generally taken college courses in K–12 educa-However, these applicants have not generally taken college courses in K–12 educa- tion nor have they majored in education. Decker, Mayer, and Glazerman (2004) usetion nor have they majored in education. Decker, Mayer, and Glazerman (2004) use random assignment to estimate the effect of the program in elementary schoolsrandom assignment to estimate the effect of the program in elementary schools and find that students assigned to Teach For America members scored 2 percentileand find that students assigned to Teach For America members scored 2 percentile 5 It may seem surprising that the fraction of teachers without credentials didn’t rise by more, but the number of individuals with teaching certification that do not teach is quite large. Data from the Baccalaureate and Beyond study indicate that roughly one in five college graduates receive teaching certification in the ten years after graduation, but 45 percent of college graduates that obtained teaching certification are not teaching, and 15 percent have never taught (author’s calculations using National Center for Education Statistics QuickStats on 6/8/2010). 6 Their analysis focuses on grades two through five in Los Angeles from 2001 through 2004. By 2001, roughly two-thirds of both the 1996 and 1997 hiring cohorts were still employed by the district; thus, there is little evidence to suggest any differential selective attrition for the larger cohort. Also, while their value-added model controls for baseline scores and other student characteristics, there was virtu- ally no difference in the types of students to which the cohorts had been assigned. 7 This evidence runs counter to the prevailing wisdom among some policy analysts that it was a decline in the average quality of the teaching force that accounts for the failure to see an increase in achieve- ment in California resulting from the class size reduction (Bohrnstedt and Stecher, 2002).
  • 9. Searching for Effective Teachers with Imperfect Information 105 points (0.095 standard deviations) higher in math and no higher in reading thanpoints (0.095 standard deviations) higher in math and no higher in reading than those assigned to other teachers. Using nonexperimental data from New York City,those assigned to other teachers. Using nonexperimental data from New York City, in Kane, Rockoff, and Staiger (2008), we find positive effects of Teach For Americain Kane, Rockoff, and Staiger (2008), we find positive effects of Teach For America teachers in math of .02 standard deviations and no statistically significant effectteachers in math of .02 standard deviations and no statistically significant effect in English Language Arts. Boyd, Grossman, Lankford, Loeb, and Wyckoff (2006)in English Language Arts. Boyd, Grossman, Lankford, Loeb, and Wyckoff (2006) report comparable results, also using data from New York City.report comparable results, also using data from New York City. More evidence comes from studies collecting data on recently-hired noviceMore evidence comes from studies collecting data on recently-hired novice math teachers in New York City. In Rockoff, Jacob, Kane, and Staiger (forth-math teachers in New York City. In Rockoff, Jacob, Kane, and Staiger (forth- coming), we collected information on a number of nontraditional predictors ofcoming), we collected information on a number of nontraditional predictors of effectiveness—including teaching-specific content knowledge, cognitive ability,effectiveness—including teaching-specific content knowledge, cognitive ability, personality traits, feelings of self-efficacy, and scores on a commercially availablepersonality traits, feelings of self-efficacy, and scores on a commercially available teacher selection instrument—and then used these to predict a teacher’s effect onteacher selection instrument—and then used these to predict a teacher’s effect on math achievement. When the variables were combined into two primary factorsmath achievement. When the variables were combined into two primary factors summarizing cognitive and noncognitive skills, teachers who were one standardsummarizing cognitive and noncognitive skills, teachers who were one standard deviation higher on either the cognitive or noncognitive factor were found to raisedeviation higher on either the cognitive or noncognitive factor were found to raise student achievement in math by .033 student-level standard deviations more thanstudent achievement in math by .033 student-level standard deviations more than teachers with average skill levels. Those who were one standard deviation higherteachers with average skill levels. Those who were one standard deviation higher on both measures were estimated to raise achievement by .066 standard deviations.on both measures were estimated to raise achievement by .066 standard deviations. Rockoff and Speroni (2010) examined the achievement of students assigned toRockoff and Speroni (2010) examined the achievement of students assigned to teachers recruited through an alternative certification program—the New Yorkteachers recruited through an alternative certification program—the New York City Teaching Fellows—and asked whether achievement gains were higher forCity Teaching Fellows—and asked whether achievement gains were higher for students assigned to teachers rated as more attractive candidates by the certificationstudents assigned to teachers rated as more attractive candidates by the certification program’s interview protocol. They found no significant relationship with Englishprogram’s interview protocol. They found no significant relationship with English Language Arts test scores and a small positive relationship with math test scores: aLanguage Arts test scores and a small positive relationship with math test scores: a one standard deviation in interview score was associated with .013 standard devia-one standard deviation in interview score was associated with .013 standard devia- tions higher math achievement gain.tions higher math achievement gain. Implications for How We Should (and Should Not) Search forImplications for How We Should (and Should Not) Search for Effective TeachersEffective Teachers Here, we first lay out a way of thinking about the appropriate search strategyHere, we first lay out a way of thinking about the appropriate search strategy for school leaders based on these empirical findings. Based on this approach, wefor school leaders based on these empirical findings. Based on this approach, we then present simulation estimates of how these different strategies would affectthen present simulation estimates of how these different strategies would affect average teacher productivity.average teacher productivity. A Reservation Value or Cut-off Score ModelA Reservation Value or Cut-off Score Model Suppose that school districts do not observe any useful pre-hire signal—thereSuppose that school districts do not observe any useful pre-hire signal—there are a substantial number of potential applicants for teaching jobs who appear toare a substantial number of potential applicants for teaching jobs who appear to have the general skill level to succeed in teaching, but we cannot tell in advancehave the general skill level to succeed in teaching, but we cannot tell in advance which ones will actually succeed. However, after teachers accept a job, the schoolwhich ones will actually succeed. However, after teachers accept a job, the school can observe the gains that students make in test scores. Thus, the principal facescan observe the gains that students make in test scores. Thus, the principal faces a search problem: the principal draws teachers from the applicant pool, observesa search problem: the principal draws teachers from the applicant pool, observes noisy signals over time about teacher productivity, and decides whether to dismissnoisy signals over time about teacher productivity, and decides whether to dismiss
  • 10. 106 Journal of Economic Perspectives unproductive teachers and start the process over again. In this kind of model, theunproductive teachers and start the process over again. In this kind of model, the optimal decision rule has a reservation property: at the end of a year, the principaloptimal decision rule has a reservation property: at the end of a year, the principal makes a decision on whether to dismiss a teacher if the expected effectiveness ofmakes a decision on whether to dismiss a teacher if the expected effectiveness of that teacher, given the information to date, lies below a reservation value.that teacher, given the information to date, lies below a reservation value.88 At a broad level, the principal should set the cut-off score where the produc-At a broad level, the principal should set the cut-off score where the produc- tivity of thetivity of the marginal teacher is expected to be equal to the productivity of theteacher is expected to be equal to the productivity of the averageaverage teacher. In other words, this decision rule tells principals to keep only theteacher. In other words, this decision rule tells principals to keep only the rookies who are expected to be better than therookies who are expected to be better than the average teacher. Imagine if thisteacher. Imagine if this were not true—that is, suppose the marginal teacher were less productive than thewere not true—that is, suppose the marginal teacher were less productive than the average teacher. Then the school district could raise average performance by raisingaverage teacher. Then the school district could raise average performance by raising its standard for new hires by a small amount. Likewise, if the marginal teacherits standard for new hires by a small amount. Likewise, if the marginal teacher accepted under the standard were more productive than the average teacher, thenaccepted under the standard were more productive than the average teacher, then the district could raise average performance by lowering the cut-off score for newthe district could raise average performance by lowering the cut-off score for new hires and adding one more above-average teacher. This result is analogous to thehires and adding one more above-average teacher. This result is analogous to the usual result that average costs are minimized at the point where marginal costusual result that average costs are minimized at the point where marginal cost equals average cost.equals average cost. However, determining the reservation value or cut-off score in practice will beHowever, determining the reservation value or cut-off score in practice will be complex. The optimal reservation value depends on a set of underlying parameterscomplex. The optimal reservation value depends on a set of underlying parameters similar to those already discussed: the extent of variation in performance acrosssimilar to those already discussed: the extent of variation in performance across teachers, the return to experience, the number of years before tenure, the exog-teachers, the return to experience, the number of years before tenure, the exog- enous turnover rate, the size of the applicant pool, and the magnitude of otherenous turnover rate, the size of the applicant pool, and the magnitude of other hiring and firing costs. For example, if teachers are more heterogeneous, then thehiring and firing costs. For example, if teachers are more heterogeneous, then the potential benefits of greater selection are higher. However, if there is more noisepotential benefits of greater selection are higher. However, if there is more noise (and thus uncertainty) in the estimates of teacher heterogeneity, then the benefits(and thus uncertainty) in the estimates of teacher heterogeneity, then the benefits of selection are lower. If the gains from teacher experience are worth more, thenof selection are lower. If the gains from teacher experience are worth more, then the cost of dismissing experienced teachers and replacing them with novices isthe cost of dismissing experienced teachers and replacing them with novices is larger. If the exogenous turnover rate of teachers is high, then the optimal cut-offlarger. If the exogenous turnover rate of teachers is high, then the optimal cut-off for tenure falls because there is less benefit to giving tenure to highly effectivefor tenure falls because there is less benefit to giving tenure to highly effective teachers if they do not stay long. Overall, the principal must set the bar to trade offteachers if they do not stay long. Overall, the principal must set the bar to trade off the short-term cost of replacing an experienced teacher with a rookie against thethe short-term cost of replacing an experienced teacher with a rookie against the long-term benefit of selecting only the most effective teachers.long-term benefit of selecting only the most effective teachers. In what follows, we report the results of Monte Carlo simulations that examineIn what follows, we report the results of Monte Carlo simulations that examine the consequences of different approaches to teacher evaluation and retention. We usethe consequences of different approaches to teacher evaluation and retention. We use evidence on key underlying parameters to calibrate the model; all of these values lieevidence on key underlying parameters to calibrate the model; all of these values lie in the middle of the estimates reported for Los Angeles and New York City in Table 1.in the middle of the estimates reported for Los Angeles and New York City in Table 1. We set the standard deviation of the persistent teacher effect (in student-level stan-We set the standard deviation of the persistent teacher effect (in student-level stan- dard deviation units) equal to 0.15, and the reliability of the value-added measuredard deviation units) equal to 0.15, and the reliability of the value-added measure (the ratio of the persistent variance to total variance) equal to 40 percent. For the(the ratio of the persistent variance to total variance) equal to 40 percent. For the return to experience, we assume that a first- and second-year teacher’s value addedreturn to experience, we assume that a first- and second-year teacher’s value added is –0.07 and –0.02 student standard deviations below the value added of teachers inis –0.07 and –0.02 student standard deviations below the value added of teachers in 8 For a simple algebraic presentation of this model, with some discussion of its links to search models with imperfect information in labor markets, see the online appendix available with this paper at 〈〈http://www.e-jep.org〉〉.
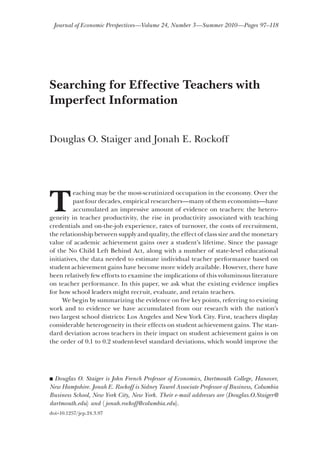
  • 11. Douglas O. Staiger and Jonah E. Rockoff 107 their third year or higher. We ignore the direct costs of hiring a new teacher. Finally,their third year or higher. We ignore the direct costs of hiring a new teacher. Finally, we assume a maximum teaching career of 30 years and an exogenous turnover ratewe assume a maximum teaching career of 30 years and an exogenous turnover rate of 5 percent, which is approximately the proportion of experienced teachers whoof 5 percent, which is approximately the proportion of experienced teachers who leave the Los Angeles and New York City districts each year.leave the Los Angeles and New York City districts each year. Tenure or Dismiss after One YearTenure or Dismiss after One Year We begin with a basic example in which the principal must either dismiss orWe begin with a basic example in which the principal must either dismiss or tenure a teacher after one year of teaching based on just one year of student value-tenure a teacher after one year of teaching based on just one year of student value- added data. Figure 1 reports the expected steady-state impact of dismissing a givenadded data. Figure 1 reports the expected steady-state impact of dismissing a given proportion of teachers (the bottom axis) on value added of the average teacherproportion of teachers (the bottom axis) on value added of the average teacher (left axis, solid line) and on the proportion of the teacher workforce who are in(left axis, solid line) and on the proportion of the teacher workforce who are in their first year of teaching (right axis, dashed line).their first year of teaching (right axis, dashed line). The implications of Figure 1 are stark. First, the simulation suggests thereThe implications of Figure 1 are stark. First, the simulation suggests there are substantial gains from using value-added information to dismiss ineffectiveare substantial gains from using value-added information to dismiss ineffective teachers and that the principal should set a very high bar for tenure. To maximizeteachers and that the principal should set a very high bar for tenure. To maximize Figure 1 Effect of Dismissing a Given Proportion of Novice Teachers Based on One Year of Data Notes: Proportion dismissed (x-axis) refers to the proportion of teachers with the lowest value-added estimates that are dismissed after their first year. The solid line (and left axis) shows the steady state impact of each proportion dismissed on the value added of the average teacher, including those in their first year of teaching. Teacher value added is measured in standard deviations of student performance. The dashed line (and right axis) shows the steady state impact of each proportion dismissed on the proportion of the teacher workforce in the first (or novice) year of teaching. Averagevalueadded .08 .06 .04 .02 0 Proportion dismissed Proportionnovice .8 .6 .4 .2 0 Average value added (left axis) Proportion novice (right axis) 0 .2 .4 .6 .8 1
  • 12. 108 Journal of Economic Perspectives average value added, about 80 percent of teachers should be dismissed after theiraverage value added, about 80 percent of teachers should be dismissed after their first year. This aggressive strategy would raise the average value added of teachers infirst year. This aggressive strategy would raise the average value added of teachers in the school to just over 0.08; put differently, the effectiveness of the average teacherthe school to just over 0.08; put differently, the effectiveness of the average teacher (including the rookies) would be greater than roughly 70 percent of the tenured(including the rookies) would be greater than roughly 70 percent of the tenured teachers under the old system. Moreover, it is not the case that most of the gain comesteachers under the old system. Moreover, it is not the case that most of the gain comes from dismissing the very lowest-performing teachers. Indeed, until the principalfrom dismissing the very lowest-performing teachers. Indeed, until the principal reaches the optimum, the gain to being increasingly selective in who receives tenurereaches the optimum, the gain to being increasingly selective in who receives tenure is roughly linear. For example, if the principal dismissed the 40 percent of first-yearis roughly linear. For example, if the principal dismissed the 40 percent of first-year teachers with the lowest value added, rather than 80 percent, the average value addedteachers with the lowest value added, rather than 80 percent, the average value added among teachers in the school would increase by roughly 0.045 in the long run.among teachers in the school would increase by roughly 0.045 in the long run. While these results are surprising relative to current practice, there are aWhile these results are surprising relative to current practice, there are a number of clear reasons why principals might choose to dismiss a large proportionnumber of clear reasons why principals might choose to dismiss a large proportion of novice teachers. Even unreliable performance measures such as value added canof novice teachers. Even unreliable performance measures such as value added can identify substantial and lasting differences across teachers. Differences in teacheridentify substantial and lasting differences across teachers. Differences in teacher effects are large and persistent relative to the short-lived costs of hiring a neweffects are large and persistent relative to the short-lived costs of hiring a new teacher. Since the typical teacher getting tenure will teach for ten years or more,teacher. Since the typical teacher getting tenure will teach for ten years or more, the benefit from setting a high tenure bar will be large. Of course, such unreli-the benefit from setting a high tenure bar will be large. Of course, such unreli- able measures make mistakes. But the long-run cost of retaining an ineffectiveable measures make mistakes. But the long-run cost of retaining an ineffective teacher far outweighs the short-run cost of dismissing an effective teacher. More-teacher far outweighs the short-run cost of dismissing an effective teacher. More- over, because of the uncertainty at the time of hire, new teachers have considerableover, because of the uncertainty at the time of hire, new teachers have considerable option value; for every five new hires, one will be identified as a highly effectiveoption value; for every five new hires, one will be identified as a highly effective teacher and provide many years of valuable service.teacher and provide many years of valuable service. There are many reasons why these simulations could overstate the benefitsThere are many reasons why these simulations could overstate the benefits or understate the costs of such an aggressive tenure policy, and we have tried toor understate the costs of such an aggressive tenure policy, and we have tried to enumerate a number of them here. In general, for reasonable variations in theenumerate a number of them here. In general, for reasonable variations in the parameter values, these issues do not alter our qualitative conclusions.parameter values, these issues do not alter our qualitative conclusions. First, we may have understated the hiring and firing costs facing a principal.First, we may have understated the hiring and firing costs facing a principal. As we discussed earlier, the main cost of turnover is the lower effectiveness of newAs we discussed earlier, the main cost of turnover is the lower effectiveness of new teachers, which corresponds to a cost of well over $100,000 in terms of foregoneteachers, which corresponds to a cost of well over $100,000 in terms of foregone future student earnings. However, even if we double the difference in value addedfuture student earnings. However, even if we double the difference in value added between rookies and experienced teachers (that is, from 0.07 to .14 student levelbetween rookies and experienced teachers (that is, from 0.07 to .14 student level standard deviations), the optimal dismissal rate remains over 75 percent.standard deviations), the optimal dismissal rate remains over 75 percent. Second, we may have understated turnover rates among tenured teachers, espe-Second, we may have understated turnover rates among tenured teachers, espe- cially if principals focus on their own school (rather than the district as a whole)cially if principals focus on their own school (rather than the district as a whole) and highly effective teachers are more likely to move to other schools. Similarly,and highly effective teachers are more likely to move to other schools. Similarly, principals may discount the future more highly because of their own likelihood ofprincipals may discount the future more highly because of their own likelihood of leaving the school, or because they believe that teacher effects will not persist intoleaving the school, or because they believe that teacher effects will not persist into the future (although the evidence suggests otherwise). However, if we double thethe future (although the evidence suggests otherwise). However, if we double the exogenous annual turnover rate from 5 to 10 percent, the optimal dismissal rateexogenous annual turnover rate from 5 to 10 percent, the optimal dismissal rate remains over 70 percent.remains over 70 percent. Third, we may have understated the cost of recruiting teachers. The simulationThird, we may have understated the cost of recruiting teachers. The simulation indicates that a dismissal rate of 80 percent would result in more than 20 percentindicates that a dismissal rate of 80 percent would result in more than 20 percent of the workforce being novice teachers at any time, more than double the currentof the workforce being novice teachers at any time, more than double the current proportion of novices in Los Angeles and New York City. Districts would have toproportion of novices in Los Angeles and New York City. Districts would have to
  • 13. Searching for Effective Teachers with Imperfect Information 109 hire many more teachers to accommodate this strategy, and these new hires wouldhire many more teachers to accommodate this strategy, and these new hires would presumably demand higher wages to compensate for the substantial risk of beingpresumably demand higher wages to compensate for the substantial risk of being dismissed. This is particularly true if we continue to require costly up-front teaching-dismissed. This is particularly true if we continue to require costly up-front teaching- specific training. However, even a doubling of current teacher salaries would not bespecific training. However, even a doubling of current teacher salaries would not be enough to offset the benefits of an aggressive dismissal policy, since a .08 annualenough to offset the benefits of an aggressive dismissal policy, since a .08 annual increase in student achievement is worth more than $100,000 per teacher.increase in student achievement is worth more than $100,000 per teacher. Fourth, our simulations focus on the steady state, and we have ignored whatFourth, our simulations focus on the steady state, and we have ignored what happens along the way. This may be important if we discount the earnings of futurehappens along the way. This may be important if we discount the earnings of future children relative to current children. Specifically, for a school that starts with allchildren relative to current children. Specifically, for a school that starts with all new teachers, an aggressive dismissal policy will result in high fractions of inexpe-new teachers, an aggressive dismissal policy will result in high fractions of inexpe- rienced teachers in the short run even if the equilibrium percentage of rookies isrienced teachers in the short run even if the equilibrium percentage of rookies is lower. For example, if we compare a policy of retaining the top 20 percent of newlower. For example, if we compare a policy of retaining the top 20 percent of new teachers with retaining 90 percent, average teacher effectiveness would be slightlyteachers with retaining 90 percent, average teacher effectiveness would be slightly lower in the first two years after implementing the more aggressive policy, turnlower in the first two years after implementing the more aggressive policy, turn positive in year three, and approach the steady state gains after roughly ten years.positive in year three, and approach the steady state gains after roughly ten years. Nevertheless, we find the optimal dismissal rate is still above 70 percent for annualNevertheless, we find the optimal dismissal rate is still above 70 percent for annual discount rates in a reasonable range (say 2 to 8 percent), and falls to 50 percent onlydiscount rates in a reasonable range (say 2 to 8 percent), and falls to 50 percent only with annual discount rates on the order of 15 percent.with annual discount rates on the order of 15 percent. Fifth, there may be spillover effects in teaching, where good teachers helpFifth, there may be spillover effects in teaching, where good teachers help raise the achievement of their colleagues’ students (Jackson and Bruegmann,raise the achievement of their colleagues’ students (Jackson and Bruegmann, 2009; Koedell, forthcoming). This has two offsetting effects in the context of our2009; Koedell, forthcoming). This has two offsetting effects in the context of our analysis. Spillover effects imply that our estimate of the variation in how teachersanalysis. Spillover effects imply that our estimate of the variation in how teachers impact theirimpact their own students is overstated (because some of the observed effect is duestudents is overstated (because some of the observed effect is due to their colleagues). However, if this bias is roughly 20 percent, as suggested byto their colleagues). However, if this bias is roughly 20 percent, as suggested by Jackson and Bruegmann (2009), so that the true standard deviation in persistentJackson and Bruegmann (2009), so that the true standard deviation in persistent teacher effects was 0.12 rather than 0.15, the optimal dismissal rate would still be 79teacher effects was 0.12 rather than 0.15, the optimal dismissal rate would still be 79 percent in our model. Moreover, spillover effects will also increase the benefits ofpercent in our model. Moreover, spillover effects will also increase the benefits of filling schools entirely with highly effective teachers and could easily imply higherfilling schools entirely with highly effective teachers and could easily imply higher optimal dismissal rates.optimal dismissal rates. Sixth, we have assumed that teachers who do not receive tenure exit the teachingSixth, we have assumed that teachers who do not receive tenure exit the teaching workforce. If teaching effectiveness is measured with error and principals have noworkforce. If teaching effectiveness is measured with error and principals have no power to screen among candidates, then dismissed teachers could move to anotherpower to screen among candidates, then dismissed teachers could move to another school and hope for better luck in their evaluation. If this occurred, the average qualityschool and hope for better luck in their evaluation. If this occurred, the average quality of the applicant pool would decline. This type of phenomenon—poorly performingof the applicant pool would decline. This type of phenomenon—poorly performing teachers moving to new schools, typically those serving more disadvantaged studentsteachers moving to new schools, typically those serving more disadvantaged students (discussed in Boyd, Grossman, Lankford, Loeb, and Wyckoff, 2008)—is already well-(discussed in Boyd, Grossman, Lankford, Loeb, and Wyckoff, 2008)—is already well- known in education, and is referred to as “the dance of the lemons.” This suggestsknown in education, and is referred to as “the dance of the lemons.” This suggests that principals could benefit their colleagues at other schools by sharing performancethat principals could benefit their colleagues at other schools by sharing performance information on teachers. However, if schools were highly selective in granting tenure, itinformation on teachers. However, if schools were highly selective in granting tenure, it might also be true that teachers who receive a bad signal regarding their effectivenessmight also be true that teachers who receive a bad signal regarding their effectiveness would have less incentive to “shop around.”would have less incentive to “shop around.”99 9 A similar complication arises if teaching skills are partially related to subject matter, grade level, or the teacher–school match. The evidence on the specificity of teaching skill is mixed (Boyd, Grossman,
  • 14. 110 Journal of Economic Perspectives Seventh, there is evidence that the impact of a teacher on the achievement ofSeventh, there is evidence that the impact of a teacher on the achievement of current students may fade out over time as those students progress through theircurrent students may fade out over time as those students progress through their remaining years of school (Jacob, Lefgren, and Sims, 2008; Kane and Staiger,remaining years of school (Jacob, Lefgren, and Sims, 2008; Kane and Staiger, 2008). It is unclear whether this greatly weakens the case for raising teacher quality.2008). It is unclear whether this greatly weakens the case for raising teacher quality. We do not know whether fadeout is a general phenomenon or whether it is a resultWe do not know whether fadeout is a general phenomenon or whether it is a result of current levels of heterogeneity in teacher effectiveness. For example, having aof current levels of heterogeneity in teacher effectiveness. For example, having a highly effective teacher in the previous year may do students little good if they arehighly effective teacher in the previous year may do students little good if they are placed with a highly ineffective teacher this year, or if their classmates were placedplaced with a highly ineffective teacher this year, or if their classmates were placed with a highly ineffective teacher the previous year. In other words, teacher effectswith a highly ineffective teacher the previous year. In other words, teacher effects might not fade out if a group of students is given a sequence of highly effectivemight not fade out if a group of students is given a sequence of highly effective teachers. Moreover, raising a student’s academic achievement as measured in ateachers. Moreover, raising a student’s academic achievement as measured in a particular grade may still be valuable even if the student’s score in later grade levelsparticular grade may still be valuable even if the student’s score in later grade levels do not remain at the improved level. For instance, a better knowledge of numericaldo not remain at the improved level. For instance, a better knowledge of numerical operations may still be valuable in the labor market even if it does not lead to betteroperations may still be valuable in the labor market even if it does not lead to better test scores in algebra. Nevertheless, we do view “fade-out” as a primary empiricaltest scores in algebra. Nevertheless, we do view “fade-out” as a primary empirical issue, not just in studies of teachers, but in studies of educational interventionsissue, not just in studies of teachers, but in studies of educational interventions more broadly (for example, Currie and Thomas, 1995).more broadly (for example, Currie and Thomas, 1995). Finally, we may have overstated the reliability of value-added measures. WeFinally, we may have overstated the reliability of value-added measures. We address this issue in considerable detail below. However, even if we cut the reli-address this issue in considerable detail below. However, even if we cut the reli- ability of value added in half (from 40 to 20 percent), the optimal dismissal rateability of value added in half (from 40 to 20 percent), the optimal dismissal rate remains over 70 percent.remains over 70 percent. The Effect of Changing the Time to Tenure ReviewThe Effect of Changing the Time to Tenure Review In our next set of simulations, we evaluate how changing the time until tenureIn our next set of simulations, we evaluate how changing the time until tenure review affects the optimal dismissal rate and the average value added of teachers.review affects the optimal dismissal rate and the average value added of teachers. The first column of Table 2 repeats the results from our benchmark simulationsThe first column of Table 2 repeats the results from our benchmark simulations in which dismissal could only occur at the end of the first year. The next threein which dismissal could only occur at the end of the first year. The next three columns allow the principal to delay tenure review until the second, third, orcolumns allow the principal to delay tenure review until the second, third, or fourth year, and to gather more information about teacher effectiveness beforefourth year, and to gather more information about teacher effectiveness before making a decision regarding dismissal. The next three columnsmaking a decision regarding dismissal. The next three columns require a delay ina delay in tenure review for 2 to 4 years, so that dismissal can occur only after multiple yearstenure review for 2 to 4 years, so that dismissal can occur only after multiple years of value-added data are available to the principal.of value-added data are available to the principal. Not surprisingly, giving a principal the option of waiting to gather more infor-Not surprisingly, giving a principal the option of waiting to gather more infor- mation produces some benefits. Average value added rises to about 0.10 standardmation produces some benefits. Average value added rises to about 0.10 standard deviations with the possibility of delaying tenure review to the fourth year, withdeviations with the possibility of delaying tenure review to the fourth year, with most of the gain coming from delaying tenure until the second year. Even with themost of the gain coming from delaying tenure until the second year. Even with the option to delay the tenure decision, the principal would still dismiss two-thirds ofoption to delay the tenure decision, the principal would still dismiss two-thirds of Lankford, Loeb, and Wyckoff, 2008; Lockwood and McCaffrey, 2009; Jackson, 2010), but it is reason- able to believe that, say, a mediocre teacher of high school physics in Harlem may have made a good fifth grade math teacher in Brooklyn Heights, or vice versa. If principals do have access to informa- tion on the past performance of teachers who did not make tenure, specificity in skill can simply be interpreted as an additional source of error. This may lead principals to be more willing to “take a chance” on a teacher who just missed tenure by trying them in a different subject, grade, or teaching environment.
  • 15. Douglas O. Staiger and Jonah E. Rockoff 111 new hires after the first year, but would wait to dismiss some teachers for whomnew hires after the first year, but would wait to dismiss some teachers for whom there is a reasonable chance that an additional year of data could lead to a betterthere is a reasonable chance that an additional year of data could lead to a better decision. Intuitively, the cut-off score for dismissing a new teacher rises with timedecision. Intuitively, the cut-off score for dismissing a new teacher rises with time on the job, because the option value of waiting to dismiss a teacher declines as theon the job, because the option value of waiting to dismiss a teacher declines as the principal accumulates better information. In other words, to avoid unnecessaryprincipal accumulates better information. In other words, to avoid unnecessary turnover the principal may choose to wait a year before dismissing a teacher whoturnover the principal may choose to wait a year before dismissing a teacher who the principal believes is “below the bar” so long as there is a reasonable chancethe principal believes is “below the bar” so long as there is a reasonable chance that this evaluation could change. Thus, the principal dismisses teachers whosethat this evaluation could change. Thus, the principal dismisses teachers whose expected effectiveness lies below a bar that increases with teacher experience.expected effectiveness lies below a bar that increases with teacher experience. Overall dismissal rates do not change much as the principal is allowed to wait untilOverall dismissal rates do not change much as the principal is allowed to wait until year 2, 3, or 4 to make a decision, but the extra time allows the principal to betteryear 2, 3, or 4 to make a decision, but the extra time allows the principal to better identify the remaining subset of teachers for tenure.identify the remaining subset of teachers for tenure. In contrast,In contrast, requiring principals to delay tenure review—that is, removing theprincipals to delay tenure review—that is, removing the option of dismissal until year 2, 3, or 4—would lead to lower average teacher valueoption of dismissal until year 2, 3, or 4—would lead to lower average teacher value added, relative to the baseline case. Essentially, this policy forces principals toadded, relative to the baseline case. Essentially, this policy forces principals to retain low-performing teachers additional years, and this outweighs the benefits ofretain low-performing teachers additional years, and this outweighs the benefits of the additional information the principal would obtain by waiting to see additionalthe additional information the principal would obtain by waiting to see additional years of performance data. Note that this policy also leads to fewer teachers beingyears of performance data. Note that this policy also leads to fewer teachers being dismissed overall, since the option value of hiring a new teacher (who may turn outdismissed overall, since the option value of hiring a new teacher (who may turn out to be ineffective and must be retained for several years) has fallen.to be ineffective and must be retained for several years) has fallen. Obtaining More Reliable Information at the Time of HireObtaining More Reliable Information at the Time of Hire We have assumed that principals have no useful information at the time of hire.We have assumed that principals have no useful information at the time of hire. This implies that radical increases in hiring rates (as required by a dismissal rateThis implies that radical increases in hiring rates (as required by a dismissal rate of 80 percent) do not affect the quality of new hires—each individual is a randomof 80 percent) do not affect the quality of new hires—each individual is a random Table 2 Effect of Delaying Tenure Decisions beyond the First Year, Options vs. Requirements Baseline: Dismissal at T = 1 Dismissal allowed at any time until Require dismissal only occur at time T = 1 T = 2 T = 3 T = 4 T = 2 T = 3 T = 4 Average value added 0.080 0.095 0.099 0.101 0.075 0.068 0.061 % Dismissed overall 81% 83% 84% 84% 75% 71% 68% % Dismissed annually At T = 1 81% 67% 67% 67% At T = 2 16% 8% 8% 75% At T = 3 9% 4% 71% At T = 4 5% 68% Notes: Average value added refers to the average level of teachers’ value-added estimates in the steady state under an optimal dismissal policy, and it includes both untenured and tenured teachers. (Teacher value added is measured in standard deviations of student performance.) “Percentages dismissed” refers to the percent of a single cohort of newly hired teachers dismissed during years leading up to when a tenure decision is required (year T ).
  • 16. 112 Journal of Economic Perspectives draw from a generally qualified applicant pool. But many districts and principalsdraw from a generally qualified applicant pool. But many districts and principals put substantial effort into screening and interviewing new hires, suggesting thatput substantial effort into screening and interviewing new hires, suggesting that even small amounts of information at the time of hire may be valuable.even small amounts of information at the time of hire may be valuable. Figure 2 shows how changing the reliability of the pre-hire signal affects theFigure 2 shows how changing the reliability of the pre-hire signal affects the optimal dismissal rate (right axis, dashed line), and the resulting value added ofoptimal dismissal rate (right axis, dashed line), and the resulting value added of the average teacher in the school (left axis, solid line). For these simulations, wethe average teacher in the school (left axis, solid line). For these simulations, we assumed that the principal could only dismiss teachers after the first year (assumed that the principal could only dismiss teachers after the first year (T == 1).1). We also assumed that the pool of potential applicants was ten times the numberWe also assumed that the pool of potential applicants was ten times the number needed to replace teachers leaving through exogenous turnover, corresponding toneeded to replace teachers leaving through exogenous turnover, corresponding to estimates that New York City and Los Angeles currently have about 10 applicantsestimates that New York City and Los Angeles currently have about 10 applicants for each position. Our baseline simulation corresponds to a reliability of 0 in thefor each position. Our baseline simulation corresponds to a reliability of 0 in the pre-hire signal, at the far left in this figure.pre-hire signal, at the far left in this figure. Figure 2 suggests that pre-hire information on teacher effectiveness is poten-Figure 2 suggests that pre-hire information on teacher effectiveness is poten- tially quite valuable. Compared to having no information at the time of hire, atially quite valuable. Compared to having no information at the time of hire, a Figure 2 Effect of Increasing the Reliability of the Pre-hire Performance Signal on Value Added of Average Teacher and Proportion of Teachers Dismissed after One Year Notes: Reliability (x-axis) refers to the proportion of variance in the pre-hire performance signal that is due to the persistent component of teacher performance. The solid line (and left axis) shows the steady state impact of reliability on the value added of the average teacher, including those in their first year of teaching, based on the optimal proportion of teachers dismissed after one year. (Teacher value added is measured in standard deviations of student performance.) The dashed line (and right axis) shows the steady state impact of reliability on the optimal proportion dismissed after one year. Proportiondismissed Reliability of pre-hire performance signal Averagevalueadded Average value added (left axis) Proportion dismissed (right axis) 0 .2 .4 .6 .8 1 .25 .2 .15 .1 .8 .6 .4 .2 0
  • 17. Searching for Effective Teachers with Imperfect Information 113 perfect pre-hire signal with 100 percent reliability would nearly triple the gain toperfect pre-hire signal with 100 percent reliability would nearly triple the gain to the value added of the teacher workforce, and of course would eliminate the needthe value added of the teacher workforce, and of course would eliminate the need to dismiss teachers after hire. More interestingly, even a low reliability signal ofto dismiss teachers after hire. More interestingly, even a low reliability signal of 20 percent at the time of hire doubles the gain to the value added of the teacher20 percent at the time of hire doubles the gain to the value added of the teacher workforce relative to the benchmark case with no pre-hire information. However,workforce relative to the benchmark case with no pre-hire information. However, access to a pre-hire signal does not eliminate the need to dismiss additional teachersaccess to a pre-hire signal does not eliminate the need to dismiss additional teachers after hire. As long as there is remaining uncertainty about teacher effectivenessafter hire. As long as there is remaining uncertainty about teacher effectiveness among the teachers that are hired, there will be a benefit to dismissing additionalamong the teachers that are hired, there will be a benefit to dismissing additional teachers after observing classroom performance.teachers after observing classroom performance. Obtaining More Reliable Measures of On-the-Job PerformanceObtaining More Reliable Measures of On-the-Job Performance Figure 3 shows how changing the reliability of the on-the-job signal affects theFigure 3 shows how changing the reliability of the on-the-job signal affects the optimal timing of tenure (regions delineated by dotted lines, labeled at top), theoptimal timing of tenure (regions delineated by dotted lines, labeled at top), the optimal dismissal rate (right axis, dashed line), and the resulting value added ofoptimal dismissal rate (right axis, dashed line), and the resulting value added of the average teacher in the school (left axis, solid line). For these simulations, wethe average teacher in the school (left axis, solid line). For these simulations, we assumed that the principal could only dismiss teachers at tenure time (assumed that the principal could only dismiss teachers at tenure time (T).). Many school districts are currently engaged in efforts to improve the reliabilityMany school districts are currently engaged in efforts to improve the reliability with which they can measure teacher performance, through the use of additionalwith which they can measure teacher performance, through the use of additional information from classroom observation, student work, and student or parentinformation from classroom observation, student work, and student or parent surveys. Figure 3 suggests that more reliable measures of teacher performancesurveys. Figure 3 suggests that more reliable measures of teacher performance are quite valuable. Relative to our baseline simulation, in which reliability of theare quite valuable. Relative to our baseline simulation, in which reliability of the annual performance measure was 40 percent (.4 in the figure), a measure withannual performance measure was 40 percent (.4 in the figure), a measure with perfect reliability would nearly double the gains from selecting effective teachers (toperfect reliability would nearly double the gains from selecting effective teachers (to 0.14 standard deviations) while having little impact on the proportion of teachers0.14 standard deviations) while having little impact on the proportion of teachers dismissed. If districts relied on performance measures that were less reliable thandismissed. If districts relied on performance measures that were less reliable than our baseline case, the gains from selecting effective teachers would be reduced, andour baseline case, the gains from selecting effective teachers would be reduced, and it would become optimal for the principal to wait longer before dismissing a teacher.it would become optimal for the principal to wait longer before dismissing a teacher. Interestingly, the proportion of teachers dismissed does not decline much until theInterestingly, the proportion of teachers dismissed does not decline much until the reliability of the performance measure drops below 5 percent (.05 in the figure).reliability of the performance measure drops below 5 percent (.05 in the figure). Even very weak signals of teacher performance eventually identify differencesEven very weak signals of teacher performance eventually identify differences between teachers that make the benefits of selectively awarding tenure swamp thebetween teachers that make the benefits of selectively awarding tenure swamp the cost of having to hire additional inexperienced teachers.cost of having to hire additional inexperienced teachers. ConclusionConclusion In the ongoing debate over how to improve teaching quality in public schools,In the ongoing debate over how to improve teaching quality in public schools, there have been conflicting claims regarding the usefulness of currently availablethere have been conflicting claims regarding the usefulness of currently available measures of teacher effectiveness. For example, in reference to a proposed initia-measures of teacher effectiveness. For example, in reference to a proposed initia- tive to measure teacher effectiveness using student test scores, the head of the Newtive to measure teacher effectiveness using student test scores, the head of the New York City teachers’ union Randi Weingarten stated: “There is no way that any of thisYork City teachers’ union Randi Weingarten stated: “There is no way that any of this current data could actually, fairly, honestly or with any integrity be used to isolate thecurrent data could actually, fairly, honestly or with any integrity be used to isolate the contributions of an individual teacher” (as reported by Medina, 2008). In contrast, thecontributions of an individual teacher” (as reported by Medina, 2008). In contrast, the U.S. Secretary of Education Arne Duncan (2009) has stated: “I have an open mindU.S. Secretary of Education Arne Duncan (2009) has stated: “I have an open mind
  • 18. 114 Journal of Economic Perspectives about teacher evaluation, but we need to find a way to measure classroom success andabout teacher evaluation, but we need to find a way to measure classroom success and teacher effectiveness. Pretending that student outcomes are not part of the equation isteacher effectiveness. Pretending that student outcomes are not part of the equation is like pretending that professional basketball has nothing to do with the score.”like pretending that professional basketball has nothing to do with the score.” Given the available evidence, we have tried to evaluate systematically howGiven the available evidence, we have tried to evaluate systematically how school leaders should use the currently available but imperfect measures of teacherschool leaders should use the currently available but imperfect measures of teacher effectiveness to recruit, evaluate, and retain teachers. Our simulations suggesteffectiveness to recruit, evaluate, and retain teachers. Our simulations suggest that using existing information on teacher performance to aggressively selectthat using existing information on teacher performance to aggressively select teachers would yield substantial annual gains in academic achievement of aroundteachers would yield substantial annual gains in academic achievement of around 0.08 student level standard deviations. These are comparable to the annual test0.08 student level standard deviations. These are comparable to the annual test score gains found in recent experimental evaluations of charter schools (Hoxbyscore gains found in recent experimental evaluations of charter schools (Hoxby and Murarka, 2009; Abdulkadiroglu, Angrist, Dynarski, Kane, and Pathak, 2009)and Murarka, 2009; Abdulkadiroglu, Angrist, Dynarski, Kane, and Pathak, 2009) Figure 3 Effect of Reliability of the Annual Performance Measure on Optimal Timing of Tenure, Optimal Dismissal Rate, and Value Added of Average Teacher Proportiondismissed Reliability of annual performance measure Averagevalueadded Average value added (left axis) Proportion dismissed (right axis) 0 .1 .2 .3 .4 .5 .6 .7 .8 .9 1 .16 .14 .12 .1 .08 .06 .04 .02 0 .8 .7 .6 .5 .4 .3 .2 .1 0 T = 3 T = 2 T = 1T > 3 Notes: Figure 3 shows how changing the reliability of the on-the-job signal affects the optimal timing of tenure (regions delineated by dotted lines, labeled at top), the optimal dismissal rate (right axis, dashed line), and the resulting value added of the average teacher in the school (left axis, solid line). For these simulations, we assumed that the principal could only dismiss teachers at tenure time (T). Reliability (x-axis) refers to the correlation of the annual performance measure across years within the same teacher. The dashed line (and right axis) shows the steady state impact of reliability on the proportion dismissed. The solid line (and left axis) shows the steady state impact of reliability on the value added of the average teacher, including those in their first year of teaching, based on the optimal proportion of teachers dismissed after the optimal waiting period (T). (Teacher value added is measured in standard deviations of student performance.) The regions separated by horizontal dotted lines denote the optimal year in which the tenure decision should be made (T) for different levels of reliability.