More Related Content
Similar to Pc12 sol c06_ptest
Similar to Pc12 sol c06_ptest (20)
More from Garden City (20)
Pc12 sol c06_ptest
- 1. 08_ch06b_pre-calculas12_wncp_solution.qxd 5/22/12 3:55 PM Page 51
Home Quit
P R AC T I C E T E S T, p a g e s 5 6 7 – 5 7 0
1. Multiple Choice Given cos u ϭ 0.4, which is the value of cos (u ϩ )?
A. 0.6 B. Ϫ0.6 C. 0.4 D. Ϫ0.4
2. Multiple Choice A sinusoidal function f(x) has period 5 and passes
through the point P(5, 0). Which of the following values can be
determined from this information?
I. f(0) II. f(5) III. f(15)
A. I only B. II only C. III only D. I, II, and III
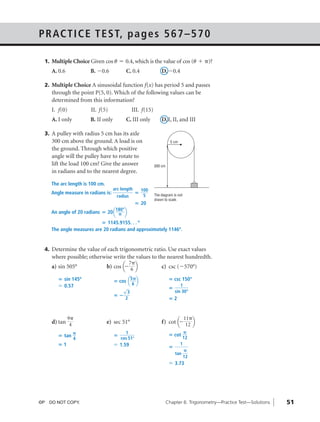
3. A pulley with radius 5 cm has its axle
300 cm above the ground. A load is on 5 cm
the ground. Through which positive
angle will the pulley have to rotate to
lift the load 100 cm? Give the answer 300 cm
in radians and to the nearest degree.
The arc length is 100 cm.
arc length 100
Angle measure in radians is: ؍ The diagram is not
radius 5
drawn to scale.
02 ؍
An angle of 20 radians 02 ؍a b
180°
. . .5519.5411 ؍º
The angle measures are 20 radians and approximately 1146º.
4. Determine the value of each trigonometric ratio. Use exact values
where possible; otherwise write the values to the nearest hundredth.
7
a) sin 505° b) cos a- 6 b c) csc (Ϫ570°)
؍sin 145º ؍cos a b ؍csc 150°
5
Џ 0.57 6 1
√ ؍
3 sin 30°
؊؍
2 2؍
9 11
d) tan 4 e) sec 51° f) cot a- 12 b
1
؍tan ؍ ؍cot
4 cos 51° 12
1؍ Џ 1.59 ؍
1
tan
12
Џ 3.73
©P DO NOT COPY. Chapter 6: Trigonometry—Practice Test—Solutions 51
- 2. 08_ch06b_pre-calculas12_wncp_solution.qxd 5/22/12 3:55 PM Page 52
Home Quit
3
5. Given sin u ϭ - 7 and tan u > 0
a) Determine the values of the other 5 trigonometric ratios for u.
The terminal arm of the angle lies in Quadrant 3, where x is negative.
Use: x2 ؉ y2 ؍r2 Substitute: y ,3؊ ؍r = 7
x ؉ 9 94 ؍
2
√
x 04 ؊ ؍
r x r y x
csc U ؍y cos U ؍r sec U ؍x tan U ؍x cot U ؍y
√ √
7 40 7 3
؊؍ ؊؍ √؊ ؍ √؍ 40
3 7 40 40
؍
3
b) For 0 ≤ u < 2, determine the measure of u in radians and in
degrees, to the nearest tenth.
The reference angle is sin؊1 a b .
3
7
In degrees, the reference angle is In radians, the reference angle is
25.3769. . . º 0.4429. . .
So, U 081 ؍º ؉ 25.3769. . . º So, U . . .9244.0 ؉ ؍
Џ 205.4º Џ 3.6
6. Given the function: y ϭ 2 cos a + 2 b ϩ 1
1
2x
a) Determine these characteristics of the function:
amplitude; period; phase shift
cos 2 ax ؉ b ؉ 1
1
Write the function as: y ؍
2 4
1 2
The amplitude is . The period is . ؍The phase shift is ؊ .
2 2 4
b) Graph the function for Ϫ2 ≤ x ≤ 2.
y 1
2 yϭ
2 (
cos 2x ϩ
2 )
ϩ1
1
x
Ϫ 0
Ϫ1 1
yϭ cos 2x
2
Ϫ2
1
Sample response: Graph y ؍ cos 2x, then translate several points on
2
the graph units left and 1 unit up. Join these points for the graph of
4
cos a2x ؉ b ؉ 1.
1
y؍
2 2
52 Chapter 6: Trigonometry—Practice Test—Solutions DO NOT COPY. ©P
- 3. 08_ch06b_pre-calculas12_wncp_solution.qxd 5/22/12 3:55 PM Page 53
Home Quit
c) Determine these characteristics of the graph of
y ϭ 2 cos a + 2 b + 1: domain; range; zeros
1
2x
The domain is: ؊2 ◊ x ◊ 2; the range is: 0.5 ◊ y ◊ 1.5; there are
no zeros.
7. The table shows the mean monthly temperatures for Winnipeg, MB,
from May, 2010 to April, 2011.
Mean Monthly Temperature for Winnipeg
Mean monthly
T
Month temperature (°C) 20
May 12.7
16
June 16.9
12
July 20.4
Aug. 19.1 8
Sept. 11.6 4
Oct. 8.2 m
Nov. Ϫ3.1 0 2 4 6 8 10
Dec. Ϫ13.8 Ϫ4
Jan. Ϫ18.4 Ϫ8
Feb. Ϫ13.8
Ϫ12
Mar. Ϫ8.0
Ϫ16
Apr. 4.6
Ϫ20
a) Graph the data, then write an equation of a sinusoidal function
that models the data.
Sample response: Let T represent the mean monthly temperatures in
degrees Celsius, and m represent the months numbered 0 to 11.
Use a cosine function to model the data: T(m) ؍a cos b(m ؊ c) ؉ d
From the graph:
• the first maximum point has approximate coordinates (2, 20.4) and
the first minimum point has approximate coordinates (8, ؊18.4),
so the equation of the centre line is approximately:
20.4 ؊ 18.4
T؍ , or T ;1 ؍so d Џ 1
2
• the amplitude is approximately: 20.4 ؊ 1 ;4.91 ؍so a Џ 19.4
2
• the period is approximately 12 months; so b Џ , or
12 6
• the phase shift is the m-coordinate of the first maximum point;
so c Џ 2
A function that approximates the data is: T(m) 4.91 ؍cos (m ؊ 2) ؉ 1
6
©P DO NOT COPY. Chapter 6: Trigonometry—Practice Test—Solutions 53
- 4. 08_ch06b_pre-calculas12_wncp_solution.qxd 5/22/12 3:55 PM Page 54
Home Quit
b) Use graphing technology to estimate the mean monthly
temperature for April 2010 and for May 2011.
Graph: y 4.91 ؍cos (x ؊ 2) ؉ 1.
6
For April 2010, x ;1؊ ؍from the graph, when x ,1؊ ؍y 1 ؍
So, the mean monthly temperature for April 2010 was approximately 1ºC.
For May 2011, x ;21 ؍from the graph, when x ,21 ؍y 7.01 ؍
So, the mean monthly temperature for May 2011 was approximately
10.7ºC.
54 Chapter 6: Trigonometry—Practice Test—Solutions DO NOT COPY. ©P