September 2017 rebgv statistics package mike stewart realtor
•
1 like•680 views

https://www.mikestewart.ca/

Recommended
Recommended
More Related Content
What's hot
What's hot (17)
Similar to September 2017 rebgv statistics package mike stewart realtor
Similar to September 2017 rebgv statistics package mike stewart realtor (20)
More from Mike Stewart
More from Mike Stewart (15)
Recently uploaded
Recently uploaded (20)
September 2017 rebgv statistics package mike stewart realtor
- 1. News Release FOR IMMEDIATE RELEASE: Home buyer demand continues to differ based on housing type VANCOUVER, BC – October 3, 2017 – Apartment and townhome activity is outpacing the detached home market across Metro Vancouver*. This activity helped push total residential sales above the historical average in September. The Real Estate Board of Greater Vancouver (REBGV) reports that residential property sales in the region totalled 2,821 in September 2017, a 25.2 per cent increase from the 2,253 sales recorded in September 2016, and a 7.3 per cent decrease compared to August 2017 when 3,043 homes sold. Last month’s sales were 13.1 per cent above the 10-year September sales average. “Our detached homes market is balanced today, while apartment and townhome sales remain in sellers' market territory,” Jill Oudil, REBGV president said. “If you’re looking to enter the market, as either a buyer or seller, it’s important to understand these trends and use this information to set realistic expectations.” There were 5,375 detached, attached and apartment properties newly listed for sale on the Multiple Listing Service® (MLS®) in Metro Vancouver in September 2017. This represents a 12 per cent increase compared to the 4,799 homes listed in September 2016 and a 26.6 per cent increase compared to August 2017 when 4,245 homes were listed. The total number of homes currently listed for sale on the MLS® system in Metro Vancouver is 9,466, a 1.2 per cent increase compared to September 2016 (9,354) and a 7.5 per cent increase compared to August 2017 (8,807). “Detached homes made up 30 per cent of all sales in September and represented 62 per cent of all the homes listed for sale on the MLS®,” said Oudil. “This dynamic has slowed the pace of upward pressure that we’ve seen on detached home prices in our market over the last few years.” For all property types, the sales-to-active listings ratio for September 2017 is 29.8 per cent. By property type, the ratio is 14.6 per cent for detached homes, 42.3 per cent for townhomes, and 60.4 per cent for apartments. Generally, analysts say that downward pressure on home prices occurs when the ratio dips below the 12 per cent mark for a sustained period, while home prices often experience upward pressure when it surpasses 20 per cent over several months.
- 2. The MLS® Home Price Index composite benchmark price for all residential properties in Metro Vancouver is currently $1,037,300. This represents a 10.9 per cent increase over September 2016 and a 0.7 per cent increase compared to August 2017. Sales of detached properties in September 2017 reached 852, a 27.9 per cent increase from the sales recorded in September 2016 (666), a decrease of 33 per cent from September 2015 (1,272), and a decrease of 32.9 per cent from September 2014 (1,270). The benchmark price for detached properties is $1,617,300. This represents a 2.9 per cent increase from September 2016 and a 0.1 per cent increase compared to August 2017. Sales of apartment properties reached 1,451 in September 2017, a 19.1 per cent increase compared from the sales recorded in September 2016 (1,218), a 5.1 per cent decrease from September 2015 (1,529), and a 22.1 per cent increase from September 2014 (1,188). The benchmark price of an apartment property is $635,800. This represents a 21.7 per cent increase from September 2016 and a 1.4 per cent increase compared to August 2017. Attached property sales in September 2017 totalled 518, a 40.4 per cent increase compared to the sales recorded in September 2016 (369), a 4.8 per cent decrease from September 2015 (544), and an 11.6 per cent increase from September 2014 (464). The benchmark price of an attached home is $786,600. This represents a 14.5 per cent increase from September 2016 and a 1.1 per cent increase compared to August 2017. -30- *Editor’s Note: Areas covered by the Real Estate Board of Greater Vancouver include: Whistler, Sunshine Coast, Squamish, West Vancouver, North Vancouver, Vancouver, Burnaby, New Westminster, Richmond, Port Moody, Port Coquitlam, Coquitlam, Pitt Meadows, Maple Ridge, and South Delta. The real estate industry is a key economic driver in British Columbia. In 2016, 39,943 homes changed ownership in the Board’s area, generating $2.5 billion in economic spin-off activity and an estimated 17,600 jobs. The total dollar value of residential sales transacted through the MLS® system in Greater Vancouver totalled $40 billion in 2016. The Real Estate Board of Greater Vancouver is an association representing more than 13,500 REALTORS® and their companies. The Board provides a variety of member services, including the Multiple Listing Service®. For more information on real estate, statistics, and buying or selling a home, contact a local REALTOR® or visit www.rebgv.org. For more information please contact: Craig Munn Manager, Communication Real Estate Board of Greater Vancouver 604.730.3146 cmunn@rebgv.org
- 3. Property Type Area Benchmark Price Price Index 1 Month Change % 3 Month Change % 6 Month Change % 1 Year Change % 3 Year Change % 5 Year Change % 10 Year Change % Residential / Composite Lower Mainland $936,400 264.2 0.7% 4.5% 12.0% 12.4% 64.4% 70.6% 86.5% Greater Vancouver $1,037,300 271.2 0.7% 3.9% 11.1% 10.9% 62.3% 70.1% 90.9% Bowen Island $959,900 208.1 1.9% 7.6% 12.6% 20.5% 63.0% 62.1% 51.1% Burnaby East $951,600 264.7 -1.2% 3.8% 11.2% 11.5% 60.5% 68.8% 87.3% Burnaby North $885,900 267.5 1.0% 3.5% 9.1% 12.9% 63.1% 73.3% 89.4% Burnaby South $997,000 281.6 1.2% 4.1% 11.4% 14.5% 65.7% 72.7% 99.2% Coquitlam $905,200 268.5 0.4% 4.8% 13.8% 14.5% 68.2% 77.7% 92.5% Ladner $854,700 239.9 1.2% 3.6% 8.3% -0.3% 53.9% 58.3% 75.6% Maple Ridge $673,600 226.5 1.5% 6.7% 14.4% 16.4% 68.4% 69.0% 65.3% New Westminster $649,200 278.3 0.7% 7.9% 17.1% 20.0% 69.4% 74.7% 89.4% North Vancouver $1,094,300 245.9 0.2% 2.8% 9.5% 7.9% 59.3% 64.6% 78.7% Pitt Meadows $667,300 244.1 2.7% 8.2% 17.4% 19.2% 70.0% 77.5% 73.5% Port Coquitlam $715,800 252.5 -0.3% 4.5% 14.3% 17.2% 69.0% 76.0% 77.7% Port Moody $895,100 247.4 1.6% 5.5% 14.6% 15.0% 64.9% 75.1% 78.4% Richmond $980,500 286.3 0.6% 3.4% 10.5% 10.1% 63.5% 69.6% 103.5% Squamish $794,000 254.2 5.1% 10.4% 11.2% 23.3% 87.7% 94.5% 100.0% Sunshine Coast $583,700 204.5 1.4% 4.8% 12.1% 21.1% 64.5% 59.3% 49.1% Tsawwassen $997,000 250.4 0.9% 4.0% 7.6% 0.8% 60.4% 64.5% 80.3% Vancouver East $1,080,900 316.5 0.2% 3.4% 10.8% 9.7% 65.2% 77.4% 115.9% Vancouver West $1,355,900 285.9 0.7% 2.1% 10.2% 8.8% 57.4% 70.4% 94.9% West Vancouver $2,626,900 282.4 -1.0% -0.1% 5.3% -6.1% 54.2% 67.1% 95.0% Whistler $930,500 204.6 6.2% 14.2% 13.5% 22.7% 80.4% 86.8% 63.2% Single Family Detached Lower Mainland $1,326,900 281.5 0.0% 2.7% 9.4% 5.7% 65.4% 73.1% 102.5% Greater Vancouver $1,617,300 297.2 0.1% 1.9% 8.0% 2.9% 62.8% 71.5% 112.1% Bowen Island $959,900 208.1 1.9% 7.6% 12.6% 20.5% 63.0% 62.1% 51.1% Burnaby East $1,275,000 285.1 -3.5% 1.2% 9.9% 3.8% 63.1% 69.7% 105.4% Burnaby North $1,596,300 308.7 0.2% 1.4% 5.1% 2.0% 63.6% 75.6% 121.6% Burnaby South $1,728,600 330.9 0.6% 0.5% 7.2% 2.3% 67.9% 72.1% 136.9% Coquitlam $1,280,600 284.2 0.1% 1.9% 11.1% 5.8% 67.8% 79.8% 107.0% Ladner $1,015,100 244.7 1.5% 4.0% 7.1% -4.7% 57.0% 63.1% 82.6% Maple Ridge $812,600 231.5 1.1% 4.7% 13.1% 13.3% 69.8% 73.8% 72.9% New Westminster $1,138,500 284.0 -3.2% 1.2% 9.1% 6.1% 64.2% 67.7% 104.0% North Vancouver $1,713,000 267.9 0.1% 1.3% 7.2% 1.9% 66.1% 74.8% 97.7% Pitt Meadows $892,500 251.5 1.8% 6.2% 15.3% 12.5% 72.4% 79.4% 85.3% Port Coquitlam $995,800 265.5 -0.7% 0.5% 11.9% 11.9% 68.7% 78.8% 94.2% Port Moody $1,497,200 276.5 0.4% 3.6% 11.0% 8.3% 66.4% 75.6% 99.4% Richmond $1,695,000 340.4 1.1% 2.7% 8.9% 1.5% 69.6% 73.3% 139.4% Squamish $994,700 253.9 2.0% 5.0% 8.5% 20.5% 80.8% 90.9% 100.1% Sunshine Coast $580,300 203.3 1.4% 4.8% 12.1% 20.9% 64.2% 58.8% 48.3% Tsawwassen $1,269,700 273.4 1.1% 4.1% 7.6% 0.0% 68.5% 75.4% 98.1% Vancouver East $1,564,900 345.9 0.0% 2.0% 7.8% 1.8% 65.1% 84.3% 146.2% Vancouver West $3,653,500 375.1 0.0% 0.7% 5.5% 0.8% 58.7% 74.7% 144.0% West Vancouver $3,136,600 296.1 -1.7% 0.3% 5.2% -8.5% 54.7% 67.7% 105.1% Whistler $1,643,600 208.4 0.4% 4.9% 6.7% 17.0% 70.3% 74.5% 67.3% HOW TO READ THE TABLE: • Benchmark Price: Estimated sale price of a benchmark property. Benchmarks represent a typical property within each market. • Price Index: Index numbers estimate the percentage change in price on typical and constant quality properties over time. All figures are based on past sales. • x Month/Year Change %: Percentage change of index over a period of x month(s)/year(s) * In January 2005, the indexes are set to 100. Townhome properties are similar to Attached properties, a category that was used in the previous MLSLink HPI, but do not included duplexes. The above info is deemed reliable, but is not guaranteed. All dollar amounts in CDN. September 2017* * MLS®, Multiple Listing Service®, and all related graphics are trademarks of The Canadian Real Estate Association 1 of 15
- 4. Property Type Area Benchmark Price Price Index 1 Month Change % 3 Month Change % 6 Month Change % 1 Year Change % 3 Year Change % 5 Year Change % 10 Year Change % September 2017* Townhouse Lower Mainland $661,600 239.1 1.2% 6.0% 12.4% 15.5% 61.3% 65.0% 72.8% Greater Vancouver $786,600 253.8 1.1% 5.5% 10.8% 14.5% 60.2% 67.2% 83.2% Burnaby East $636,500 235.1 1.1% 4.1% 9.1% 22.3% 49.6% 53.2% 68.9% Burnaby North $701,900 262.0 0.6% 2.0% 9.0% 16.2% 56.8% 68.2% 82.3% Burnaby South $747,800 257.6 -3.2% 0.5% 10.1% 14.0% 54.6% 63.6% 83.7% Coquitlam $641,400 235.3 0.2% 3.9% 10.0% 16.4% 58.3% 63.7% 72.8% Ladner $742,500 258.9 1.2% 1.5% 11.2% 13.1% 57.1% 62.2% 82.3% Maple Ridge $514,600 238.9 1.3% 9.2% 15.6% 22.2% 73.5% 72.6% 70.9% New Westminster $668,400 264.3 2.4% 4.3% 9.9% 20.2% 56.8% 66.0% 88.0% North Vancouver $964,700 234.4 -0.4% 2.8% 6.3% 7.0% 56.3% 61.8% 75.3% Pitt Meadows $572,900 247.9 1.8% 6.9% 16.9% 20.6% 73.8% 74.8% 75.3% Port Coquitlam $635,400 239.7 -1.2% 7.4% 14.0% 16.2% 65.0% 70.6% 70.2% Port Moody $605,400 204.6 -0.5% 3.6% 15.9% 11.0% 44.0% 47.0% 45.8% Richmond $801,500 263.4 0.1% 4.6% 9.4% 12.3% 56.6% 62.2% 92.8% Squamish $804,800 292.4 15.2% 18.3% 8.7% 29.4% 115.2% 127.2% 134.9% Tsawwassen $737,500 274.7 2.4% 0.8% 9.8% 17.1% 65.0% 66.7% 93.5% Vancouver East $851,200 279.4 -0.9% 4.6% 14.5% 9.7% 55.0% 66.9% 86.8% Vancouver West $1,265,100 279.4 0.9% 4.4% 10.7% 11.7% 61.4% 79.3% 101.6% Whistler $912,000 243.9 11.9% 16.6% 7.3% 18.2% 80.5% 89.2% 103.3% Apartment Lower Mainland $585,300 255.9 1.7% 6.7% 16.5% 23.9% 66.7% 70.9% 74.0% Greater Vancouver $635,800 255.5 1.4% 5.8% 15.7% 21.7% 64.8% 71.5% 75.6% Burnaby East $682,500 259.1 2.2% 12.9% 22.7% 28.5% 64.1% 93.4% 72.4% Burnaby North $576,700 246.2 1.9% 5.8% 13.2% 24.8% 67.0% 75.4% 73.5% Burnaby South $664,500 266.8 2.7% 7.6% 15.1% 25.0% 70.3% 78.7% 86.4% Coquitlam $482,300 264.7 1.1% 9.0% 19.6% 30.3% 76.9% 83.3% 83.1% Ladner $422,800 200.4 0.8% 6.4% 9.5% 3.4% 36.6% 35.2% 42.2% Maple Ridge $262,400 189.5 4.1% 12.8% 21.2% 28.7% 57.8% 45.2% 26.3% New Westminster $488,600 278.5 1.8% 10.8% 21.2% 26.5% 73.7% 79.1% 85.5% North Vancouver $553,500 225.3 0.4% 4.8% 14.4% 19.5% 54.7% 54.4% 60.0% Pitt Meadows $392,300 231.9 5.0% 12.5% 21.8% 28.5% 63.3% 78.9% 54.6% Port Coquitlam $414,200 247.7 0.5% 7.0% 17.4% 24.8% 74.6% 78.1% 64.1% Port Moody $601,300 250.6 3.6% 8.4% 17.9% 25.2% 75.7% 91.2% 82.7% Richmond $598,600 255.5 0.7% 4.5% 15.1% 26.4% 65.1% 73.5% 79.7% Squamish $466,700 224.8 2.1% 12.9% 23.5% 27.0% 83.5% 75.5% 71.1% Tsawwassen $451,500 190.4 0.5% 5.6% 9.6% 6.1% 41.2% 37.4% 35.1% Vancouver East $535,600 295.5 1.2% 5.5% 15.2% 23.4% 70.4% 75.3% 90.6% Vancouver West $796,100 258.3 1.1% 3.0% 13.6% 15.8% 60.7% 70.4% 77.6% West Vancouver $1,153,700 233.7 2.3% -1.2% 7.0% 15.2% 56.6% 66.5% 60.0% Whistler $526,100 172.5 4.4% 18.4% 27.9% 33.6% 107.6% 124.9% 32.0% HOW TO READ THE TABLE: • Benchmark Price: Estimated sale price of a benchmark property. Benchmarks represent a typical property within each market. • Price Index: Index numbers estimate the percentage change in price on typical and constant quality properties over time. All figures are based on past sales. • x Month/Year Change %: Percentage change of index over a period of x month(s)/year(s) In January 2005, the indexes are set to 100. * Townhome properties are similar to attached properties, a category that was used in the previous MLSLink HPI, but do not included duplexes. Lower Mainland includes areas serviced by both Real Estate Board of Greater Vancouver & Fraser Valley Real Estate Board. The above info is deemed reliable, but is not guaranteed. All dollar amounts in CDN. * MLS®, Multiple Listing Service®, and all related graphics are trademarks of The Canadian Real Estate Association 2 of 15
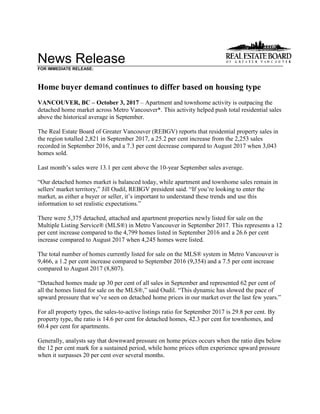
- 5. C:DATAMonthEndHpiexporthi_resgv-hpi2.tifGreaterVancouver 5YearTrend 60 110 160 210 260 310 Sep 2012 Nov 2012 Jan 2013 Mar 2013 May 2013 Jul 2013 Sep 2013 Nov 2013 Jan 2014 Mar 2014 May 2014 Jul 2014 Sep 2014 Nov 2014 Jan 2015 Mar 2015 May 2015 Jul 2015 Sep 2015 Nov 2015 Jan 2016 Mar 2016 May 2016 Jul 2016 Sep 2016 Nov 2016 Jan 2017 Mar 2017 May 2017 Jul 2017 Sep 2017 Price Index ResidentialDetachedTownhouseApartment Jan2005HPI=100
- 8. Listing & Sales Activity Summary Listings Sales 1 2 3 Col. 2 & 3 5 6 7 Col. 6 & 7 9 10 Col. 9 & 10 Sep Aug Sep Percentage Sep Aug Sep Percentage Jul 2016 - Jul 2017 - Percentage 2016 2017 2017 Variance 2016 2017 2017 Variance Sep 2016 Sep 2017 Variance BURNABY % % % DETACHED 183 168 254 51.2 58 65 62 -4.6 179 184 2.8 ATTACHED 89 98 109 11.2 32 68 66 -2.9 155 190 22.6 APARTMENTS 225 255 262 2.7 165 229 191 -16.6 582 602 3.4 COQUITLAM DETACHED 188 175 224 28.0 63 82 75 -8.5 225 249 10.7 ATTACHED 52 52 53 1.9 23 39 43 10.3 113 122 8.0 APARTMENTS 126 151 160 6.0 79 126 109 -13.5 316 372 17.7 DELTA DETACHED 78 67 107 59.7 21 53 38 -28.3 97 147 51.5 ATTACHED 18 7 19 171.4 19 8 5 -37.5 36 28 -22.2 APARTMENTS 22 17 19 11.8 9 18 13 -27.8 38 47 23.7 MAPLE RIDGE/PITT MEADOWS DETACHED 219 190 187 -1.6 92 139 136 -2.2 353 411 16.4 ATTACHED 68 70 63 -10.0 45 54 55 1.9 184 167 -9.2 APARTMENTS 54 42 52 23.8 44 46 32 -30.4 160 126 -21.3 NORTH VANCOUVER DETACHED 215 118 230 94.9 53 75 74 -1.3 214 230 7.5 ATTACHED 59 35 62 77.1 31 31 29 -6.5 78 100 28.2 APARTMENTS 165 108 175 62.0 97 111 107 -3.6 287 297 3.5 NEW WESTMINSTER DETACHED 35 38 53 39.5 17 19 22 15.8 66 61 -7.6 ATTACHED 11 25 18 -28.0 6 16 16 0.0 24 48 100.0 APARTMENTS 127 140 167 19.3 91 134 117 -12.7 297 364 22.6 PORT MOODY/BELCARRA DETACHED 40 26 43 65.4 8 13 17 30.8 47 48 2.1 ATTACHED 22 20 26 30.0 20 21 12 -42.9 50 54 8.0 APARTMENTS 47 33 51 54.5 31 33 24 -27.3 98 93 -5.1 PORT COQUITLAM DETACHED 74 70 45 -35.7 27 48 41 -14.6 91 133 46.2 ATTACHED 41 37 34 -8.1 18 21 27 28.6 63 76 20.6 APARTMENTS 74 73 78 6.8 53 44 55 25.0 171 145 -15.2 RICHMOND DETACHED 244 240 265 10.4 79 89 89 0.0 263 280 6.5 ATTACHED 103 168 149 -11.3 60 123 90 -26.8 229 316 38.0 APARTMENTS 198 262 294 12.2 130 242 200 -17.4 532 641 20.5 SUNSHINE COAST DETACHED 90 78 82 5.1 56 63 61 -3.2 203 189 -6.9 ATTACHED 8 26 7 -73.1 10 15 9 -40.0 33 31 -6.1 APARTMENTS 14 7 9 28.6 10 14 6 -57.1 26 32 23.1 SQUAMISH DETACHED 46 35 38 8.6 19 32 12 -62.5 65 67 3.1 ATTACHED 36 21 32 52.4 10 15 29 93.3 40 72 80.0 APARTMENTS 25 11 17 54.5 13 18 17 -5.6 34 51 50.0 VANCOUVER EAST DETACHED 296 210 278 32.4 62 114 95 -16.7 257 320 24.5 ATTACHED 68 50 81 62.0 26 31 41 32.3 91 117 28.6 APARTMENTS 187 152 204 34.2 112 142 129 -9.2 358 421 17.6 VANCOUVER WEST DETACHED 250 196 327 66.8 60 52 73 40.4 229 199 -13.1 ATTACHED 86 73 103 41.1 37 56 64 14.3 145 170 17.2 APARTMENTS 609 481 619 28.7 329 406 403 -0.7 1106 1207 9.1 WHISTLER/PEMBERTON DETACHED 19 20 25 25.0 24 19 12 -36.8 52 47 -9.6 ATTACHED 22 30 32 6.7 30 31 27 -12.9 94 89 -5.3 APARTMENTS 46 31 30 -3.2 40 31 31 0.0 108 88 -18.5 WEST VANCOUVER/HOWE SOUND DETACHED 170 106 221 108.5 22 30 35 16.7 97 106 9.3 ATTACHED 5 3 18 500.0 2 0 4 400.0 12 9 -25.0 APARTMENTS 31 19 42 121.1 15 19 17 -10.5 50 46 -8.0 GRAND TOTALS DETACHED 2147 1737 2379 37.0 661 893 842 -5.7 2438 2671 9.6 ATTACHED 688 715 806 12.7 369 529 517 -2.3 1347 1589 18.0 APARTMENTS 1950 1782 2179 22.3 1218 1613 1451 -10.0 4163 4532 8.9