More Related Content
Similar to Journal of agrarian change (20)
More from haramaya university (20)
Journal of agrarian change
- 1. Journal of Agrarian Change, Vol. 7 No. 2, April 2007, pp. 225–263.
© 2007 The Author.
Journal compilation © 2007 Blackwell Publishing Ltd, Henry Bernstein and Terence J. Byres.J127BE©OoO4lt rxahTu7iAfgciohr1oCiknrne-pdwa0a iA,al3el Uou’5lAsl ft8K rP hCAtoiucogrbl.fre flaJeisroehiau iSnrneg Cac, lhtL ocatrdon.mgepilation © Blackwell Publishing Ltd, Henry Bernstein and Terence J. Byres.
Nicolas Petit
Ethiopia’s Coffee Sector: A Bitter or Better Future?
Coffee, Ethiopia’s largest export crop, is the backbone of the Ethiopian economy. The Ethiopian coffee sector is highly dependent on international
prices and affected by the structure and workings of the world coffee market In this context, this paper seeks to identify what can be done in
Ethiopia to improve the performance of the sector so as to yield benefits for the government and the estimated 15 million people dependent on
coffee in the country. The paper argues that despite a limited room for manoeuvre, Ethiopia has not yet fully exploited its position as the producer
of some of the best coffees in the world. A number of competitive advantages may still be seized if quality and consistency are guaranteed. In
order to maximize this potential, and on the basis of a critical analysis of government policies and donor interventions in the sector, a number of
recommendations are made.
Keywords
: coffee, Ethiopia, world market, coffee policies
INTRODUCTION
Concern about the development and poverty implications of dependence on primary, and especially agricultural, commodity exports was
dramatized in 2002 when coffee prices collapsed to their lowest point in real terms for 100 years (NRI 2006). Although the ‘coffee crisis’ is hardly
visible from cafes like Starbucks in developed countries where the coffee business is booming, this dramatic decline in prices caused immense
hardship in countries where coffee is a key source of export earnings and of farmers’ incomes (Osorio 2002).
The world coffee market has changed dramatically in the last two decades. Changes in the international policy environment, new arrangements in
supply and demand, technological changes and/or the asymmetrical character of power in the ‘coffee value chain’, have increasingly narrowed the
opportunities for vulnerable economies to secure the benefits from coffee trade needed for economic development and poverty reduction. This
paper seeks to address some Nicolas Petit, 75, Avenue de l’université, 1050 Bruxelles, Belgique. e-mail: npetit13@hotmail.com This article is based on a dissertation
submitted at the School of Oriental and African Studies, Department of Development Studies, in September 2006. I am grateful to Sergio Giorgi for his support and Surendra Kotecha
for his encouragement, insight and constructive criticism during work on the dissertation. Henry Bernstein gave detailed comments on various drafts of this paper, which
were extremely helpful in revising it. The usual caveats apply.
226
Nicolas Petit
© 2007 The Author.
Journal compilation © 2007 Blackwell Publishing Ltd, Henry Bernstein and Terence J. Byres. Journal of Agrarian Change, Vol. 7 No. 2, April 2007, pp. 225–263. of the issues by
considering Ethiopia, the largest coffee producer and exporter in Africa. The rationale of selecting Ethiopia is threefold. With a share of less than
3 per cent of the global market for coffee, the country relies on the crop for a high proportion of its export earnings. Indeed, coffee is the backbone
of the Ethiopian economy, contributing 41 per cent of total foreign exchange earnings in 2005 (IMF 2006). Furthermore, the crop plays a central
role in sustaining the livelihoods of more than one million coffee growing households and an estimated 15 million people in total (LMC 2000).
Secondly, the country presents a number of distinctive features and plays an important role in the world coffee market because of its unique and
world-renowned coffees. Thirdly, in-depth literature on Ethiopia’s coffee sector is very scarce, if not non-existent, except for a few consultancy
reports for donor-funded projects.
The objective of this paper is to identify what can be done to improve theperformance/competitiveness of Ethiopia’s coffee sector so as to offer a
better future (if any) for the national economy and those who depend on coffee for their livelihoods. I suggest that despite an adverse international
setting (and the rhetoric of diversification out of coffee), interventions in the coffee sector remain of critical importance, and opportunities still exist
at a national level to improve its performance. To exploit this potential effectively, a number of policy recommendations are made.
- 2. The first part of the article identifies key international constraints presented by the structure and workings of the world coffee market. The second
part provides an overview of coffee production, processing and marketing in Ethiopia, and notes some of their distinctive features. The third then
considers the impact of the coffee crisis and domestic coffee market reforms in Ethiopia.
The last part focuses on Ethiopia’s prospects in an apparently bitter future
: what is being done and what could be done? After identifying constraints and opportunities at the national level, I present a critical analysis of
current government policies and donor interventions. Finally, some policy recommendations are proposed.
THE WORLD COFFEE MARKET
Coffee is produced in more than 50 developing countries providing income for approximately 25 million smallholder producers (DFID 2004; Oxfam
2002b), and employing an estimated 100 million people (NRI 2006). World coffee production in 2006/2007 is forecast at 123.6 million bags and
world coffee export is forecast at 92.8 million bags (USDA 2006). In 2005/2006, 52 per cent of world production was accounted by the three main
coffee producers (Brazil, Colombia and Vietnam), Brazil currently supplying about a third of total production (ICO statistical database). The top five
consumers are (in order) the USA, Brazil, Germany, Japan and France, while the Nordic countries have the world’s highest
1
According to Oxfam (2002b, 7) ‘Seventy per cent of the world’s coffee is grown on farms of less than 10 hectares, and of this, the vast majority is grown on family plots of between one
and five hectares’.
Ethiopia’s Coffee Sector
227
© 2007 The Author.
Journal compilation © 2007 Blackwell Publishing Ltd, Henry Bernstein and Terence J. Byres. Journal of Agrarian Change, Vol. 7 No. 2, April 2007, pp. 225–263. coffee
consumption per capita. World consumption in 2006 is estimated at around 117 million bags (ICO 2006). About 65 per cent of the world supply of
coffee is Arabica, while Robusta currently makes up around 35 per cent, compared to 25 per cent 20 years ago (Scholer 2004).
The ‘Commodity Problem’
The ‘commodity problem’ can be seen as a particularly harsh combination of both short-term price instability and declining terms of trade in the
long run, exposing producers of primary commodities and governments to the dual problem of low returns and high risks. The impact of such
trends in the short and long term is particularly acute for commodity dependent developing countries (DFID 2004). Prices of many agricultural
commodities show a high degree of volatility and the behaviour of commodity price cycles can be characterized by periods of low prices endured
for a longer time than price rises (DFID 2004). In addition to price volatility in the short-term, secular trends also operate to constrain the economic
growth potential of commodity exporting countries. According to Maizels (1987), since the end of the Second World War, there has been a
significant downward trend in the prices of primary commodities in relation to those of manufactured goods. Theoretical reasons for deteriorating
terms of trade in the long run were originally advanced in 1950 by Prebisch and Singer and then repeatedly tested and found valid (DFID 2004).
3
As a result, structuralists questioned the wisdom of concentrating efforts on the production of primary commodities for export, and import-
substitution strategies became a major component of development strategies until the rise of neo-liberalism in the early 1980s.
4
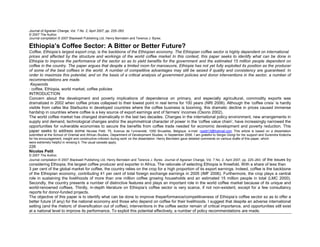
The ‘Coffee Crisis’ Concerns about economic development prospects and the poverty implications of dependence on primary commodities for
export came to the centre stage, once again, during the recent so-called ‘coffee crisis’. In 2002, Néstor Osorio, ICO’s executive director, observed
that coffee prices on world markets that year reached their lowest point in real terms for a century. The fall in prices since 1997 has been dramatic
(Figure 1), with prices in some cases insufficient to cover production costs (Osorio 2002).
2
According to Baffes (2003), coffee prices are among the most volatile of commodity prices.
3
Theoretical reasons include low price and income elasticities of demand for commodities as compared with manufactures; technological superiorities of developed countries; and
asymmetrical impact of labour union power in developed countries and labour surplus in developing countries on the division of benefits of increased productivity (Maizels 1987). In a
- 3. special issue of World Development on commodities, Maizels wrote the following 20 years ago: ‘The severe difficulties caused to the economies of the majority of developing countries
by the virtual collapse of a wide range of primary commodities in 1980–82, and their continuous depressed level since, has brought the “commodity problem”
once again to the urgent attention of the international community’ (1987, 537, emphasis added).
228
Nicolas Petit
© 2007 The Author.
Journal compilation © 2007 Blackwell Publishing Ltd, Henry Bernstein and Terence J. Byres. Journal of Agrarian Change, Vol. 7 No. 2, April 2007, pp. 225–263. In 2002, Oxfam
noted that some farming households dependent on coffee were pulling their children out of school; they could no longer afford basic medicines
and were cutting back on food consumption. Some coffee traders were going out of business while many seasonal workers – among the poorest
and most vulnerable participants in the coffee chain – lost their jobs. Moreover, government funds in producer countries were being squeezed,
putting pressure on health and education provision and forcing governments further into debt (Oxfam 2002b). Since January 2005, prices have
recovered in comparison with the crisis years of 2000–2004, reflecting a greater balance between supply and demand. Nonetheless, while
conditions for producers, other actors in coffee export and governments of producer countries improve in the short-term, price recovery is likely to
be only temporary given the inherently cyclical nature of current coffee markets (Lewin et al. 2004). While the oversupply of coffee was clearly one
of the main factors behind this dramatic fall in prices, and although the coffee industry has long experienced boom and bust price cycles, this crisis
is unique in that it reflects key structural changes in the global coffee commodity chain in the last 20 years, which I summarize next.
The Global Coffee Commodity Chain: Key Shifts Significant structural changes in the global commodity chain are likely to dictate the foreseeable
future. For Lewin et al. (2004), these changes could be as important as the cyclical shifts in supply and demand of the past.
Figure 1 World coffee prices 1997–2006 Source: Calculated from ICO website (http://www.ico.org; Accessed in July 2006).
Ethiopia’s Coffee Sector
229
© 2007 The Author.
Journal compilation © 2007 Blackwell Publishing Ltd, Henry Bernstein and Terence J. Byres.
Journal of Agrarian Change, Vol. 7 No. 2, April 2007, pp. 225–263.
The first to note is that with the rise of neo-liberalism from the early 1980s, international trade in coffee has been radically transformed from a
managed market, in which governments played an active role, to a free market. In short, the regulation exercised through International Coffee
Agreements (ICA) did not escape the Washington Consensus gospel of ‘getting the prices right’ and the now (in)famous dichotomy between the
state (inefficient) and the market (efficient). International trade in coffee was regulated through an export quota system which existed under
various ICAs between 1962 and 1989 implemented by the International Coffee Organization (ICO). Ponte suggests that ‘although there were
problems with this system, most analysts agree that it was successful in raising And stabilizing coffee prices’ (2002, 253; emphasis in the original).
However, disagreement between members (in particular opposition from the USA) led to the effective breakdown of the Agreement in 1989.
Producer country coffee agencies subsequently lost almost all influence on the international trade market and prices dropped dramatically
(Daviron and Ponte 2005). This market liberalization, and its price effects, had a major impact on many smallholder producers, as noted (see also
NRI 2006). Second is domestic market liberalization. Many producer countries undertook market reforms during the 1990s as part of the structural
adjustment programmes promoted (or imposed) by the International Monetary Fund and World Bank (International Financial Institutions or IFIs).
5
The outcome of these reforms continues to be debated, but some common trends noted in the literatureinclude: a higher proportion of the export
price paid to farmers; increasing price volatility following the abolition of price stabilization mechanisms; much more constrained access to credit
for farmers and traders; more involvement of the private sector and a loss of market share for cooperatives and former parastatals.
Finally, coffee market reforms have also often led to deteriorating coffee quality (Ponte 2002). Nonetheless, Ponte suggests that ‘market
liberalization may be the best option for some countries, and that highly regulated markets may be the best for others, even within the framework
of the same commodity’ (2002, 270).
- 4. Third, in addition to the changing policy environment, coffee has witnessed structural changes in global supply and demand. One major area of
change is the dramatic expansion of Robusta production in Vietnam during the 1990s and Arabica production in Brazil where innovative low-cost
production systems have been developed.
6
The increase in both the quantity and quality of Brazilian and Vietnamese coffees has resulted in a strengthening of their domination of different
market segments, which in turn is increasingly marginalizing other
5
According to the World Bank and its hegemonic position within development discourse, inefficient parastatal organizations, rent seeking behaviour and ‘heavy taxation’ of export
agriculture necessitated market ‘reform’ (Baffes et al. 2003).
6
Production in Vietnam increased from 2 million to 10 million bags during the 1990s, encouraged by low labour costs and government policies. Innovations in Brazil include migration of
production northwards to less frost-prone areas, increased density of productive hybrid varieties, irrigation and improved mechanical harvesting combined with proactive industry
organizations (Technoserve 2003).
230
Nicolas Petit
© 2007 The Author.
Journal compilation © 2007 Blackwell Publishing Ltd, Henry Bernstein and Terence J. Byres.
Journal of Agrarian Change, Vol. 7 No. 2, April 2007, pp. 225–263. producers (NRI 2006; Lewin et al. 2004). Changes are also taking place in the nature of
demand with the unprecedented growth of branded ‘niche’ products, such as specialty/gourmet, organic, fair trade, eco-friendly (such as shade-
grown and bird-friendly), decaffeinated, flavoured coffees and so on. In many cases, coffee buyers’ requirements are focusing on higher quality
and consistency (same quality for repeat delivery); traceability of origin as well as economic, social and environmental ‘transparency’; and capacity
for direct long-term partnerships between producer and roaster (NRI 2006).
Technological changes in roasting and grinding also have important implications, allowing for more flexibility in blending and greater use of
Robusta coffees. Roasters adapted to changes with new roasting technologies such as steaming, and found new ways of reducing the acidity of
Robusta coffees. In addition, Scholer (2004) argues that flavoured coffees can use cheaper (lower-grade) beans as well as coffee drinks such as
cappuccino or café latte in which coffee is only one of the several ingredients. In his view, ‘market trends and new technologies are in many
instances working against producers’ interests’ (2004, 10) with some new technologies clearly driving down quality.
Fourth, other analyses of the world coffee market have focused on the shift of power in the global commodity chain, whereby value
disproportionately accrues to actors downstream such as traders, roasters and retailers at the expense of coffee producers (NRI 2006). In
particular, so-called ‘global value chain’(GVC) analyses of coffee have blossomed in recent years, with an emphasis on
chain governance structure and the distribution of power along chains (Ponte 2002; Daviron and Ponte 2005).
7
The loss of market power of coffee producing countries, and the loss of market share by some of them, in the reconfigured global coffee value
chain is closely related to changes in the policy environment (market ‘reform’). The abolition of marketing boards has further reduced the capacity
of farmers to raise their share of value-chain rents (Fitter and Kaplinsky 2001). According to Ponte (2002), the post-ICA regime can be labelled as
a ‘roaster-driven’ chain, where producing countries’ governments have lost most of their bargaining power and the roaster and trading segments of
the chain are increasingly concentrated.
According to Scholer (2004), five international coffee trading houses have captured an increasing share of the coffee trade, covering about 40 per
cent of the total volume of green coffee imports worldwide. In a similar fashion, ten roasters account for 60–65 per cent of all sales of processed
coffee, most of which is sold under brand names.
8
There has also been a dramatic increase of retail coffee shop groups such as Starbucks in recent years.
- 5. The unequal distribution of total incomes, reflecting this asymmetrical character of power in the coffee value chain, is clear. At the end of the
1980s and part of the 1990s, coffee producing countries received around US$10–12 billion See for example Talbot (1997), Fitter and Kaplinsky (2001) and
Ponte (2002). For a detailed critical discussion of GVC analysis see Bernstein and Campling (2006a, 2006b).
The largest multinational roasting companies include Nestle, Kraft, Sara Lee and Procter & Gamble.
Ethiopia’s Coffee Sector
231
© 2007 The Author.
Journal compilation © 2007 Blackwell Publishing Ltd, Henry Bernstein and Terence J. Byres.
Journal of Agrarian Change, Vol. 7 No. 2, April 2007, pp. 225–263. per year for their export. In 2003, however, they received US$5.5 billion, less than half as
much. Meanwhile, the coffee industry in consuming countries has been moving in the opposite direction, with a continued growth in the annual
value of retail sales from around US$30 billion in the 1980s to around US$80 billion at present (Osorio 2004; UNDP 2005).
In a recent study, Daviron and Ponte (2005) seek to explain what they call the ‘coffee paradox’: a ‘coffee boom’ in consuming countries and a
‘coffee crisis’ in producing countries.
For them, market power is not simply about controlling market share, but also about the ability to define the ‘identity’ of a coffee or ‘the ability to set
the language and the reference values that determine production norms and quality standards’ (2005, xvii). Using a theoretical framework
combining ‘historical political economy’, GVC analysis and Convention Theory (CT), they argue that the ‘coffee paradox’ reflects the growing
difference between coffee sold on international markets as a ‘commodity’ (that is, defined by its physical characteristics) and coffee sold as a final
product to consumers.
Farmers and producing countries sell coffee for its ‘material quality’ attributes, while consuming country operators downstream create and
appropriate value by selling the ‘symbolic’ and ‘in-person service’ attributes of coffee. Therefore, while producers can improve value added to a
certain degree by improving the ‘material’ quality of coffee, they have much less control over other (‘symbolic’ and ‘in-service’) attributes
dominated by actors downstream and where most value is added in the chain (NRI 2006).
COFFEE IN ETHIOPIA
Ethiopia is one of the poorest countries in the world.
10
About 45 per cent of its
population live below the poverty line of US$1 per day. Social indicators such as infant mortality rate, illiteracy rates or school enrolment rates are
considered some of the worst in the world (FAO 2006). The causes of poverty include low levels of agricultural technology and rural infrastructure.
Recurrent droughts and the degradation of the natural resource base, combined with a highly unstable recent political history, also contribute to
the persistence of poverty. In the past three years, Ethiopia’s economy has shown a mixed performance with a negative real GDP growth rate of
3.8 per cent in 2002/2003 as a result of drought, followed by unprecedented growth of 11.3 per cent in 2003/2004 and 8.9 per cent in 2004/
2005. In general, the variability of growth is mostly a result of the variability in the performance of the agricultural sector (FAO 2006). Agriculture
represents about 42 per cent of GDP, with industry and services respectively 11 per cent and 47 per cent. Agriculture is estimated to employ 85
per cent of the economically
A ‘paradox within this paradox is that the international coffee market is awash in coffee of “low quality” while there is a dire shortage of “high quality” coffee – and it is the latter that is
generating sales growth’ (Daviron and Ponte 2005, xvi).
In 2005, Ethiopia ranked 170th out of 177 countries in the Human Development Index (UNDP 2005). With an estimated 75 million people in 2006, Ethiopia is the second most
populous country in Sub-Saharan Africa after Nigeria (FAO 2006).
Nicolas Petit
Journal compilation © 2007 Blackwell Publishing Ltd, Henry Bernstein and Terence J. Byres. Journal of Agrarian Change, Vol. 7 No. 2, April 2007, pp. 225–263.
- 6. active population, and continues to be the major source of export earnings and raw materials for industry (OECD 2006).
Importance of Coffee in the Ethiopian Economy Ethiopia is probably the oldest exporter of coffee in the world (ITC 2002). In 2005 it was the sixth
largest coffee producer after Brazil, Colombia, Vietnam, Indonesia and India, and the seventh largest exporter worldwide. It is the largest coffee
producer and exporter in Africa. Exports in 2005 were 2.43 million bags, a share of 2.82 per cent of world trade in coffee beans (ICO statistical
database).
The bulk of current Ethiopian exports go to Japan, Germany and Saudi Arabia. There is a high degree of dependence on these three markets,
which absorbed 63.3 per cent of Ethiopia’s coffee exports in 2003/2004 (FDRE 2006). Moreover, exports to Japan, Germany and Saudi Arabia
have risen in the last 20 years, while exports to the USA have declined (FDRE 2006).
The vast majority of coffee is exported in green bean form for roasting in consuming countries. Although the total share of its coffee exports in
world trade is small, Ethiopia plays an important role in the ‘global value chain’ because of the fine quality of its coffees (Daviron and Ponte 2005).
Historically coffee accounted for over 60 per cent of Ethiopia’s total export revenues (LMC 2000). While this proportion has dipped significantly in
recent years with a revival in the prices of major Ethiopian exports in the international market (Figure 2), total coffee export earnings registered
substantial growth in 2003/4 and 2004/5 due to increased export volumes (Table 1). Coffee has also long been an important source of tax revenue
to the government (Love 2002).
Agrisystems (2001) estimates the number of coffee farmers at 1.3 million. With an assumed family size of six to seven people, the numbers of
Ethiopians associated with coffee growing can be as large as 7–8 million. Moreover, coffee is labour intensive during harvesting and processing,
and provides an important
source of income from casual labour for many poor rural people. Adding
those employed in transporting coffee and ancillary activities, LMC (2000, 2003)
estimates that 15 million people are dependent on coffee for at least a significant
part of their livelihoods.
Outline of Production
Two coffee species are currently used for commercial purposes:
Coffea arabica
and
Coffea canephora
(also known as Robusta). Ethiopia only produces Arabica
coffee, which is widely believed to have originated there. Arabica coffee still
grows wild in the forests of the south-western part of the country, which
remains an important source of genetic resources for the world coffee industry
(Gole 2003). Coffee farming systems in Ethiopia are conventionally divided into
11
The demand from Germany is mainly for washed coffee, while Japan and Saudi Arabia prefer
sun-dried coffee.
Ethiopia’s Coffee Sector
233
© 2007 The Author.
Journal compilation © 2007 Blackwell Publishing Ltd, Henry Bernstein and Terence J. Byres.
Journal of Agrarian Change, Vol. 7 No. 2, April 2007, pp. 225–263.
four categories: forest coffee, semi-forest coffee, garden coffee and semi-modern
plantation. Yields are considered to be very low compared to other countries,
- 7. with estimates of less than 200 kg per ha for forest coffee and around 450–750 kg
per ha for semi-modern coffee plantations (FDRE 2003a). Most coffee farmers
do not use fertilizers, pesticides or herbicides (LMC 2000).
An accurate estimate of production is difficult because part of the harvest is
gathered from semi-wild and wild forests, and a good proportion of the crop is
consumed on-farm or locally (Agrisystems, 2001). Most recent ICO estimates
suggest that over the past five years annual production has fluctuated between
2.8 and 5 million (60 kg) bags (ICO statistical database), while the United States
Department of Agriculture forecasts a harvest of 5.5 million bags in 2006/7
(USDA 2006).
Each
woreda
(district) is classified as a major, medium and minor coffee
grower based on the area covered by coffee trees (FDRE 2003a; see map). Coffee
production is concentrated mainly in the Oromiya and the Southern Nations,
Nationalities and People’s Region (SNNPR). Major and medium growing
woredas
contain an estimated 800,000 coffee farmers with approximately 520,000
ha under coffee, of which 63.3 per cent is in Oromiya, 35.9 per cent in SNPP
and 0.8 per cent in Gambela. Smallholder producers are responsible for about 95
per cent of production, while state-owned plantations account for 4.4 per cent
and private investor plantations 0.6 per cent (FDRE 2003a). Finally, coffee from
Figure 2 Trends in commodity shares of export values in Ethiopia (1999–2005)
Note: Other includes textiles, essence oils, spices, fruit and vegetables, live animals,
canned and frozen meat, sugar and molasses.
Source: calculated from IMF (2006).
234
Nicolas Petit
© 2007 The Author.
Journal compilation © 2007 Blackwell Publishing Ltd, Henry Bernstein and Terence J. Byres.
Journal of Agrarian Change, Vol. 7 No. 2, April 2007, pp. 225–263.
Table 1
. Ethiopia: value of exports US$ million, 1999–2005
1999/2000 2000/2001 2001/2002 2002/2003 2003/2004 2004/2005
Total exports 485.9 462.7 452.4 482.7 600.4 817.7
Coffee 262 182 163.2 165.2 223.6 335.4
Coffee as percentage of total 53.5 39.3 36.1 34.2 37.2 41.0
Source
: IMF (2006, 55).
Ethiopia’s Coffee Sector
235
© 2007 The Author.
- 8. Journal compilation © 2007 Blackwell Publishing Ltd, Henry Bernstein and Terence J. Byres.
Journal of Agrarian Change, Vol. 7 No. 2, April 2007, pp. 225–263.
each significant Ethiopian producing region has a particular taste characteristic
and a number of these coffee types are internationally well known. According
to the International Trade Centre, ‘Ethiopia produces some of the world’s finest
“original” coffees such as Yirgacheffe, Limu and Harar’ (ITC 2002, 299).
After harvesting, coffee cherries are processed by two widely applied methods,
namely dry and wet processing. For unwashed Arabica (or sun-dried coffee), the
cherries are dried on mats, concrete, or cement floors immediately after they
have been picked. After drying to a moisture content of about 11.5 per cent, the
outer layer of the cherries are removed by hulling and the green bean obtained
is ready for marketing. For washed coffee (wet processed coffee), once the cherries
are harvested they are pulped, fermented in tanks and then finally washed in
clean water. The wet parchment coffee obtained is then dried in the sun on raised
tables and sorted at 11.5 per cent moisture content (IFPRI 2003).
Currently there are more than 1000 coffee cherry processing plants in the
country, with approximately 492 hulleries and 601 washing stations. The coffee
washing stations are owned by private individuals, farmers’ cooperatives or state
enterprises, and have an estimated total processing of around 80,000 tons of
washed coffee per annum (FDRE 2003a). Historically, over 90 per cent of Ethiopian
coffee was sun-dried. However, since washed coffee sells at significant premiums
over sun-dried coffee, the government has encouraged cooperatives and
traders to invest in machinery to raise the output of washed coffee (LMC 2003).
12
In 1980/1, washed coffee was only 9.1 per cent of total coffee exports; by 2004/
5, it amounted to 32.7 per cent (FDRE 2006).
Glimpses of Differentiation
Literature on coffee in Ethiopia – whether from government sources or within
the coffee industry, or in reports from NGOs like Oxfam or donor agencies like
UNDP – typically gives the impression that Ethiopian coffee ‘smallholders’ are
a homogeneous group of farmers (who are thus similarly affected by the ‘coffee
crisis’). While there are no systematic studies or data of rural differentiation,
some useful glimpses are available from an unlikely source, namely an unusually
precise ‘livelihood’ analysis in SNNPR conducted for the United States Agency
for International Development (USAID 2005). Figure 3 and Table 2 summarize
the results for three ‘livelihood zones’ dependent on coffee. The Gedeo zone
includes parts of Wenago, Yirgacheffe and Kochere
woredas
. This is a food secure
area that produces some of the highest quality coffee in Ethiopia, and is relatively
wealthy, with some poor households earning more cash than better-off households
- 9. in some other parts of SNNPR. The Sidama zone covers parts of Dara,
Aleta Wendo, Dale, Shebedino, Awassa, Hulla, Bensa and Aroresa
woredas
.
12
The government is also considering the introduction of hand-operated coffee pulpers at farm
level to produce semi-washed coffee (‘pulped natural’ coffee), which has a lower level of defects and
improved liquor compared to sun-dried coffee (LMC 2003).
236
Nicolas Petit
© 2007 The Author.
Journal compilation © 2007 Blackwell Publishing Ltd, Henry Bernstein and Terence J. Byres.
Journal of Agrarian Change, Vol. 7 No. 2, April 2007, pp. 225–263.
Figure 3 Sources of income for three different livelihood zones in SNNPR (adapted from
USAID 2005)
Ethiopia’s Coffee Sector
237
© 2007 The Author.
Journal compilation © 2007 Blackwell Publishing Ltd, Henry Bernstein and Terence J. Byres.
Journal of Agrarian Change, Vol. 7 No. 2, April 2007, pp. 225–263.
Table 2
. Household differentiation in three livelihood zones (adapted from USAID 2005)
SIDAMA COFFEE LIVELIHOOD ZONE
GEDEO COFFEE LIVELIHOOD ZONE
% of the
population
Household
size
Land area
cultivated (ha)
Perennial crops Livestock Annual income
(ETB)
Poor 30 6–8 0.375–0.5 200–700 coffee bushes;
50–200 enset stems
0–2 cows; 0–3 sheep;
1–7 hens
2500–3000
Middle 52.5 7–9 0.75–1.5 900–2300 coffee bushes;
200–600 enset stems
1–3 cows; 2–4 sheep;
4–6 hens
5000–7000
Better-off 17.5 9–11 1.5–2.5 1800–3600 coffee bushes;
500–1500 enset stems
2–6 cows; 3–6 sheep;
- 10. 0–4 goats; 4–8 hens
8000–10,000
% of the
population
Household
size
Land area
owned (ha)
Cultivated
with coffee
Livestock Annual income
(ETB)
Very poor 15 5–7 <0.25 Small area mixed crops 0 cattle; 0 shoats; 0 donkey 1000–1600
Poor 25 5–7 0.25–0.5 0.125–0.25 0–2 cattle; 0–1 shoat; 0–1 donkey 1300–2000
Middle 40 6–8 0.75–1.25 0.5–0.75 2–4 cattle; 0–3 shoats; 0–1 donkey 1500–2500
Better-off 20 8–10 1.5–>2 1 4–8 cattle; 0–4 shoats; 1 donkey 3000–4500
238
Nicolas Petit
© 2007 The Author.
Journal compilation © 2007 Blackwell Publishing Ltd, Henry Bernstein and Terence J. Byres.
Journal of Agrarian Change, Vol. 7 No. 2, April 2007, pp. 225–263.
WOLAYITA GINGER AND COFFEE LIVELIHOOD ZONE
% of the
population
Household
size
Land area
cultivated (ha)
Perennial crops Livestock Annual income
(ETB)
Very poor 17.5 4–6 0.13–0.25 0 mature enset; 10–15 coffee bushes None owned.
Yerbee
:
0–1 milking cow
750–850
Poor 35 5–7 0.25–0.38 0–8 mature enset; 15–35
coffee bushes
None owned.
Yerbee
: 0–2 cattle;
0–2 small stock
1000–1300
Middle 30 6–8 0.38–0.75 10–15 enset; 25–65 eucalyptus trees;
40–60 coffee bushes
0.5–1 plow oxen; 2–6 cattle;
- 11. 4–6 small stock
1600–2000
Better-off 17.5 7–10 0.75–1.5 10–30 enset; 60–120 eucalyptus trees;
60–120 coffee bushes
1–2 plow oxen; 10–15 cattle;
5–7 small stock
3000–4000
Notes
: Households without livestock gain access to livestock products through a loan arrangement known locally as
Yerbee
.
Table 2. Continued.
Ethiopia’s Coffee Sector
239
© 2007 The Author.
Journal compilation © 2007 Blackwell Publishing Ltd, Henry Bernstein and Terence J. Byres.
Journal of Agrarian Change, Vol. 7 No. 2, April 2007, pp. 225–263.
Coffee is the main cash crop and
enset
the main food crop.
13
The Wolayita zone
data presented here cover just one
woreda
, namely Boloso Sore, characterized by
chronic poverty and food insecurity and where coffee and ginger are the main
cash crops.
These illustrations clearly show that ‘coffee farmers’ should be seen as differentiated
in various ways. For example, relative wealth is determined primarily
by the area of land owned/cultivated and the number of livestock that households
own. In the Wolayita coffee and ginger zone, better-off households
cultivate on average six times the area cultivated by very poor households and
only the middle and better-off households own livestock. Accordingly, better-off
households have an average annual income four times that of very poor households
(3000–4000 ETB and 750–850 ETB, respectively). Moreover, there are
also critical differences in income sources. While the major source of income
for middle and better-off groups are crop sales and livestock sales, Figure 3
illustrates the central importance of casual labour for very poor and poor households.
Casual employment represents around 65 per cent of income for the very
13
Enset
or ‘false banana’ is unique to Ethiopia and one of the most characteristic products of
SNNPR. The starchy base of the plant is fermented and eaten in various forms as bread, pancakes
or porridge.
- 12. 240
Nicolas Petit
© 2007 The Author.
Journal compilation © 2007 Blackwell Publishing Ltd, Henry Bernstein and Terence J. Byres.
Journal of Agrarian Change, Vol. 7 No. 2, April 2007, pp. 225–263.
poor in Sidama and 60 per cent of income for the very poor in Wolayita. Casual
labour usually includes agricultural work for better-off coffee farmers and daily
labour in the pulping stations during the coffee harvest season. Finally, the
response strategies to hazards also vary depending on wealth groups. The main
hazards affecting these zones are shortage of rain and drought, hail and frost,
coffee berry disease and coffee wilt disease, livestock diseases, fluctuating international
coffee prices or increased staple food prices. In bad years, livestock sales
expand for wealthier households, while very poor and poor households do more
local casual work and petty trade (with daily wages lower in bad years) or
migrate outside the livelihood zone in search of employment (USAID 2005). In
short, differentiation means that farmers are affected differently and deploy different
coping strategies in response to falling coffee incomes, whether occasioned by
declining international prices or other factors. Evidently this has implications for
the consideration of policies such as upgrading, typically conceived as applicable
to a notional ‘average’ small farmer household.
The Contemporary Domestic Marketing Chain: From Growers to Export
Figure 4 illustrates the present domestic coffee marketing chain from farm
gate to export. Market participants are numerous and include smallholder
coffee farmers or state farms, primary collectors (‘
sebsabies
’), suppliers (‘
akrabies
’),
processors, service cooperatives, unions, exporters and various government
institutions (see Table 3 for details). Many participants are required to have
specific licences for their respective functions; for example,
sebsabies
have to sell
to
akrabies
,
akrabies
deliver their coffee to the auction but are not permitted to
export it, and exporters are only permitted to buy coffee from the auction (LMC
2003). Normally, all Ethiopian coffee should pass through auction centres.
However, since 2001, cooperatives and to a lesser extent private investors have
- 13. been granted permission to by-pass coffee auctions, opening the way for direct
export sales (Dempsey 2006).
On arrival in the Addis Ababa or Dire Dawa auction centres, all beans are
taken to the auction compound where their provenance and quality is tested on
a sample basis by the Coffee and Tea Quality Control and Liquoring Unit
(CLU). Grading standards are set according to the number of defects and the
type of processing. The main export grades are grade 2 for washed coffee and
grade 4 and 5 for unwashed coffee (LMC 2003). For example, washed coffee
supplies are usually dominated by Sidamo 2, Limu 2 or Yirgacheffe 2, while the
most common unwashed coffees are Jima 5, Sidamo 4 or Harar 5. At the auctions,
there is an emphasis on keeping consignments from different regions separate in
order to maintain the distinctive flavour of the different regions (LMC 2003).
14
14
Moreover, compared to most other producing countries that have a grading and classification
system by bean size, Ethiopia follows a system of cup taste profile according to regional flavours
(Surendra Kotecha, personal communication).
Ethiopia’s Coffee Sector
241
© 2007 The Author.
Journal compilation © 2007 Blackwell Publishing Ltd, Henry Bernstein and Terence J. Byres.
Journal of Agrarian Change, Vol. 7 No. 2, April 2007, pp. 225–263.
Deliveries which do not meet export standards are rejected and redirected for
the domestic market. Ethiopia, along with Brazil, is one of the only producing
countries with a strong coffee-drinking culture. A large proportion of coffee
consumption in Ethiopia occurs on-farm, which makes levels of consumption
difficult to assess (LMC 2003). The ICO estimate for local consumption in 2005
was 1.83 million (60 kg) bags, i.e. more than 40 per cent of production (ICO
statistical database).
Figure 4 Ethiopian domestic coffee marketing chain in 2006
Source: adapted and updated from LMC (2000) and IFPRI (2003).
242
Nicolas Petit
© 2007 The Author.
Journal compilation © 2007 Blackwell Publishing Ltd, Henry Bernstein and Terence J. Byres.
Journal of Agrarian Change, Vol. 7 No. 2, April 2007, pp. 225–263.
Table 3. Key actors and institutions in the Ethiopian coffee sector
Key actors and institutions Main functions and responsibilities
Ministry of Agriculture and Rural Development
(MoARD) (Federal Level)
Established in January 2004 by proclamation No. 380/2004 (A Proclamation
to Amend the Reorganization of the Executive Organs of the Federal
Democratic Republic of Ethiopia, Federal Negarit Gazeta of the Federal
Democratic Republic of Ethiopia, 13 January 2004). Now responsible for the
- 14. full agricultural value chain (includes the formerly independent Federal
Cooperatives Commission and some functions previously managed by the
Ministry of Trade and Industry).
Coffee, Tea Spices and Cotton Marketing Department
(CTSCMD) & Coffee, Tea, Spices Development
Department (CTSDD)
These two departments of the MoARD took over the functions of the ex-
Coffee and Tea Authority (CTA) in March 2004. They supervise the sector
with responsibilities for coffee research, quality control, marketing, etc. They
handle policy matters and provide technical services such as extension, training,
processing and marketing to coffee growers and other market participants.
MoARD at regional, zonal and woreda levels Regions principally concerned are Oromiya and SNNP regions. Responsible
for implementing extension services and other on-farm aspects relating to
coffee.
Coffee and tea quality control and liquoring unit (CLU) This is a government agency with an essential role in maintaining the quality
of coffee in Ethiopia. Responsible for liquoring (classifying by taste and
appearance) washed and unwashed coffee as it arrives at the auction. Also gives
clearance to exporters prior to export.
Ethiopian Institute of Agricultural Research (EIAR)/
Jimma Research Centre (JRC)
The Ethiopian Agricultural Research Organization (EARO) was renamed the
Ethiopian Institute of Agricultural Research (EIAR) in October 2005.
Important role to play in Ethiopia’s coffee sector, primarily in selecting
disease-resistant varieties, establishing national coffee collection and protecting
the genetic resource base of the crop. It has several research stations in various
agro-ecological zones of the country like the Jimma Research Centre (JRC),
responsible for the national coffee research programme.
Ethiopia’s Coffee Sector 243
© 2007 The Author.
Journal compilation © 2007 Blackwell Publishing Ltd, Henry Bernstein and Terence J. Byres.
Journal of Agrarian Change, Vol. 7 No. 2, April 2007, pp. 225–263.
Ministry of Finance and Economic Development
(MoFED)
Oversees the planning of national strategic development initiatives. Focal
point for some coffee donor-funded projects.
National Bank of Ethiopia (NBE) Responsible for managing the country’s foreign exchange flows, including
those generated by coffee.
Coffee plantation and development enterprises Government institution responsible for the state coffee plantations with
approximately 8000 permanent employees and responsible for around 50,000
casual jobs annually.
Small-scale coffee producers Responsible for 95 per cent of coffee production, and estimated at 1.3 million.
Most are men, as coffee cultivation is considered the responsibility of the head
of household. A differentiated category of farmers with poor, middle or
better-off farmers depending on size of holding and sources of cash income.
Coffee labourers/workers Coffee generates a considerable number of jobs on-farm, in the processing
- 15. plants (washing stations, hulleries) or in the transport sector. In Ethiopia,
coffee constitutes a very important source of casual employment for many
poor people. Most agro-processing employees are women.
Primary coffee collectors (‘sebsabies’) Locally licensed coffee traders purchasing coffee from individual farmers.
Essential role to bring coffee from very remote areas to the market. They have
no warehouses of their own and therefore transfer the coffee to ‘akrabies’
immediately. There are currently 2291 legal collectors in Ethiopia.
Suppliers/Wholesalers (‘akrabies’) Suppliers acquire red coffee cherries from collectors or producers (before 1999,
they could not buy coffee directly from producers), they then have to process
their coffee before bringing it to auction. They are not allowed to export on
their own account. Some have storage facilities as well as their own hullers or
pulperies. Currently there are 1068 akrabies in the country.
Service Cooperatives (primary societies) Made up of different local peasant associations. Important role in organizing
farmers. Many cooperatives own washing stations and warehouses.
Key actors and institutions Main functions and responsibilities
Table 3. Continued.
244 Nicolas Petit
© 2007 The Author.
Journal compilation © 2007 Blackwell Publishing Ltd, Henry Bernstein and Terence J. Byres.
Journal of Agrarian Change, Vol. 7 No. 2, April 2007, pp. 225–263.
Cooperative unions Association of primary cooperatives societies, with an increasing role in the
last five years with support from government and funding from overseas
donors. Currently, there are four cooperatives unions (Oromia, Yirgacheffe,
Sidama and Kaffa Coffee Farmers Cooperative Unions). From 2001, they
obtained a concession to bypass the auction and export coffee directly to
overseas buyers. Their main functions are to assist in developing producer/
buyer linkages (by facilitating organic and fair trade certification for example),
to export members’ coffee directly, provide warehouse and transport services,
promote high-quality coffee production, and provide saving and credit
services as well as training and education programmes for members.
Oromia Coffee Farmers Cooperative union (OCFCU)
First union founded in June 1999. Includes 34 cooperatives representing 22,734
farmers producing around 16,000 t of coffee. Infrastructure includes 32
pulperies, 3 hulleries, warehouse capacity of 9550 tons.
Sidama Coffee Farmers Cooperative Union (SCFCU)
Founded in July 2001, comprises 39 primary cooperatives representing 82,275
farmers producing around 35,000 t of coffee (60 per cent washed). Owns 89
pulperies, one hullery and has a warehouse capacity of 5000 tons.
Yirgacheffe Coffee Farmers Cooperative Union (YCFCU)
Founded in July 2002 by 21 primary cooperative members representing 42,065
coffee farmers. 46 pulperies, 4 coffee hullers and warehouse space for 4600 t.
Kaffa Forest Coffee Farmers Cooperative Union (KFCFCU)
Founded in March 2004 by 26 primary cooperative members representing
6032 coffee farmers.
Ethiopian Coffee Exporters Association (ECEA) –
- 16. private organization
Important role as one of the main contacts with the world market. The
principal objective of ECEA is to promote coffee exports. It provides coffee
trade information, lobbies on policies, and supplies technical support to its
members, of whom there are currently 65.
Sources: FDRE (2003a), IFPRI (2003), Agrisystems Ltd (2001), and author’s interviews.
Key actors and institutions Main functions and responsibilities
Table 3. Continued.
Ethiopia’s Coffee Sector 245
© 2007 The Author.
Journal compilation © 2007 Blackwell Publishing Ltd, Henry Bernstein and Terence J. Byres.
Journal of Agrarian Change, Vol. 7 No. 2, April 2007, pp. 225–263.
Summary
The Ethiopian coffee sector is characterized by a number of distinctive features
of which the most important include the following.
Firstly, Ethiopian coffee is an important source of coffee genetic resources as
the country is the centre of origin and diversification of Arabica coffee. Wild
coffee still grows in different areas of Ethiopia and forest or semi-forest coffees
constitute an important part of the country’s production. Secondly, domestic
consumption represents more than 40 per cent of coffee production. There is a
long and strong tradition of coffee drinking, and the famous coffee ceremony is an
integral part of the Ethiopian culture. Thirdly, a variety of distinctively flavoured
beans produced in different regions (coffee types such as Harar, Limu or Yirgacheffe)
are recognized internationally and marketed in blend or as 100 per cent
Ethiopian products at high premiums. Fourthly, smallholders represent 95 per cent
of total production in a low input–low output system making Ethiopian coffee
production naturally ‘organic’. Finally, coffee should be considered as a very
‘political crop’ because of its tremendous importance in the Ethiopian economy.
What Ethiopia shares with other producer countries, of course, is that it is
highly dependent on international prices and affected by the structure and workings
of the world coffee market. According to the United Nations Development
Programme (UNDP), ‘what happens in international coffee markets has a
profound bearing on Ethiopia’s prospects for achieving the Millennium Development
Goals’ (2005, 140). I turn next to consider domestic coffee marketing
reform, and export performance in the context of changes in the global coffee
market outlined earlier.
THE COFFEE CRISIS, MARKET REFORM AND PERFORMANCE
According to the latest Human Development Report, Ethiopia is one of the
countries most affected by the crisis in world coffee prices. Exports earnings
have fallen dramatically and the price shocks absorbed by coffee producers in
Ethiopia have been enormous. Using household-level data, UNDP estimates
that the loss of income in 2003 amounted to about US$200 per household, while
- 17. for every $2 in aid received by Ethiopia in 2003, $1 was lost through lower
coffee prices (UNDP 2005). In its report on the impact of the coffee crisis on
farmers in Kafa province, Oxfam International reveals a similar picture.15 It
argues that farmers cannot cover their basic production costs and are operating
at a loss, while some primary cooperative societies have gone bankrupt and many
traders and exporters were forced to stop operating (Oxfam 2002a). However, as
15 This report was commissioned as a background paper for Oxfam ‘Make Trade Fair’ campaign
and the ‘Mugged: Poverty in your Coffee Cup’ report (Oxfam 2002b). As part of this global campaign,
Oxfam launched also the ‘Big Noise’ petition to put pressure on governments and coffee
companies to come up with a lasting solution to the coffee crisis. As of today, this petition has been
signed by more than 3 million Ethiopians, including the Prime Minister Meles Zenawi; see http://
www.maketradefair.com for more details.
246 Nicolas Petit
© 2007 The Author.
Journal compilation © 2007 Blackwell Publishing Ltd, Henry Bernstein and Terence J. Byres.
Journal of Agrarian Change, Vol. 7 No. 2, April 2007, pp. 225–263.
noted earlier, the differentiation of coffee farmers means that not all of them
suffered to the same extent from the crisis in prices.
The government estimates that Ethiopia lost about US$814 million in revenue
from coffee exports between 1998 and 2003. Moreover, in 2002, one of the main
government responses to the crisis was to cut the 6.5 per cent export tax on
coffee leading to a further decrease in government revenue (see further below),
and contributing to an increase in the debt burden (FDRE 2003b).
Domestic Coffee Market Reforms and Their Impact
The end of the Derg military regime and the arrival in government of the
Ethiopian People’s Revolutionary Democratic Front (EPRDF) in 1991 led to a
number of political and economic reforms, mostly in line with the neo-liberal
prescriptions of the IMF and World Bank. These reforms have had effects for all
sectors of the economy, including the coffee chain. Coffee market reforms began
in 1992 primarily as a means to increase prices received by farmers in order to
promote production and reduce the incidence of coffee smuggling to neighbouring
countries (LMC 2000). Some of the most significant changes in terms of marketing,
pricing, taxation, regulation and quality control are presented in Table 4.
From this table, several observations can be made. Firstly, the coffee market
reforms in Ethiopia have been a gradual process of change carried out in phases.
Secondly, the process of liberalization has been only partial. Although many
changes have loosened government involvement in the sector (such as the
removal of the former state monopoly and the increasing involvement of the
private sector, the ending of price controls or the abolition of the quota system),
strict government controls remain in several areas. In addition to maintaining the
auction, the level of vertical integration is limited through licensing rules and
only coffee deemed unsuitable for export can be sold for domestic consumption.
- 18. Moreover, Ethiopia does not allow multinational companies (MNCs) to register
as exporters. Daviron and Ponte suggest that ‘as a result of the absence of MNC
competition at the auction level, the industry is much more locally controlled
than elsewhere in Africa’ (2005, 108).
Regarding the impact of these reforms, the different studies available (LMC
2000, 2003; Alemayehu 1999; IFPRI 2003) show the following trends: (i) an
increased participation of the private sector at different levels of the marketing
chain; (ii) an increased proportion of the export price received by growers (albeit
with increased volatility), with the devaluation of the Ethiopian Birr from 1992
further increasing grower prices in local currency terms; and (iii) a positive
supply response and improved coffee export performance. According to our
own calculations in Figures 5 and 6, based on unpublished data of the Coffee,
Tea, Spices and Cotton Marketing Department of MoARD (FDRE 2006), there
was indeed an increase in coffee arrival at auctions as well as improved export
performance for both washed and unwashed coffees in the post-reform period.
Moreover, liberalization does not seem to have had a negative impact on
quality in Ethiopia as strict government quality controls have been maintained
Ethiopia’s Coffee Sector 247
© 2007 The Author.
Journal compilation © 2007 Blackwell Publishing Ltd, Henry Bernstein and Terence J. Byres.
Journal of Agrarian Change, Vol. 7 No. 2, April 2007, pp. 225–263.
Table 4. Main features of the coffee sector liberalization in Ethiopia
Pre-liberalization (before 1991) Post-liberalization (after 1991)
Marketing channels
Domestic coffee trade mostly under the control of cooperatives
and state-owned companies. The Ethiopian Coffee Marketing
Corporation (ECMC) is responsible for most of the internal and
external marketing of coffee, controlling more than 80 per cent of
the entire coffee trade.
ECMC split into two public companies in 1992: the Ethiopian
Coffee Purchase and Sales Enterprise (ECPSE), which purchases
coffee and delivers it to auction, and the Ethiopian Coffee Export
Enterprise (ECEE), which purchases coffee at auction for export.
Both companies were later closed down and all coffee is now
exported by private companies.
Regulation
Licensing rules: sebsabies, akrabies and exporters all licensed
separately and their activities prescribed and limited (as above).
While the number of restrictions on private traders reduced, licences
are still required for every function in the marketing chain.
Very expensive licence fees reduced the number of market
participants (for example, 25,000 ETB for an export licence).
Only service cooperatives and the ECMC to market washed
- 19. coffee, from which private traders excluded.
Licence fees were reduced in 1993 to encourage more market
participants. Fees for the issue and renewal of licence are 200 ETB
for exporters and 150 ETB for sebsabies and akrabies. Since 1999
akrabies can also buy directly from farmers. Private traders can now
also participate in trade in washed coffee.
All coffee must go through auction. Auction maintained, but since 2001 direct export sales by
cooperatives unions and, to a lesser extend, by private investors are
permitted.
Coffee rejected at auction as below export standard redirected
to domestic market.
Restriction continues: coffee can be sold on the domestic market
only after inspection at auction and certification that it is unsuitable
for export.
Traders issued with quotas. Private exporters not allowed
to compete for coffee until the ECMC’s quota met.
Quota system abolished.
248 Nicolas Petit
© 2007 The Author.
Journal compilation © 2007 Blackwell Publishing Ltd, Henry Bernstein and Terence J. Byres.
Journal of Agrarian Change, Vol. 7 No. 2, April 2007, pp. 225–263.
Distribution of inputs/credit
Inputs provided by the Agricultural Inputs Supply Corporation, at
subsidized prices for chemical inputs. However, most coffee
farmers did not use fertilizer, pesticides or herbicides (except state
farms), due to limited access to credit among other factors.
Input distribution liberalized in 1993 and entry of private
companies. Input subsidies abolished in 1997. Still few credit
opportunities available to farmers. Bank lending for investment in
processing equipment is available but difficult to access.
Pricing
Export prices: Floor price for exports set by the National Bank of
Ethiopia (NBE).
Coffee Price Differential Setting Committee established following
liberalization, chaired by the NBE and comprising members of the
exporters association, the ECEE and the Coffee and Tea Authority
(CTA); sets daily minimum prices for different grades of washed
and unwashed export coffees. Exporters obliged to register at least
this minimum price at the NBE when they make a sale. Because of
problems in adjusting prices to international prices, the NBE
abandoned this procedure, hence ending to export price control, in
November 2002.
Grower prices: Fixed price set by the Ministry of Coffee and Tea
Development (MCTD). The difference between the grower price
and the export (f.o.b.) price taken as tax by the government.
- 20. Payment to farmers now determined by market prices. However,
farm-gate floor prices maintained until 1996/97 for red cherries and
more recently for dry cherry. (Cooperatives usually a second
dividend payment to members as a proportion of profits on sale of
their coffee, thus raising the total price to farmers).
Taxation
Four kinds of coffee export taxes: (i) export duty of 150 ETB/ton;
(ii) cess of 50 ETB/ton; (iii) transaction tax of 2 per cent of f.o.b.
value; (iv) surtax in proportion to export price. In addition, some
municipality taxes levied on the domestic transport of coffee.
‘Heavy taxation’ encouraged large-scale smuggling of coffee
through Djibouti, Kenya and Sudan.
In 1998, various taxes and duties consolidated into a single tax set at
6.5 per cent of the f.o.b. price (NB: All export duties and taxes
except those on coffee abolished). In June 2002, the export coffee tax
suspended in response to persistently low international prices; will
be re-imposed if prices rise again. Reduced incidence of smuggling.
Pre-liberalization (before 1991) Post-liberalization (after 1991)
Table 4. Continued.
Ethiopia’s Coffee Sector 249
© 2007 The Author.
Journal compilation © 2007 Blackwell Publishing Ltd, Henry Bernstein and Terence J. Byres.
Journal of Agrarian Change, Vol. 7 No. 2, April 2007, pp. 225–263.
Quality control
Both washed and unwashed coffees subject to a number of
inspections and quality controls throughout the marketing system.
Stringent quality controls for washed coffees at different levels
from first inspection when the cherry delivered to the washing
station (only ripe and newly harvested cherries purchased, others
rejected and marketed as unwashed coffee). A second inspection
after processing; coffee that failed this second test sold on the
domestic market. Unwashed coffee subject to less stringent quality
control. Moisture content strictly checked before the auction for
both types of coffee. Further quality assessment before auction and
before export. Only washed coffee cup tasted by CLU prior to
auction. Price premium for washed coffee but no direct price
incentive on quality.
Government quality controls maintained at both local level and
auction. Moisture levels still strictly checked. As of 1999, the coffee
liquoring unit (CLU) also cup tastes all unwashed coffee prior to
auction and export, providing exporters with better information
about quality. However, exporters are not allowed to cup taste
coffee before buying it at auction. Considerable emphasis on
keeping consignments from different regions separate in order to
maintain their distinctive flavours. Coffee still bought at one price
- 21. irrespective of quality, with higher price cherry that is wet
processed.
Source: Compiled from Alemayehu (1999), LMC (2000, 2003), Love (2002), IFPRI (2003), and Daviron and Ponte (2005).
Pre-liberalization (before 1991) Post-liberalization (after 1991)
Table 4. Continued.
250 Nicolas Petit
© 2007 The Author.
Journal compilation © 2007 Blackwell Publishing Ltd, Henry Bernstein and Terence J. Byres.
Journal of Agrarian Change, Vol. 7 No. 2, April 2007, pp. 225–263.
(Daviron and Ponte 2005).16 Finally, Alemayehu argues that liberalization has
also resulted in a dramatic reduction of government revenues (following tax
reforms), with detrimental effects on the government’s ability to provide necessary
services to the public. While in the pre-reform period, coffee exports contributed
around 8 per cent of total government revenue, this dropped to an average of
16 Even though strict government controls have been maintained at federal level by the coffee quality
control and liquoring unit (CLU), this is not necessarily the case in the producing regions. For example,
Kotecha (2002) suggests that after liberalization many new akrabies started supplying coffees mixed
from different regions, hence of mixed qualities, ignoring the longer term consequences of this practice.
Figure 5 Coffee arrival at auctions
Figure 6 Ethiopia’s coffee export performance
Ethiopia’s Coffee Sector 251
© 2007 The Author.
Journal compilation © 2007 Blackwell Publishing Ltd, Henry Bernstein and Terence J. Byres.
Journal of Agrarian Change, Vol. 7 No. 2, April 2007, pp. 225–263.
1 per cent following liberalization (Alemayehu 1999). However, Love (2002)
suggests that this does not mean that coffee is less significant as a fiscal resource,
since the government increased its capacity to extract a share of the value added
at other stages in the production and distribution of the crop at the same time
(such as direct taxes on income, land or profits).
For Daviron and Ponte (2005), although liberalization has taken place in most
coffee producing countries, there is no single or uniform path of liberalization/
deregulation. Ethiopia is an interesting case, with a partial liberalization where
some strict government controls remain. It appears here that it is essential to go
beyond the dichotomy of market and state that permeates the discourses of
neoliberal ‘reform’. For example, the role of state regulation remains fundamental
in maintaining quality performance and the uniqueness of Ethiopian coffees (at
least in part, at federal level) at the same time as market reforms have been
accompanied by an improved export performance. Last but not least, while
some regulations appear as a response to the requirements of the international
market (such as quality standards), regulations also serve a political purpose for
the present regime in ensuring the centralized collection of foreign currency
necessary to keep the ruling party in power (Love 2002).
Summary
- 22. The ‘commodity problem’ of declining terms of trade and increased price volatility,
combined with shifts in the structure of world markets and ‘governance’ of
the global commodity chain, in the past 20 years mean that many farmers and
governments receive poorer returns from coffee exports. A greater proportion
of value added is captured outside the producing countries; technical changes
mean that some farmers and some producing countries are no longer competitive;
and long term prospects on the world coffee market are poor.
So far, I have argued that many coffee farmers, other actors in coffee commodity
chains in producer countries and national economies dependent on coffee
exports face an increasingly bitter future. Ethiopia is no exception, despite some
immediate gains in supply response and associated export performance. What
kinds of opportunities (and under which national constraints) are there to provide
a better future (if any) to the government and the estimated 15 million people
in Ethiopia whose livelihoods, at least in substantial measure, depend on coffee?
What solutions have been proposed so far by the government or development
agencies? I turn to these questions next.
PROSPECTS FOR ETHIOPIA: WHAT CAN BE DONE AND WHAT IS
BEING DONE?
What Can Be Done? The General Framework
Various solutions at the national and international levels have been proposed to
offer a better future to coffee farmers and coffee producing countries. Here I
252 Nicolas Petit
© 2007 The Author.
Journal compilation © 2007 Blackwell Publishing Ltd, Henry Bernstein and Terence J. Byres.
Journal of Agrarian Change, Vol. 7 No. 2, April 2007, pp. 225–263.
shall consider only solutions available at the national level.17 Identifying the best
ways to maximize Ethiopia’s export earnings or the prices received by coffee
farmers is not an easy task, and policy makers are faced by a number of dilemmas
with different routes available.
Options available ‘outside’ or ‘within’ coffee are not mutually exclusive, since
coffee growers can combine increased competitiveness within coffee alongside
other, sometimes new, activities, for example, diversification into other ‘traditional’
crops or other high-value commodities (like horticultural commodities)
or options beyond agriculture (NRI 2006). Even though it is important to recognize
that diversifying into other activities (in particular, into new areas of
economic activity such as manufactures and services) is probably the best way to
reduce dependence on agricultural activity, employment and income, in the long
run (DFID 2004), diversification out of coffee cultivation in the short run
presents a number of challenges. There are severe constraints in many coffee
growing areas which inhibit the development of alternatives, including agroecological
constraints, limited access to markets for other commodities, the perennial
- 23. nature of coffee plants (and the investment they represent), strong cultural
attachment to coffee or ‘adding-up’ problems (if different countries diversify into
the same products). Moreover, alternative crops may not be more attractive in
terms of price and returns to labour (Gibbon 2003; Daviron and Ponte 2005).
Regarding the options ‘within coffee’, benefits could be obtained, in theory, in
a number of ways, such as increasing the quantity of national production
through extensification (new plantings) and/or intensification (higher productivity),
improving quality, increasing the proportion of coffees selling at significant
premiums (such as washed coffee, semi-washed coffee or differentiated coffees),18
or raising demand for Ethiopian coffee through promotion. The options that
may be taken up will depend on international conditions, but also on constraints
and opportunities at a national level.
Constraints and Opportunities at a National Level
The Ethiopian coffee commodity chain faces its own complex set of problems,
including various constraints on production, processing and marketing. The
constraints most commonly referred to include the high incidence of Coffee
Berry Disease (CBD), with an estimated 50–60 per cent of production potentially
at risk; the shortage of improved cultivars adapted to different localities;
17 Discussion of solutions proposed at the international level – including the renewed interest in
promoting supply management, efforts of the now defunct Association of Coffee Producing Countries,
the ICO’s Coffee Quality Improvement Programme (International Coffee Council Resolution
407 recently replaced by Resolution 420), and financial compensation schemes (such as the EU
STABEX/FLEX) – can be found in Daviron and Ponte (2005).
18 The main differentiated strategies includes gourmet and specialty coffees (single origin coffees
and blended coffees with features enabling them to be marketed at price premiums), indications of
geographical origin (IGO) and finally sustainable coffees certified under a range of schemes that aim
to promote the economic, social and/or environmental well being of coffee producers (organic, fair
trade, eco-friendly or shade-grown coffee, Utz Kapeh) (NRI 2006).
Ethiopia’s Coffee Sector 253
© 2007 The Author.
Journal compilation © 2007 Blackwell Publishing Ltd, Henry Bernstein and Terence J. Byres.
Journal of Agrarian Change, Vol. 7 No. 2, April 2007, pp. 225–263.
poor harvest and post-harvest practices reducing coffee quality; and weak linkages
between research, extension services and producers. Moreover, the lack of
accurate and topical data considerably reduces the scope for informed analysis,
the diverse taste profiles of Ethiopian coffees are not fully reflected in the current
national classification system, and there are various shortcomings in the marketing
system and in the organizational structure at government level (FDRE 2003a;
Westlake 1998; Scanagri 2005).19 Not least, environmental degradation is a
serious concern, with rates of deforestation estimated at 10,000 ha/year in the
coffee growing areas of the South Western parts of Ethiopia, threatening its
coffee genetic resources (Gole 2003). High levels of river pollution are also a
major problem near coffee pulping and washing stations (Agrisystems 2001).
- 24. With these constraints in mind, what opportunities are available?
With regards to the potential for product differentiation, Scanagri argues that
‘given its wealth of genetic resources and large areas with exceptionally good
growing conditions, Ethiopia has the potential to produce large amounts of
differentiated high-quality green coffee’ (2005, 49). For example, as noted above,
in specialty/gourmet segments of the international coffee market, Ethiopia
occupies a unique place with an impressive selection of distinctive coffee profiles.
For Westlake (1998), there is considerable potential to increase the proportion of
specialty coffee exports (used in premium blends or sold as single origins) if
quality and consistency are guaranteed.20 Increasing the quantity of washed coffee
has also been proposed by many analysts as it sells at significant premiums over
unwashed coffee (FDRE 2003a). More recently, it has been found that Ethiopian
semi-washed coffees and good quality unwashed coffees also present significant
potential on world markets.21 Some specialty coffees are starting to be sold to
consumers with specific indication of geographical origin (IGO), similar to
wines. For Daviron and Ponte (2005), even though IGO systems are imperfect,
they can be designed to benefit coffee producers by allowing them a share in
marketing symbolic quality attributes normally controlled by actors downstream
in the global commodity chain.
The potential of sustainable coffees in Ethiopia also deserves particular attention
because of their increasing popularity. For example, Ethiopia has a natural
advantage in markets for organic coffee as more than 90 per cent of production
is de facto organic (Mekuria et al. 2004). Furthermore, it is the only country
that produces natural forest Arabica coffee, providing scope for the sale of
shade-grown coffees, for example, through the Rainforest Alliance certification
19 For example, the various restructurings of the government agencies responsible for the coffee
sector are seen as a major impediment to the development of appropriate policies (FDRE 2003a).
20 According to ICO (2000), consistency is essential as traders or roasters have no interest in a coffee
that may be seen only once.
21 The search in the last few years for different specialty single origin coffees has found ‘goldmines’
in Ethiopia with ‘pulped natural’ (semi-washed coffees) and sun dried coffee of only ripe fruit
(separating the unripe and overripe cherries), which are found to have fuller taste profiles and often
fetch higher prices than washed coffees. Moreover, the pulped natural post-harvest process uses little
water compared to washed coffees and is more ecologically friendly (Kotecha, personal communication).
254 Nicolas Petit
© 2007 The Author.
Journal compilation © 2007 Blackwell Publishing Ltd, Henry Bernstein and Terence J. Byres.
Journal of Agrarian Change, Vol. 7 No. 2, April 2007, pp. 225–263.
system.22 However, sustainable coffees present a number of limitations. Firstly,
the markets for these products remain small, accounting for a tiny proportion of
the global coffee market.23 Secondly, although they tend to offer higher prices
to producers, this is not always the case. Except where covered by fair trade
schemes, premiums are not guaranteed but are a function of market demand.
- 25. Moreover, if premiums are offered they are likely to diminish as more farmers
and buyers get involved (NRI 2006). Entering such markets is also a significant
challenge for most producers. For example, fair trade certification is only available
to small farmer groups, organizations and cooperatives which generally consist
of better-off farmers, who are more likely to benefit (Daviron and Ponte 2005).
Finally, entry into the sustainable coffee market requires careful assessment, as the
price premium obtainable may not cover the additional marketing, certification
or inspection costs (NRI 2006). Nonetheless, Lewin et al. (2004) argue that these
markets are important because of their current growth rates and their potential
to provide better social, economic or environmental benefits for farmers.
Organic, fair trade or shade-grown initiatives present a number of positive externalities
in the field such as organizational development, better natural resource
management, biodiversity conservation and so on (Lewin et al. 2004). Finally,
although there are opportunities for product differentiation, Daviron and Ponte
(2005) also argue that certification and labels do not necessarily promote different
trading relations from those in mainstream trade, as such schemes can provide
the means for larger specialty roasters and retailers to outsource troubleshooting
(‘low-cost conscience cleansing’) while not necessarily leading to better conditions
for farmers.
In short, while some of the options outlined present opportunities that may
be taken up by different actors along the chain (or by governments in producer
countries), they also present limitations. Diversification out of coffee is difficult,
differentiated coffees are not an answer for all farmers, and only a partial answer
at best in considering the near future. Other answers are needed (Lewin et al.
2004). Westlake (1998) argues that even though there is potential for selling
coffee as ‘forest’, ‘organic’ and expanding sales through the specialty market, the
majority of exports in the near future will comprise non-differentiated coffees,
and this is probably where the greatest benefits could be obtained. According to
Lewin et al. (2004), industry surveys indicate that quality and consistency are
among the most important factors to be competitive in today’s markets. Kotecha
(1999) further argues that there is no deficit in demand for the best qualities of
Ethiopian coffee even in times of global surplus. The primary need, therefore,
is to raise the quality (of both differentiated and non-differentiated coffees) rather
22 According to the Rainforest Alliance website (http://www.rainforest-alliance.org), since April
2006 Ethiopia represents their first coffee partnership outside Latin America as 678 family farms from
Mana woredas (Jima Zone, Oromiya Region) received certification from Rainforest Alliance with
support from the EFICO foundation in Belgium.
23 In 2003, the sustainable coffee market (Utz Kapeh, organic, fair trade and shade-grown certified
coffees) accounted for approximately 1 per cent of global coffee exports; shade-grown coffees, for
example, have international sales of only 9100 (60 kg) bags in 2000 (Daviron and Ponte 2005).
Ethiopia’s Coffee Sector 255
© 2007 The Author.
- 26. Journal compilation © 2007 Blackwell Publishing Ltd, Henry Bernstein and Terence J. Byres.
Journal of Agrarian Change, Vol. 7 No. 2, April 2007, pp. 225–263.
than quantity, as higher quality levels fetch significant premiums. Moreover, it is
essential to ensure that their investment in higher quality benefits producers,
requiring farm gate payments that incorporate incentives for quality.
What Is Being Done? Government Policies I: PRSP
In July 2002, the government of Ethiopia finalized its first Poverty Reduction
Strategy Paper (PRSP), known as the Sustainable Development and Poverty
Reduction Program (SDPRP), for the period 2000–2005. In December 2005, it
presented a draft of the second generation PRSP, called the Plan for Accelerated
and Sustained Development to End Poverty (PASDEP), for the period 2006–
2010. One of the building blocks of both SDPRP and the PASDEP is the
long-term strategy of ‘Agriculture Development Led Industrialization’ (ADLI)
pursued by the government since 1991, whereby the development of agriculture
is to support industrialization by providing a market and a source of raw materials
and capital accumulation. In particular, the ADLI strategy underlines the potential
scope of the domestic market and the important role it could play for growth of
both agriculture and industry. It also gives recognition to the critical role of
exports in terms of growth of both income and foreign exchange (FDRE 2000).
However, despite the importance of coffee for economic development (with
these interlinkages in mind) and for poverty reduction, there are hardly any
discussions of coffee in either document except for some references to the decline
in coffee prices and the rhetoric of diversification.24 In order to reduce the
dependence on export earnings from coffee, the SDPRP policy matrix for 2002–
2005 proposes encouraging diversification of exports of products and industries
with high potential foreign exchange earnings and savings (FDRE 2002). The
PASDEP is very similar in its recommendations, with an even greater focus on
promoting export diversification (FDRE 2005). Both documents emphasize
diversification into horticulture (including cut-flowers), oilseeds, pulses, vegetables
and fruits, as well as tourism, textiles and garments or leather products. Various
difficulties associated with diversification by coffee farmers have already been
indicated, and PASDEP acknowledges that ‘despite its volatility, coffee will
probably continue to be the country’s major export commodity during the
medium term’ (FDRE 2005, 114). However, there are no policy measures
proposed to improve returns to coffee.
One explanation for the lack of attention to coffee in the different PRSPs,
hence their lack of investment plans, might be the common tensions between
donors and governments in drafting PRSPs which, while promoted as exemplifying
‘country ownership’ of development policy, have to adhere to the neoliberal
strictures of the international financial institutions.25 According to Gibbon
(2003), since the late 1990s, (‘traditional’) agricultural commodity exports have
- 27. 24 For example, in the PASDEP, coffee is mentioned five times in a 133 page report.
25 See, for example, the analyses of Craig and Porter (2003) and Cammack (2004) of the contradictions
and weaknesses of the PRSP process.
256 Nicolas Petit
© 2007 The Author.
Journal compilation © 2007 Blackwell Publishing Ltd, Henry Bernstein and Terence J. Byres.
Journal of Agrarian Change, Vol. 7 No. 2, April 2007, pp. 225–263.
occupied an increasingly residual role in the concerns of development agencies,
which now emphasize diversification into ‘non-traditional’, high-value agricultural
and fishery export commodities (yet another example of the ‘one size fits
all’ thinking of aid agencies evident in a wide range of fields?). This is illustrated
in two recent donor reports used for the preparation of the PASDEP: a World
Bank report on opportunities and challenges for developing high-value agricultural
exports in Ethiopia (World Bank 2004) and the Diagnostic Trade Integration
Study of the Integrated Framework Program (IF 2004).26
Government Policies II: The Coffee Development and Marketing Plan
In accordance with the ADLI strategy, a series of ‘comprehensive’ development
and marketing plans were prepared for different crops under the supervision of
the MoARD in 2003–2004. These plans aim at transforming household farming
from ‘subsistence’ to ‘market-oriented’ (commodity) production, stimulating
productivity, growth and international competitiveness (FDRE 2003b).27 The
coffee development and marketing plan is to be implemented over a period of
five to six years in the major and medium coffee growing woredas. The plan calls
for increased production and productivity, and improvement in coffee quality
and processing, and envisages a major shift to washed coffee to realize significant
premiums prices in the world market. Plans are also proposed to improve the
efficiency of the current marketing system together with activities to enhance
international promotion of Ethiopian coffees (FDRE 2003a). The ambitious
targets – new coffee plantings on 463,021 ha, and average annual production of
70,000 tons of organic coffee, 200,000 tons of sun-dried coffee and 150,000 tons
of washed coffee – contrast with the rhetoric of diversification found in the
different PRSPs in what seems like a recipe for incoherence and confusion.
Although the plan displays a good understanding of constraints and opportunities,
it is wishful thinking to believe that all the activities proposed could be
implemented given pressures on scarce financial resources currently available for
coffee development in Ethiopia. According to Scanagri, ‘what is needed is a
coffee sector policy which seeks to narrow down the large set of activities listed
in the plan to the set which, using the available resources, is likely to be most
cost-effective in raising earnings from the export of coffee and improving the
livelihood of coffee farmers’ (2005, 36; emphasis in original). In short, the plan
clearly lacks prioritization. Moreover, increasing volume and selling higher quantities
- 28. without first properly investigating and addressing quality and marketing
opportunities is inherently mistaken. Finally, implementing the coffee plan is
26 The Integrated Framework (IF) was inaugurated in 1997 by six multilateral institutions (IMF,
ITC, UNCTAD, UNDP, WB and the WTO). It has two objectives: (i) to mainstream international trade
in national development plans such as the PRSPs of least-developed countries, and (ii) to assist in the
coordinated delivery of trade-related technical assistance; see http://www.integratedframework.org/
about.htm.
27 The plans prepared include cotton, pulse crops, spices, oil seed, dairy, poultry, apiculture, sericulture,
fisheries, and hides and skins, as well as coffee.
Ethiopia’s Coffee Sector 257
© 2007 The Author.
Journal compilation © 2007 Blackwell Publishing Ltd, Henry Bernstein and Terence J. Byres.
Journal of Agrarian Change, Vol. 7 No. 2, April 2007, pp. 225–263.
also constrained by major organizational problems in the MoARD. In addition
to the various restructurings of recent years, there is virtually no link between
the coffee development department (CTSDD) and the coffee marketing department
(CTSCMD), which is essential. At present, it is not known if funding has been
made available for the different activities proposed in the plan, nor what has been
achieved so far.
Donor Interventions
Different donors currently fund coffee development in Ethiopia, in relation to
such activities and objectives as agronomic and post-harvest efficiency, organization
of farmers in cooperatives, improved marketing institutions, as well as
product differentiation strategies to gain premiums for producers. Together with
the dominance of narratives about diversification in the PRSP (above), donors’
thinking about, and assistance to, coffee are closely related to the prevailing
global orthodoxy of economic liberalization: a minimal economic role for the
state, an enhanced role for the market, increased space for the private sector as
the new engine of modernization, and so on. In this framework, previous
interventions such as supply management schemes have been replaced by new
initiatives like market-based ‘price risk management’ (PRM) instruments pushed
by World Bank economists, together with a ‘post-Washington consensus’ focus
on Private Sector Development (PSD) and Private Public Partnership (PPP)
initiatives (Gibbon 2003). Doubtless to say, the current portfolio of coffee-related
projects in Ethiopia reflects this; for example, the IFAD Agricultural Marketing
Improvement Programme is closely related to PRM initiatives, proposing a
warehouse receipt system for grain marketing and the forward coffee auction
to reduce the risks faced by marketing intermediaries (IFAD 2004). In similar
fashion, the German GTZ has recently established various PPP projects in
Ethiopia, including a scheme for sustainable coffee production and marketing in
the Bonga Forest that brings together giant agro-food corporations like Kraft
Foods and the Amber Corporation with two coffee unions as local ‘partners’.
- 29. While it is too soon to assess the impact of such projects in Ethiopia, we can note
Gibbon’s observation that ‘limitations associated with the use of PRM in
relation to developing country agro-commodities have been widely noted
without this having dampened enthusiasm for them to any noticeable degree’
(2003, 10).
Secondly (and closely related to our first argument), most donor reports on
the weaknesses of the current coffee marketing structure are based on ‘New
Institutional Economics’ (NIE) analyses in which a certain conception of
economic efficiency provides the benchmark (IFPRI 2003, for example). While
there is clearly much scope to improve the current coffee marketing structure for
the benefit of farmers, other factors need to be taken into account. According to
Love (2001, 2002), understanding the contemporary marketing structure of
coffee in Ethiopia entails sensitivity to political and historical antecedents. The
current marketing structure and its institutions are better explained by a political
258 Nicolas Petit
© 2007 The Author.
Journal compilation © 2007 Blackwell Publishing Ltd, Henry Bernstein and Terence J. Byres.
Journal of Agrarian Change, Vol. 7 No. 2, April 2007, pp. 225–263.
economy approach in which power and control are the markers, and which can
better identify constraints on reform. Bates similarly stresses the failure of NIE
to take into account ‘the allocation of political power in society and the impact of
the political system on the structure and performance of economic institutions’
(Bates 1995, 44). For example, he shows how different political environments
are essential to explain the difference in performance of the Kenyan (efficient)
and Tanzanian (inefficient) Coffee Marketing Boards in the immediate postindependence
period. In Kenya, the coffee industry was closely linked to the
Kenyatta regime with its political base in coffee growing areas where top political
figures owned plantations and employed their powers to promote the efficient
operations of the coffee industry. In Tanzania, by contrast, coffee producing
areas in the highlands were considered sources of political opposition, hence
there were no political incentives to promote their interests.
Thirdly, some projects currently under implementation deserve particular
attention for their potential benefits. For example, the Coffee Improvement
Programme IV funded by the European Commission (EC) and its landrace
development programme could bring enormous benefit to the coffee sector if
successful.28 Another interesting example is the Agricultural Cooperatives in
Ethiopia (ACE) project funded by USAID and considered one of the ‘success
stories’ of donor interventions in the Ethiopian coffee industry.29 The project
has benefited close to 180,000 small-scale coffee producers from 154 primary
cooperatives federated into the four coffee unions of Ethiopia. Most recent
estimates show that, following the government decision to allow cooperatives
- 30. to bypass the auction, direct exports of differentiated coffee by the unions
increased from US$0.27 million in 2001 to US$31.9 million in 2005. Moreover,
in 2004, the unions paid out US$1.63 million in dividends above initial buying
prices to cooperative members, and the trend is strongly upward (Dempsey
2006). In addition, in the case of fair trade in the Oromiya Region, Grundy
(2005) found that besides second payments to farmers, there are considerable
additional benefits which contribute in different ways to improving coffee farmers’
livelihoods. These include the provision of savings and credit services, direct
investment in local services (schools, water and sanitation, health clinics) and
support to cooperatives.
This shows that despite the limitations of the sustainable coffee markets,
opportunities remain to assist some coffee producers in Ethiopia. According to
the UK Department for International Development (DFID 2004), strengthened
producer organizations are essential to a stronger bargaining position for farmers
within the supply chain. In their summary of proposals for an alternative agenda
to resolve the ‘coffee paradox’, Daviron and Ponte (2005) similarly propose the
28 Scanagri (2005) argues that one of the main factors currently reducing Ethiopia’s coffee potential
is the significant proportion of Ethiopian coffee that has lost some of its distinctive area-specific taste
characteristics due to the planting of extraneous CBD resistant varieties in the past. Therefore, the
EC project is trying to develop CBD resistant trees that are both adapted to local growing conditions
and maintain the typical cup quality of each specific area.
29 See USAID website: http://www.usaid.gov/regions/afr/success_stories/ethiopia.html
Ethiopia’s Coffee Sector 259
© 2007 The Author.
Journal compilation © 2007 Blackwell Publishing Ltd, Henry Bernstein and Terence J. Byres.
Journal of Agrarian Change, Vol. 7 No. 2, April 2007, pp. 225–263.
strengthening of producer organizations. There is also an initiative concerning
trademarks and licensing activities to enable poor growers to secure a greater
share of the retail price of coffee, although its impact in Ethiopia is not yet
known.
Finally, a major flaw in donor interventions is illustrated by lack of coordination
between them, leading to problems of duplication of activities or incoherent
interventions in the same areas. Most aid organizations have a very limited
knowledge (if any) of interventions in the coffee sector other than their own
programmes and projects. This is potentially detrimental, as many projects
concern the same type of activities. For example, many donors involved in
various product differentiation strategies (in particular, organic or fair trade
coffees) are increasingly working with the popular coffee unions with very similar
activities.30
CONCLUSION: WAYS FORWARD
Despite the rhetoric of diversification, coffee will probably remain Ethiopia’s
most valuable export for some time. Therefore interventions in the coffee sector
- 31. in the short and medium term remain of critical importance for both producers
and the government. Ethiopian coffees occupy a special place in the world coffee
industry and different analysts agree that there is no deficit in demand provided
that quality and consistency are guaranteed (Westlake 1998; Scanagri 2005;
Kotecha 1999). The path to ‘success’ lies in exploiting the unique aspects of
Ethiopian coffee which, combined with improvements in harvest and post
harvest practices, for example, can supply consistently high quality coffee and
maintain or increase its competitiveness on the world market. How might this
be achieved?
First, and fundamentally, a more adequate analytical framework is required,
with consideration of some key methodological issues. Even though some may
appear simplistic or self-evident, they are often neglected in current analysis. For
example, a detailed understanding of the structure and workings of the world
coffee market is essential to identify constraints (‘coffee crisis’, asymmetrical
character of power in the ‘global coffee value chain’) and opportunities (‘what
the market wants’ rather than what Ethiopia wants to sell). Again, if the poverty
reduction impact of any strategy is a central concern, which coffee farmers are
interventions designed to support? Farmers are not homogeneous, but differentiated
by inter alia landholding/farm size, sources of income, and different
responses to hazards, as illustrated earlier. Of key importance is that wage
employment is often the principal source of income for the poorest coffee farmers.
The effects of coffee development interventions for rural labour markets are thus
a key consideration for poverty reduction. A final instance is that the importance
of systematically linking the coffee sector with broader economic development
30 It is interesting to note that until recently cooperatives had a bad reputation with donors due to
their political use during the Derg regime (Dempsey 2006).
260 Nicolas Petit
© 2007 The Author.
Journal compilation © 2007 Blackwell Publishing Ltd, Henry Bernstein and Terence J. Byres.
Journal of Agrarian Change, Vol. 7 No. 2, April 2007, pp. 225–263.
issues should not be overlooked. In particular, the role of agriculture, and
agricultural commodity exports, in economic development remains subject to
debate, with competing views on the role of the state in facilitating needed
structural changes (UNCTAD 1998).
Responding to various constraints may also require an enhanced role for the
state in contrast to the neo-liberal mantra of deregulatory and market-based
approaches. We noted the importance of regulation with regard to maintaining
– and improving – coffee quality, and regulation for environmental protection is
also urgently needed. State support is similarly required to improve infrastructure,
extension services, access to finance and credit, and research, all of which are
urgently needed. At the same time, the government needs to prioritize activities
- 32. in accordance with the scarce resources available and identify a cost-effective
coffee sector ‘policy’ based on ‘what the (export) market wants’. This suggests
a clear focus on quality rather than quantity as the priority. A coherent (and
durable) government structure for regulating and promoting the coffee sector
would be beneficial. In particular, such a coherent structure would connect and
align much more effectively the activities of the coffee development and marketing
departments of the MoARD.
Donors would do well to shed their typically ‘one size fits all’ approach,
especially as it is informed by the standard simplistic dichotomy of (efficient)
market/(inefficient) state. Donors need to plan and coordinate their projects with
each other and with the government, and might consider funding an Ethiopian
Coffee Network led by government and with the participation of representatives of
farmers, cooperative unions, traders, exporters, NGOs, donors and universities.
This could provide a cheap and effective way to exchange information and ideas,
research findings and so on.31
Finally, further research is needed on a number of initiatives. A closer examination
is required of sustainable coffees (especially organic and shade-grown
coffee), and of cooperatives/unions and their role in raising the prices received
by farmers. Are such initiatives available only for a minority? Who benefits:
poor or better-off farmers? Is there a role for a national certification agency?
What kinds of positive externalities might be created or exploited? And so on.
Daviron and Ponte (2005) propose establishing IGO systems in coffee producing
countries; in Ethiopia, IGO systems are still in their infancy and it is not yet
known if they could provide producers with higher prices for their products
and/or wider developmental impacts. Last but not least, more research is needed
on the domestic market and the promotion of domestic consumption, as Ethiopia
is one of the few producing countries with a strong domestic coffee culture to
build upon.
31 Subgroups might be later created in accordance with the main issues of concern, for example,
conservation of coffee genetic resources, sustainable coffees or quality improvement initiatives. The
Ethiopian Coffee Network could be linked to a website and/or regular newsletters to serve as a
means of promoting the uniqueness of Ethiopian coffees internationally, as well as disseminating
information to participants in the country’s coffee industry.
Ethiopia’s Coffee Sector 261
© 2007 The Author.
Journal compilation © 2007 Blackwell Publishing Ltd, Henry Bernstein and Terence J. Byres.
Journal of Agrarian Change, Vol. 7 No. 2, April 2007, pp. 225–263.
There are, of course, other issues that these broad suggestions do not address.
This by no means implies that they are not important. In particular, real alternatives
should also be sought at the international level in support of coffee
dependent developing countries and millions of people dependent on coffee for
their livelihood.
- 33. REFERENCES
Agrisystems Ltd, 2001. Coffee Support Project, Ethiopia. Revised Draft Formulation Report
for the European Commission. April 2001.
Alemayehu, G., 1999. Trade Liberalization and the Coffee Sub-Sector: Some Implications for the
Food Sub-Sector. Study prepared for Action Aid, November 1999. Addis Ababa: Ethiopia.
Baffes, J., 2003. ‘Tanzania’s Coffee Sector: Constraints and Challenges in a Global
Environment’. Africa Region Working Paper Series 56. Washington: World Bank.
Baffes, J., B. Lewin and P. Varangis, 2003. ‘Coffee: Market Setting and Policies’. In
Global Agricultural Trade and Developing Countries, eds M.A. Aksoy and J.C. Beghin,
297–309. Washington: World Bank.
Bates, R.H., 1995. ‘Social Dilemmas and Rational Individuals: An Assessment of the
New Institutionalism’. In The New Institutional Economics and Third World Development,
eds J. Harris, J. Hunter and C. Lewis, 27–48. London: Routledge.
Bernstein, H. and L. Campling, 2006a. ‘Commodity Studies and Commodity Fetishism
I: Trading Down’. Journal of Agrarian Change, 6 (2): 239–64.
Bernstein, H. and L. Campling, 2006b. ‘Commodity Studies and Commodity Fetishism
II: Profits with Principles?’ Journal of Agrarian Change, 6 (3): 414–47.
Cammack, P., 2004. ‘What the World Bank Means by Poverty Reduction, and Why it
Matters’. New Political Economy, 9 (2): 189–211.
Craig, D. and D. Porter, 2003. ‘Poverty Reduction Strategy Papers: A New Convergence’.
World Development, 31 (1): 53–69.
Daviron, B. and S. Ponte, 2005. The Coffee Paradox: Global Markets, Commodity Trade
and the Elusive Promise of Development. London: Zed Books in association with the
Technical Centre for Agricultural and Rural Cooperation (CTA).
Dempsey, J., 2006. A Case Study of Institution Building & Value Chain Strengthening to Link
Ethiopian Cooperative Coffee Producers to International Markets. Addis Ababa: ACDI/
VOCA.
DFID, 2004. Rethinking Tropical Agricultural Commodities. London: Department for International
Development.
FAO, 2006. FAO/WFP Crop and Food Supply Assessment Mission to Ethiopia. Rome: Food
and Agricultural Organization.
FDRE, 2000. Interim Poverty Reduction Strategy Paper. Addis Ababa: Federal Democratic
Republic of Ethiopia.
FDRE, 2002. Sustainable Development and Poverty Reduction Program. Addis Ababa: Federal
Democratic Republic of Ethiopia.
FDRE, 2003a. Comprehensive Coffee Development and Marketing Plan. Addis Ababa: Federal
Democratic Republic of Ethiopia, Ministry of Agriculture and Rural Development.
Translated from Amharic in July 2004 by the Coffee Improvement Programme IV.
FDRE, 2003b. Sustainable Development and Poverty Reduction Program Annual Progress
Report (2002/2003). Addis Ababa: Federal Democratic Republic of Ethiopia, Ministry
of Finance and Economic Development.
262 Nicolas Petit
© 2007 The Author.
Journal compilation © 2007 Blackwell Publishing Ltd, Henry Bernstein and Terence J. Byres.
Journal of Agrarian Change, Vol. 7 No. 2, April 2007, pp. 225–263.