1. Name ___________________________________ Date __________________
Mrs. Labuski / Mrs. Portsmore Period __________ Unit 12 Lesson 5 Measure of
Variability OC 7-3
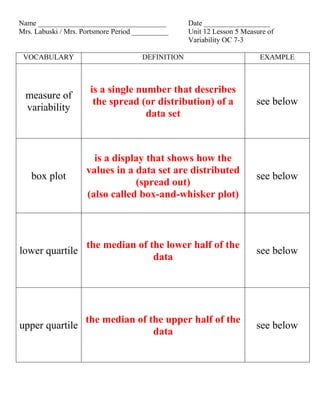
VOCABULARY DEFINITION EXAMPLE
measure of
variability
is a single number that describes
the spread (or distribution) of a
data set
see below
box plot
is a display that shows how the
values in a data set are distributed
(spread out)
(also called box-and-whisker plot)
see below
lower quartile
the median of the lower half of the
data
see below
upper quartile
the median of the upper half of the
data
see below
2. To make a box plot, first find five values for the data set:
The least value
The lower quartile — the median of the lower half of the data
The median
The upper quartile — the median of the upper half of the data
The greatest value
A. The heights of several students are shown. Make a box plot for the data.
Step 1 Order the data and find the needed values.
Step 2 Draw the box plot.
On the number line, draw dots above the least value, the lower quartile, the median, the
upper quartile, and the greatest value.
Draw a rectangle (or box) above the number line. The left side of the box should pass
through the dot for the lower quartile. The right side of the box should pass through the dot
for the upper quartile.
Draw a vertical line segment from the top of the box, through the dot for the median, to the
bottom of the box.
Draw horizontal line segments from the dot for the lower quartile to the dot for the least
value and from the dot for the upper quartile to the dot for the greatest value.
3. B. The heights of several different students are shown. Make a box plot of the data.
.
Step 1 Order the data and find the needed values.
Step 2 Draw the box plot.
Compare the box plots in A and B. How do the box plots describe the distribution
of the heights in each group?
The plot in B has a wider box. This means the middle half of the heights in B
are more spread out than in A. Also, the plot in A is roughly symmetrical
about the median, but the plot in B is not. This means the heights in A (but not
B) are fairly evenly distributed on either side of the median.
4. Name ___________________________________ Date __________________
Mrs. Labuski / Mrs. Portsmore Period __________ Unit 12 Lesson 5 Measure of
Variability OC 7-3
VOCABULARY DEFINITION EXAMPLE
measure of
variability
see below
box plot see below
lower quartile see below
upper quartile see below
5. To make a box plot, first find five values for the data set:
The least value
The lower quartile — the median of the lower half of the data
The median
The upper quartile — the median of the upper half of the data
The greatest value
A. The heights of several students are shown. Make a box plot for the data.
Step 1 Order the data and find the needed values.
Step 2 Draw the box plot.
On the number line, draw dots above the least value, the lower quartile, the median, the
upper quartile, and the greatest value.
Draw a rectangle (or box) above the number line. The left side of the box should pass
through the dot for the lower quartile. The right side of the box should pass through the dot
for the upper quartile.
Draw a vertical line segment from the top of the box, through the dot for the median, to the
bottom of the box.
Draw horizontal line segments from the dot for the lower quartile to the dot for the least
value and from the dot for the upper quartile to the dot for the greatest value.
Students’ Heights
6. B. The heights of several different students are shown. Make a box plot of the data.
.
Step 1 Order the data and find the needed values.
Step 2 Draw the box plot.
Students’ Heights
Compare the box plots in A and B. How do the box plots describe the distribution
of the heights in each group?
_____________________________________________________________________________
_____________________________________________________________________________
_____________________________________________________________________________
_____________________________________________________________________________
7. BOX PLOT CHECK LIST
Step One: Organize your data
□ list the numbers from least to greatest ( visually split the list into two halves)
Step Two: Find the 5 Values
□ the least value
□ the lower quartile — the median(middle) of the lower half of the data
□ the median (middle) of the whole set of numbers
□ the upper quartile — the median(middle) of the upper half of the data
□ the greatest value
Step Three: Draw the Box Plot
□ draw a number line
□ plot the 5 values above the number line
□ draw a box whose sides go through the lower quartile and upper quartile
□ draw a vertical line in the box through the median
□ draw horizontal line outside the box connecting lower quartile to least value
□ draw horizontal line outside the box connecting upper quartile to greatest value