SlideShare a Scribd company logo
1 of 13
Measures of Central Tendency

             Mean, Median and Mode
                   for Grouped Data
                     Basic Statistics
Mean for Grouped Data


       Xam
Classmark Formula
The following IQ frequency distribution was obtained from 100
randomly selected high school students. Solve the mean.

   Class Interval           f          Xm              fXm
       90 – 98              6                           564
                                       94
      99 – 107             22         103             2266
      108 – 116            40         112             4480
      117 – 125            24         121             2904
      126 – 134             8         130              1040
                        N = 100                          =11254
Your turn!
The following data represent the scores(in words per minute) of 47
computer encoders on a speed test.

  Class Interval           f          Xm              fXm
     55 – 60              2
     61 – 66              5
     67 – 72              8
     73 – 78              10
     79 – 84              9
     85 – 90              8
      91 - 96             5


            MEAN: ________________
Coded Formula
The following IQ frequency distribution was obtained from 100
randomly selected high school students. Solve the mean.

   Class Interval           f           d               fd
       90 – 98              6           -2             - 12
      99 – 107             22           -1             - 22
      108 – 116            40           0                 0
      117 – 125            24           1                24
      126 – 134             8           2                16
                        N = 100                          =6
Your turn!
The following data represent the scores(in words per minute) of 47
computer encoders on a speed test. Compute the mean using the
Coded formula.

 Class Interval           f           d                fd
     55 – 60              2
     61 – 66              5
     67 – 72              8
     73 – 78             10
     79 – 84              9
     85 – 90              8
     91 - 96              5


            MEAN: ________________
Median for Grouped Data
Computing the Median of Grouped Data
     Let us illustrate the computation of the Median of Grouped Data
     using the IQ frequency distribution obtained from 100 randomly
     selected high school students.
                                              1. Construct the less
Class Interval      f          <cf            than cumulative
                                              frequency.
   90 – 98          6            6
                                              2. Determine the median
  99 – 107         22           28            class. This is the class
  108 – 116        40           68            interval containing half of the
                                              total frequency in the <cf
  117 – 125        24           92            column.

  126 – 134         8          100            3. Use the formula to
                                              find the median.
                 N = 100
Your turn!
The following data represent the scores(in words per minute) of 47
computer encoders on a speed test.

  Class Interval           f          <cf
     55 – 60              2
     61 – 66              5
     67 – 72              8
     73 – 78              10
     79 – 84              9
     85 – 90              8
      91 - 96             5


            MEDIAN: ________________
Mode for Grouped Data
The following is an illustration on finding the mode of the IQ
frequency distribution obtained from 100 randomly selected high
school students.

   Class Interval           f
                                       1. Find the mode class.
       90 – 98             6           This is the class with the
                                       highest frequency.
      99 – 107             22
      108 – 116            40
                                       2. Use the formula
      117 – 125            24          to find the mode.
      126 – 134            8
                        N = 100


                                = 112.26
Mode for Grouped Data
Your turn!
The following data represent the scores(in words per minute) of 47
computer encoders on a speed test. Compute the mode .


                 Class Interval           f
                     55 – 60              2
                     61 – 66              5
                     67 – 72              8
                     73 – 78             10
                     79 – 84              9
                     85 – 90              8
                     91 - 96              5


            MODE: ________________

More Related Content

What's hot

Chapter 2 250110 083240
Chapter 2 250110 083240Chapter 2 250110 083240
Chapter 2 250110 083240
guest25d353
 
Report frequency distribution table
Report frequency distribution tableReport frequency distribution table
Report frequency distribution table
MaTeresa Berondo
 
Math quiz bee
Math quiz beeMath quiz bee
Math quiz bee
No L's
 

What's hot (20)

Measures of central tendency ppt
Measures of central tendency pptMeasures of central tendency ppt
Measures of central tendency ppt
 
Measures of variability
Measures of variabilityMeasures of variability
Measures of variability
 
Group 3 tayutay
Group 3 tayutayGroup 3 tayutay
Group 3 tayutay
 
The Interpretation Of Quartiles And Percentiles July 2009
The Interpretation Of Quartiles And Percentiles   July 2009The Interpretation Of Quartiles And Percentiles   July 2009
The Interpretation Of Quartiles And Percentiles July 2009
 
Mode of Grouped Data - Math 7 (4th Quarter)
Mode of Grouped Data - Math 7 (4th Quarter)Mode of Grouped Data - Math 7 (4th Quarter)
Mode of Grouped Data - Math 7 (4th Quarter)
 
Measures of relative position
Measures of relative positionMeasures of relative position
Measures of relative position
 
Chapter 2 250110 083240
Chapter 2 250110 083240Chapter 2 250110 083240
Chapter 2 250110 083240
 
CABT SHS Statistics & Probability - Sampling Distribution of Means
CABT SHS Statistics & Probability - Sampling Distribution of MeansCABT SHS Statistics & Probability - Sampling Distribution of Means
CABT SHS Statistics & Probability - Sampling Distribution of Means
 
LECTURE ON MEASURES OF CENTRAL TENDENCY (Grouped and Ungrouped)
LECTURE ON MEASURES OF CENTRAL TENDENCY (Grouped and Ungrouped)LECTURE ON MEASURES OF CENTRAL TENDENCY (Grouped and Ungrouped)
LECTURE ON MEASURES OF CENTRAL TENDENCY (Grouped and Ungrouped)
 
Module 3 statistics
Module 3   statisticsModule 3   statistics
Module 3 statistics
 
Measure of central tendency grouped data.pptx
Measure of central tendency grouped data.pptxMeasure of central tendency grouped data.pptx
Measure of central tendency grouped data.pptx
 
Harmonic sequence
Harmonic sequenceHarmonic sequence
Harmonic sequence
 
Kabanata 2 mga pananaw at teoryang literari
Kabanata 2 mga pananaw at teoryang literariKabanata 2 mga pananaw at teoryang literari
Kabanata 2 mga pananaw at teoryang literari
 
Teoryang Romantisismo
Teoryang RomantisismoTeoryang Romantisismo
Teoryang Romantisismo
 
Chapter 3: Prsentation of Data
Chapter 3: Prsentation of DataChapter 3: Prsentation of Data
Chapter 3: Prsentation of Data
 
Report frequency distribution table
Report frequency distribution tableReport frequency distribution table
Report frequency distribution table
 
lesson 3 presentation of data and frequency distribution
lesson 3 presentation of data and frequency distributionlesson 3 presentation of data and frequency distribution
lesson 3 presentation of data and frequency distribution
 
Math quiz bee
Math quiz beeMath quiz bee
Math quiz bee
 
MEASURES OF POSITION FOR UNGROUPED DATA : QUARTILES , DECILES , & PERCENTILES
MEASURES OF POSITION FOR UNGROUPED DATA : QUARTILES , DECILES , & PERCENTILESMEASURES OF POSITION FOR UNGROUPED DATA : QUARTILES , DECILES , & PERCENTILES
MEASURES OF POSITION FOR UNGROUPED DATA : QUARTILES , DECILES , & PERCENTILES
 
Geometric Sequence and Geometric Mean
Geometric Sequence and Geometric MeanGeometric Sequence and Geometric Mean
Geometric Sequence and Geometric Mean
 

Similar to Measuresofcentraltendencygrpdata

Construction of a frequency table
Construction of a frequency tableConstruction of a frequency table
Construction of a frequency table
Mark Santos
 
Chapter 7 statistics
Chapter 7  statisticsChapter 7  statistics
Chapter 7 statistics
atiqah ayie
 
Telefonica Research System for the Spoken Web Search task at Mediaeval 2012
Telefonica Research System for the Spoken Web Search task at Mediaeval 2012Telefonica Research System for the Spoken Web Search task at Mediaeval 2012
Telefonica Research System for the Spoken Web Search task at Mediaeval 2012
MediaEval2012
 

Similar to Measuresofcentraltendencygrpdata (20)

03 central tendency and disperson
03   central tendency and disperson03   central tendency and disperson
03 central tendency and disperson
 
Construction of a frequency table
Construction of a frequency tableConstruction of a frequency table
Construction of a frequency table
 
Measures of central tendency
Measures of central tendencyMeasures of central tendency
Measures of central tendency
 
Chapter 7 statistics
Chapter 7  statisticsChapter 7  statistics
Chapter 7 statistics
 
Estimation part II
Estimation part IIEstimation part II
Estimation part II
 
5-Propability-2-87.pdf
5-Propability-2-87.pdf5-Propability-2-87.pdf
5-Propability-2-87.pdf
 
test & measuement
test & measuementtest & measuement
test & measuement
 
Measure of dispersion statistics
Measure of dispersion statisticsMeasure of dispersion statistics
Measure of dispersion statistics
 
Telefonica Research System for the Spoken Web Search task at Mediaeval 2012
Telefonica Research System for the Spoken Web Search task at Mediaeval 2012Telefonica Research System for the Spoken Web Search task at Mediaeval 2012
Telefonica Research System for the Spoken Web Search task at Mediaeval 2012
 
MEASURES-OF-CENTRAL-TENDENCY-VARIABILITY-TEAM-S-PERSISTENCE.pptx
MEASURES-OF-CENTRAL-TENDENCY-VARIABILITY-TEAM-S-PERSISTENCE.pptxMEASURES-OF-CENTRAL-TENDENCY-VARIABILITY-TEAM-S-PERSISTENCE.pptx
MEASURES-OF-CENTRAL-TENDENCY-VARIABILITY-TEAM-S-PERSISTENCE.pptx
 
Statistics & probability lesson 8&9
Statistics & probability lesson 8&9Statistics & probability lesson 8&9
Statistics & probability lesson 8&9
 
Measures-of-Central-Tendency.ppt
Measures-of-Central-Tendency.pptMeasures-of-Central-Tendency.ppt
Measures-of-Central-Tendency.ppt
 
Median and Mode used in Teaching
Median and Mode used in TeachingMedian and Mode used in Teaching
Median and Mode used in Teaching
 
Lec. 10: Making Assumptions of Missing data
Lec. 10: Making Assumptions of Missing dataLec. 10: Making Assumptions of Missing data
Lec. 10: Making Assumptions of Missing data
 
Median
MedianMedian
Median
 
Role of estimation in statistics
Role of estimation in statisticsRole of estimation in statistics
Role of estimation in statistics
 
STATISTICS
STATISTICSSTATISTICS
STATISTICS
 
Pattern Recognition - Designing a minimum distance class mean classifier
Pattern Recognition - Designing a minimum distance class mean classifierPattern Recognition - Designing a minimum distance class mean classifier
Pattern Recognition - Designing a minimum distance class mean classifier
 
Median of grouped data
Median of grouped dataMedian of grouped data
Median of grouped data
 
227_ch7-hw-soln.pdf
227_ch7-hw-soln.pdf227_ch7-hw-soln.pdf
227_ch7-hw-soln.pdf
 

More from Chie Pegollo (15)

Counting Technique, Permutation, Combination
Counting Technique, Permutation, CombinationCounting Technique, Permutation, Combination
Counting Technique, Permutation, Combination
 
Sampling techniquesmod5
Sampling techniquesmod5Sampling techniquesmod5
Sampling techniquesmod5
 
Counting techniques
Counting techniquesCounting techniques
Counting techniques
 
Measures of central tendency
Measures of central tendencyMeasures of central tendency
Measures of central tendency
 
Presentationofdatamod6b
Presentationofdatamod6bPresentationofdatamod6b
Presentationofdatamod6b
 
Presentationofdatamod6b
Presentationofdatamod6bPresentationofdatamod6b
Presentationofdatamod6b
 
presentation of data
presentation of datapresentation of data
presentation of data
 
Data gathering
Data gatheringData gathering
Data gathering
 
Abuses of statistics
Abuses of statisticsAbuses of statistics
Abuses of statistics
 
Module 3
Module 3Module 3
Module 3
 
Abuses Of Statistics
Abuses Of StatisticsAbuses Of Statistics
Abuses Of Statistics
 
 
Module 2
Module 2Module 2
Module 2
 
Basic Statistics
Basic  StatisticsBasic  Statistics
Basic Statistics
 
Basic statistics
Basic statisticsBasic statistics
Basic statistics
 

Recently uploaded

Salient Features of India constitution especially power and functions
Salient Features of India constitution especially power and functionsSalient Features of India constitution especially power and functions
Salient Features of India constitution especially power and functions
KarakKing
 
The basics of sentences session 3pptx.pptx
The basics of sentences session 3pptx.pptxThe basics of sentences session 3pptx.pptx
The basics of sentences session 3pptx.pptx
heathfieldcps1
 
Jual Obat Aborsi Hongkong ( Asli No.1 ) 085657271886 Obat Penggugur Kandungan...
Jual Obat Aborsi Hongkong ( Asli No.1 ) 085657271886 Obat Penggugur Kandungan...Jual Obat Aborsi Hongkong ( Asli No.1 ) 085657271886 Obat Penggugur Kandungan...
Jual Obat Aborsi Hongkong ( Asli No.1 ) 085657271886 Obat Penggugur Kandungan...
ZurliaSoop
 

Recently uploaded (20)

General Principles of Intellectual Property: Concepts of Intellectual Proper...
General Principles of Intellectual Property: Concepts of Intellectual  Proper...General Principles of Intellectual Property: Concepts of Intellectual  Proper...
General Principles of Intellectual Property: Concepts of Intellectual Proper...
 
How to Add New Custom Addons Path in Odoo 17
How to Add New Custom Addons Path in Odoo 17How to Add New Custom Addons Path in Odoo 17
How to Add New Custom Addons Path in Odoo 17
 
On_Translating_a_Tamil_Poem_by_A_K_Ramanujan.pptx
On_Translating_a_Tamil_Poem_by_A_K_Ramanujan.pptxOn_Translating_a_Tamil_Poem_by_A_K_Ramanujan.pptx
On_Translating_a_Tamil_Poem_by_A_K_Ramanujan.pptx
 
Salient Features of India constitution especially power and functions
Salient Features of India constitution especially power and functionsSalient Features of India constitution especially power and functions
Salient Features of India constitution especially power and functions
 
How to Give a Domain for a Field in Odoo 17
How to Give a Domain for a Field in Odoo 17How to Give a Domain for a Field in Odoo 17
How to Give a Domain for a Field in Odoo 17
 
Python Notes for mca i year students osmania university.docx
Python Notes for mca i year students osmania university.docxPython Notes for mca i year students osmania university.docx
Python Notes for mca i year students osmania university.docx
 
ICT Role in 21st Century Education & its Challenges.pptx
ICT Role in 21st Century Education & its Challenges.pptxICT Role in 21st Century Education & its Challenges.pptx
ICT Role in 21st Century Education & its Challenges.pptx
 
SOC 101 Demonstration of Learning Presentation
SOC 101 Demonstration of Learning PresentationSOC 101 Demonstration of Learning Presentation
SOC 101 Demonstration of Learning Presentation
 
ICT role in 21st century education and it's challenges.
ICT role in 21st century education and it's challenges.ICT role in 21st century education and it's challenges.
ICT role in 21st century education and it's challenges.
 
Wellbeing inclusion and digital dystopias.pptx
Wellbeing inclusion and digital dystopias.pptxWellbeing inclusion and digital dystopias.pptx
Wellbeing inclusion and digital dystopias.pptx
 
Key note speaker Neum_Admir Softic_ENG.pdf
Key note speaker Neum_Admir Softic_ENG.pdfKey note speaker Neum_Admir Softic_ENG.pdf
Key note speaker Neum_Admir Softic_ENG.pdf
 
Understanding Accommodations and Modifications
Understanding  Accommodations and ModificationsUnderstanding  Accommodations and Modifications
Understanding Accommodations and Modifications
 
Jamworks pilot and AI at Jisc (20/03/2024)
Jamworks pilot and AI at Jisc (20/03/2024)Jamworks pilot and AI at Jisc (20/03/2024)
Jamworks pilot and AI at Jisc (20/03/2024)
 
HMCS Max Bernays Pre-Deployment Brief (May 2024).pptx
HMCS Max Bernays Pre-Deployment Brief (May 2024).pptxHMCS Max Bernays Pre-Deployment Brief (May 2024).pptx
HMCS Max Bernays Pre-Deployment Brief (May 2024).pptx
 
Single or Multiple melodic lines structure
Single or Multiple melodic lines structureSingle or Multiple melodic lines structure
Single or Multiple melodic lines structure
 
The basics of sentences session 3pptx.pptx
The basics of sentences session 3pptx.pptxThe basics of sentences session 3pptx.pptx
The basics of sentences session 3pptx.pptx
 
Jual Obat Aborsi Hongkong ( Asli No.1 ) 085657271886 Obat Penggugur Kandungan...
Jual Obat Aborsi Hongkong ( Asli No.1 ) 085657271886 Obat Penggugur Kandungan...Jual Obat Aborsi Hongkong ( Asli No.1 ) 085657271886 Obat Penggugur Kandungan...
Jual Obat Aborsi Hongkong ( Asli No.1 ) 085657271886 Obat Penggugur Kandungan...
 
HMCS Vancouver Pre-Deployment Brief - May 2024 (Web Version).pptx
HMCS Vancouver Pre-Deployment Brief - May 2024 (Web Version).pptxHMCS Vancouver Pre-Deployment Brief - May 2024 (Web Version).pptx
HMCS Vancouver Pre-Deployment Brief - May 2024 (Web Version).pptx
 
2024-NATIONAL-LEARNING-CAMP-AND-OTHER.pptx
2024-NATIONAL-LEARNING-CAMP-AND-OTHER.pptx2024-NATIONAL-LEARNING-CAMP-AND-OTHER.pptx
2024-NATIONAL-LEARNING-CAMP-AND-OTHER.pptx
 
80 ĐỀ THI THỬ TUYỂN SINH TIẾNG ANH VÀO 10 SỞ GD – ĐT THÀNH PHỐ HỒ CHÍ MINH NĂ...
80 ĐỀ THI THỬ TUYỂN SINH TIẾNG ANH VÀO 10 SỞ GD – ĐT THÀNH PHỐ HỒ CHÍ MINH NĂ...80 ĐỀ THI THỬ TUYỂN SINH TIẾNG ANH VÀO 10 SỞ GD – ĐT THÀNH PHỐ HỒ CHÍ MINH NĂ...
80 ĐỀ THI THỬ TUYỂN SINH TIẾNG ANH VÀO 10 SỞ GD – ĐT THÀNH PHỐ HỒ CHÍ MINH NĂ...
 

Measuresofcentraltendencygrpdata

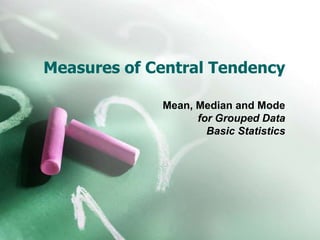
  • 1. Measures of Central Tendency Mean, Median and Mode for Grouped Data Basic Statistics
  • 2. Mean for Grouped Data Xam
  • 3. Classmark Formula The following IQ frequency distribution was obtained from 100 randomly selected high school students. Solve the mean. Class Interval f Xm fXm 90 – 98 6 564 94 99 – 107 22 103 2266 108 – 116 40 112 4480 117 – 125 24 121 2904 126 – 134 8 130 1040 N = 100 =11254
  • 4. Your turn! The following data represent the scores(in words per minute) of 47 computer encoders on a speed test. Class Interval f Xm fXm 55 – 60 2 61 – 66 5 67 – 72 8 73 – 78 10 79 – 84 9 85 – 90 8 91 - 96 5 MEAN: ________________
  • 5. Coded Formula The following IQ frequency distribution was obtained from 100 randomly selected high school students. Solve the mean. Class Interval f d fd 90 – 98 6 -2 - 12 99 – 107 22 -1 - 22 108 – 116 40 0 0 117 – 125 24 1 24 126 – 134 8 2 16 N = 100 =6
  • 6. Your turn! The following data represent the scores(in words per minute) of 47 computer encoders on a speed test. Compute the mean using the Coded formula. Class Interval f d fd 55 – 60 2 61 – 66 5 67 – 72 8 73 – 78 10 79 – 84 9 85 – 90 8 91 - 96 5 MEAN: ________________
  • 8. Computing the Median of Grouped Data Let us illustrate the computation of the Median of Grouped Data using the IQ frequency distribution obtained from 100 randomly selected high school students. 1. Construct the less Class Interval f <cf than cumulative frequency. 90 – 98 6 6 2. Determine the median 99 – 107 22 28 class. This is the class 108 – 116 40 68 interval containing half of the total frequency in the <cf 117 – 125 24 92 column. 126 – 134 8 100 3. Use the formula to find the median. N = 100
  • 9. Your turn! The following data represent the scores(in words per minute) of 47 computer encoders on a speed test. Class Interval f <cf 55 – 60 2 61 – 66 5 67 – 72 8 73 – 78 10 79 – 84 9 85 – 90 8 91 - 96 5 MEDIAN: ________________
  • 11. Mode for Grouped Data The following is an illustration on finding the mode of the IQ frequency distribution obtained from 100 randomly selected high school students. Class Interval f 1. Find the mode class. 90 – 98 6 This is the class with the highest frequency. 99 – 107 22 108 – 116 40 2. Use the formula 117 – 125 24 to find the mode. 126 – 134 8 N = 100 = 112.26
  • 13. Your turn! The following data represent the scores(in words per minute) of 47 computer encoders on a speed test. Compute the mode . Class Interval f 55 – 60 2 61 – 66 5 67 – 72 8 73 – 78 10 79 – 84 9 85 – 90 8 91 - 96 5 MODE: ________________