Using Vehicular Networks to Collect Common Traffic Data
•
0 likes•363 views

Poster accepted at ACM VANET 2009, but presented at ACM VANET 2010 in Chicago

Recommended
More Related Content
What's hot
What's hot (20)
Similar to Using Vehicular Networks to Collect Common Traffic Data
Similar to Using Vehicular Networks to Collect Common Traffic Data (20)
More from Michele Weigle
More from Michele Weigle (20)
Recently uploaded
Recently uploaded (20)
Using Vehicular Networks to Collect Common Traffic Data
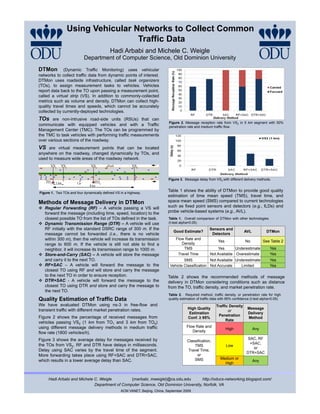
- 1. Using Vehicular Networks to Collect Common Traffic Data Hadi Arbabi and Michele C. Weigle Department of Computer Science, Old Dominion University Figure 2. Message reception rate from VS2 in 5 km segment with 50% penetration rate and medium traffic flow. Figure 3. Message delay from VS2 with different delivery methods. Figure 1. Two TOs and four dynamically defined VS in a highway. Table 1 shows the ability of DTMon to provide good quality estimation of time mean speed (TMS), travel time, and Methods of Message Delivery in DTMon space mean speed (SMS) compared to current technologies Regular Forwarding (RF) – A vehicle passing a VS will such as fixed point sensors and detectors (e.g., ILDs) and forward the message (including time, speed, location) to the probe vehicle-based systems (e.g., AVL). closest possible TO from the list of TOs defined in the task. Table 1. Overall comparison of DTMon with other technologies. Dynamic Transmission Range (DTR) – A vehicle will use (t-test alpha=0.05) RF initially with the standard DSRC range of 300 m. If the Sensors and Good Estimate? AVL DTMon message cannot be forwarded (i.e., there is no vehicle Detectors within 300 m), then the vehicle will increase its transmission Flow Rate and Yes No See Table 2 range to 600 m. If the vehicle is still not able to find a Density neighbor, it will increase its transmission range to 1000 m. TMS Yes Underestimate Yes Store-and-Carry (SAC) – A vehicle will store the message Travel Time Not Available Overestimate Yes and carry it to the next TO. SMS Not Available Underestimate Yes RF+SAC – A vehicle will forward the message to the Vehicle Classification Not Accurate Limited Yes closest TO using RF and will store and carry the message to the next TO in order to ensure reception. Table 2 shows the recommended methods of message DTR+SAC - A vehicle will forward the message to the delivery in DTMon considering conditions such as distance closest TO using DTR and store and carry the message to from the TO, traffic density, and market penetration rate. the next TO. Table 2. Required method, traffic density, or penetration rate for high Quality Estimation of Traffic Data quality estimation of traffic data with 95% confidence (t-test alpha=0.05) We have evaluated DTMon using ns-3 in free-flow and Traffic Density transient traffic with different market penetration rates. High Quality Message or Estimation Delivery Figure 2 shows the percentage of received messages from Penetration Conf. ≥ 95% Method Rate vehicles passing VS2 (1 km from TO1 and 3 km from TO5) using different message delivery methods in medium traffic Flow Rate and High Any flow rate (1800 vehicles/h). Density Figure 3 shows the average delay for messages received by SAC, RF Classification, the TOs from VS2. RF and DTR have delays in milliseconds. +SAC, TMS Low or Delay using SAC varies by the travel time of the segment. Travel Time, DTR+SAC More forwarding takes place using RF+SAC and DTR+SAC, or SMS Medium or which results in a lower average delay than SAC. Any High Hadi Arbabi and Michele C. Weigle {marbabi, mweigle}@cs.odu.edu http://oducs-networking.blogspot.com/ Department of Computer Science, Old Dominion University, Norfolk, VA ACM VANET, Beijing, China, September 2009