Energy management overview including:
* Gathering Data and Educating Yourself
* Identifying hat Makes Up Your Load
* Targeting Key Components for Energy Efficiency Initiatives
* Monitoring and Verifying the Results
* Raising Awareness and Changing Behaviors
1. Energy Management 101
With the continually rising cost of power in the United States, Facility Managers from
coast to coast have been looking for energy savings in all sorts of places. Whether it’s a
manufacturing plant, school or university, office complex, distribution center, or portfolio
of retail stores, the impact has been felt on bottom line profits. Across the country there
have been rate increases as high as 50-55%! We are now experiencing rates approaching
$0.20 / kWh! This continued pressure on businesses and on the economy is here to stay,
with little relief in sight.
Historically, rates have been relatively stable, but what I like to call a “perfect storm” of
circumstances has changed all that. Here are the some of the key highlights that have
befallen us just over the last few years:
Continually Increasing Demand
• In the U.S., demand has grown significantly and is projected to continue on
this trajectory for years to come.
• Based on a recent study by the National Petroleum Council, “Facing the Hard
Truths About Energy”, global energy consumption is expected to increase
50% over the next 25 years!!
• Over the last several years, many areas of this country have experienced
record-breaking high temperatures, which led to huge spikes in the demand
for HVAC and peak demand for electricity.
Interruptions in Supply-chain
• The devastation in the Gulf of Mexico due to hurricanes Katrina and Rita in
2005 had a far-reaching impact on the supply of natural gas (20% of power
produced in the U.S. is fueled by natural gas).
• There continues to be uncertainty (and volatility) around future threats of
hurricanes in the gulf.
• Escalating political instability and conflicts in many parts of the world where
oil and natural gas have traditionally come from.
• Environmental, logistical, and economic challenges associated with extracting
and transporting natural gas and coal in this country.
End of Rate Stabilization
• In many areas, electricity rates which had been held stable for as many as 10
years are now coming off this plan and are facing a return to market-based
rates. In the mid to late 1990’s temporary price controls were enacted which
protected consumers from market volatility.
• At the same time, utilities were not protected against the pressures of higher
fuel costs.
• As these price controls have expired, there have been startling rate increases
in many parts of the country (i.e., Connecticut, Maryland, and Illinois).
In this article, I am not going to delve into the global impact of the emerging markets in
China and India, or global warming, or the environmental challenges associated with the
burning of fossil fuels. But, this is not an indication that these are not important issues
which are already having an impact on our economy, our political agendas, and the safety
and stability of future generations.
2. So, under these circumstances, what is a Facility Manager to do? There is mounting
pressure on all of us to respond to the economic as well as the environmental pressures
and to come up with quick, cost-effective solutions. All of us are looking for
opportunities to minimize the risk to our organization. Where to start?!?
I’ve condensed the answer into a simple five-step approach that I hope will help you
define your mission and build the road map that can get you there.
1. Gather Data and Educate Yourself
• Know your electric bills, your load and rate structure.
• Analyze how energy is being used, baseline your facilities, and determine
where the “energy hogs” are.
• Use data to prioritize your projects to ensure the greatest payback.
Cost of
Annual Annual Annual Cost per Energy
Facility Sq Ft kWh kWh/Ft2 Expense Sq Ft $/kWh
100256 3,742 417,666 111.62 $36,722 $9.81 $0.09
100266 2,892 79,340 27.43 $6,191 $2.14 $0.08
100269 6,246 254,121 40.69 $23,975 $3.84 $0.09
100274 4,842 246,780 50.97 $38,602 $7.97 $0.16
100277 5,220 313,220 60.00 $25,169 $4.82 $0.08
100281 4,032 140,480 34.84 $11,941 $2.96 $0.09
100291 5,986 270,116 45.12 $20,194 $3.37 $0.07
100304 8,898 540,120 60.70 $33,965 $3.82 $0.06
100306 3,962 352,044 88.86 $40,093 $10.12 $0.11
Average 5,091 290,432 57.80 $26,317 $5.43 $0.09
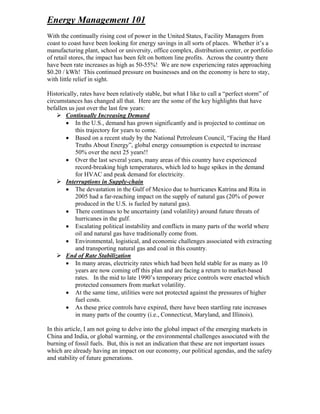
2. Identify What Makes up Your Load.
• Use utility-grade meters to gather interval data.
• Determine what percentage is lighting, HVAC, equipment, other.
Breakdown of Energy Loads
% HVAC
32%
% HVAC
% OUTLETS
% LIGHTING
% LIGHTING
63%
% OUTLETS: cash
registers, etc
5%
3. 3. Target Key Components for Energy-efficiency Initiatives.
For example:
• Lighting retrofits using new, more efficient technology.
• HVAC replacement of old inefficient units with highly-efficient units.
• Utilize variable speed drive motors.
• Don’t forget the added benefit of utility-sponsored rebates!
A Simple Look at Lighting
There are several approaches to making the lighting in your facilities more energy-
efficient. Listed here are a few key points to consider.
• Do you have lighting timers or EMS (energy management system) and are the
schedules set correctly? Is this regularly checked and adjusted for accuracy?
• Can you designate different levels of lighting for different times and functions within
your facilities (for instance, can you use lower light levels during off-peak hours when
the building is only partially occupied, and full lighting only at times of full
occupancy)?
• Are there opportunities for “daylight harvesting”, utilizing light sensors near windows
or skylights which can be used with dimmable lighting to reduce consumption?
• Are there opportunities to add occupancy sensors which automatically turn lights off
in unoccupied spaces?
• Are there alternative lighting products available which are more energy-efficient
(more lumens per watt) than the lighting in your facilities today? Lighting retrofits
can result in as much as a 30-50% reduction per socket. For example:
o Replace incandescent or halogen lamps with compact fluorescent lamps.
o Replace halogen track lighting with lower wattage ceramic metal halide.
o Improve aisle lighting in your DC by replacing HID with high output strip
fluorescent.
• Are you keeping up with energy codes, utility-sponsored rebates, EPACT tax
incentives, etc.?
• What are the new lighting technologies (i.e., LED or fiber optics) which you should be
investigating?
• Are you doing everything you can to stay current with new developments in lighting
which can save your organization money?
4. Monitor and Verify the Results
• With the use of utility-grade meters you can measure before and after loads
(see below).
• Use data to conduct a “hindsight” analysis and to ensure your projects are
providing the expected results.
4. Before After
5. Raise Awareness and Change Behaviors
• Find opportunities to communicate to all levels within the organization.
• Show how simple changes can have a big impact.
• Lead the way with energy-saving practices.
• Monitor progress, recognize and reward achievements.
These five simple steps should help you define your vision and to build a strategy that
looks out over several years (3 years, 5 years, or more). Go after the “low hanging fruit”
that has the greatest impact and will save your organization the most money. If you
haven’t done anything yet, this approach can stop some of the bleeding and save
considerable money (which goes right to the bottom line)! Do some testing and try new
products if there are opportunities which don’t have clearly defined solutions. Build your
strategy, start working on projects that show obvious results, and start getting “C-level”
support within your organization.
As a Facility Manager in these challenging times, don’t underestimate the impact you
can have on cost savings or your importance within your organization. If your
company is not managing energy and taking advantage of energy-efficient programs, then
the bottom line is being directly affected – and you can change that!
End