
Recommended
More Related Content
Featured
Featured (20)
Signs Of Recovery Blog Content
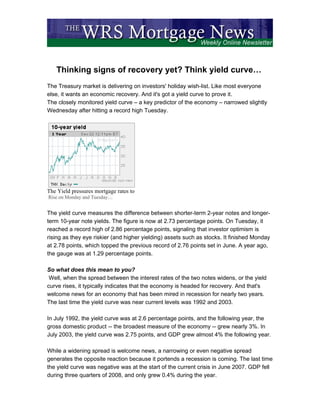
- 1. Thinking signs of recovery yet? Think yield curve… The Treasury market is delivering on investors' holiday wish-list. Like most everyone else, it wants an economic recovery. And it's got a yield curve to prove it. The closely monitored yield curve – a key predictor of the economy – narrowed slightly Wednesday after hitting a record high Tuesday. The Yield pressures mortgage rates to Rise on Monday and Tuesday… The yield curve measures the difference between shorter-term 2-year notes and longer- term 10-year note yields. The figure is now at 2.73 percentage points. On Tuesday, it reached a record high of 2.86 percentage points, signaling that investor optimism is rising as they eye riskier (and higher yielding) assets such as stocks. It finished Monday at 2.78 points, which topped the previous record of 2.76 points set in June. A year ago, the gauge was at 1.29 percentage points. So what does this mean to you? Well, when the spread between the interest rates of the two notes widens, or the yield curve rises, it typically indicates that the economy is headed for recovery. And that's welcome news for an economy that has been mired in recession for nearly two years. The last time the yield curve was near current levels was 1992 and 2003. In July 1992, the yield curve was at 2.6 percentage points, and the following year, the gross domestic product -- the broadest measure of the economy -- grew nearly 3%. In July 2003, the yield curve was 2.75 points, and GDP grew almost 4% the following year. While a widening spread is welcome news, a narrowing or even negative spread generates the opposite reaction because it portends a recession is coming. The last time the yield curve was negative was at the start of the current crisis in June 2007. GDP fell during three quarters of 2008, and only grew 0.4% during the year.
- 2. What's normal? Shorter-term notes normally carry lower interest rates to reflect the fact that investors' money is under less risk, while the market rewards investors who hold longer-term bonds with higher interest rates for putting their cash away for a greater period of time. So while it is normal for yield curves to slope upward, the steepness of the current curve varies. The historical average for the yield curve is 1.5 percentage points, and the average over the last year is 2.15 points, according to Kevin Giddis, managing director of fixed income at Morgan Keegan. "Economic growth is picking up steam," added Peter Cardillo, chief market strategist at Avalon Partners. "There's a lot of anticipation that the Fed will raise interest rates sooner than later." But Giddis said it is still too early to tell if the change in the yield curve is due to sentiment in the market or the fact that investors are adjusting their investments and winding down trading as the year ends. The Fed's role The Federal Reserve has kept its key interest rate between 0% and 0.25% since last December in an effort to stimulate the economy. While the Fed's rate keeps the 2-year note's yield within a close proximity, much of the curve's movement is being led by the 10-year note, which has seen its yield rise more than 50 basis points in the last month. The central bank reiterated last week that it will keep interest rate near 0% for the foreseeable future, but Cardillo said a fast-pace recovery will force the Fed to raise interest rates from historic lows. And with that lift, Cardillo said the yield spread would likely narrow because the yields on the 2-year note will have to catch up to what the market dictates. Investors are selling longer-term bonds with the expectation that the economy will grow and bring with it inflation, sending prices lower and yields higher. Treasury prices and yields move in opposite directions. Cardillo added that investors are taking the money they socked away in Treasurys during the turbulent period and shifting it to the higher-yielding stocks on recovery hopes. Stocks advanced Tuesday after an industry report showed that the sales of existing homes rose 7.4% in November to an annual rate of 6.54 million unites, beating analysts' estimates. The gain came despite government data that showed economic activity in the third quarter was weaker than previously expected. The holiday-shortened week has resulted in thinner trading volumes for the stock and bond markets.