OECD’s PISA Study - Share of Rents from National Resources in National Income
•
0 recomendaciones•218 vistas

OECD’s PISA study Share of rents from national resources in national income and student performance Knowledge and skills are infinite – oil is not

Recomendados
Más contenido relacionado
Similar a OECD’s PISA Study - Share of Rents from National Resources in National Income
Similar a OECD’s PISA Study - Share of Rents from National Resources in National Income (20)
Más de No to mining in Palawan
Más de No to mining in Palawan (20)
Último
Último (20)
OECD’s PISA Study - Share of Rents from National Resources in National Income
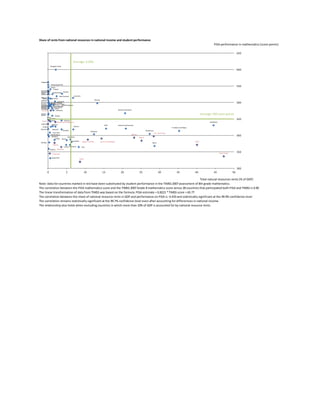
- 1. Share of rents from national resources in national income and student performance PISA performance in mathematics (score points) 650 Average: 6.02% Shanghai-China 600 Singapore Hong Kong-China Korea 550 Finland Liechtenstein Switzerland Japan Netherlands Canada Macao-China New Zealand Australia Belgium Germany Estonia Iceland Norway Denmark Slovenia Austria Slovak Republic France 500 Hungary SwedenPoland United Kingdom Luxembourg Czech Republic Ireland United States Portugal Latvia SpainItaly Armenia Lithuania Russian Federation Greece Malta Croatia Average: 450 score points Israel Turkey Serbia Ukraine 450 Cyprus Bosnia and Herzegovina Azerbaijan Lebanon Bulgaria Chile United Arab Emirates Uruguay Mexico Trinidad and Tobago Mauritius Romania Thailand Kazakhstan Malaysia Costa Rica Iran, Islamic Rep. Montenegro Bahrain Moldova Argentina 400 Algeria Jordan Brazil Colombia Egypt, Arab Rep. Syrian Arab Republic Oman Georgia Qatar Albania Tunisia Indonesia Peru Panama Botswana Saudi Arabia 350 El Salvador Kyrgyzstan Ghana 300 0 5 10 15 20 25 30 35 40 45 50 Total natural resources rents (% of GDP) Note: Data for countries marked in red have been substituted by student performance in the TIMSS 2007 assessment of 8th grade mathematics. The correlation between the PISA mathematics score and the TIMSS 2007 Grade 8 mathematics score across 28 countries that participated both PISA and TIMSS is 0.90 The linear transformation of data from TIMSS was based on the formula: PISA estimate = 0.8221 * TIMSS score + 65.77 The correlation between the share of national resource rents in GDP and performance on PISA is -0.433 and statistically significant at the 99.9% confidence level The correlation remains statistically significant at the 99.7% confidence level even after accounting for differernces in national income. The relationship also holds when excluding countries in which more than 10% of GDP is accounted for by national resource rents.