1. FE341: Microeconomics
Homework 1
Due August 30th
ANSWER KEY
Please indicate the students that you worked on this homework assignment with, if any.
1. From the textbook page 18: Questions for Review #2
Which of the following two statements involves positive economic analysis and which
normative? How do the two kinds of analysis differ?
a. Gasoline rationing (allocating to each individual a maximum amount of gasoline that can
be purchased each year) is poor social policy because it interferes with the workings of
the competitive market system.
Positive economic analysis describes what is. Normative economics describes what ought
to be. Statement (a) merges both types of analysis. First, statement (a) makes a positive
statement that “rationing interferes with the workings of the competitive market
system.”We know from economic analysis that a constraint placed on supply will
change the market equilibrium. Second, statement (a) makes the normative statement
that gasoline rationing “is poor social policy.”
b. Gasoline rationing is a policy under which more people are made worse off than are
made better off.
Statement (b) is positive because it states what the effect of gasoline rationing is without
making a value judgment about the desirability of the rationing policy.
2. From the textbook page 18: Questions for Review #6
The price of long-distance telephone service fell from 40 cents per minute in 1996 to 22 cents
per minute in 1999, a 45-percent (18 cents/40 cents) decrease. The CPI increased by 10
percent over this period. What happened to the real price of telephone service?
Let the CPI equal 1 for 1996 and the CIP for 1999 equal 1.1 (a 10% increase). To find
the real price of telephone service in each period, divide the nominal price by the CPI
for that year. For 1996, we have 40/1 = 40 cents. For 1999, we have 22/1.1 or 20 cents.
The real price therefore fell from 40 cents to 20 cents, a 50% decline.
3. From the textbook page 57: Questions for Review #2
Use supply and demand curves to illustrate how each of the following events would affect the
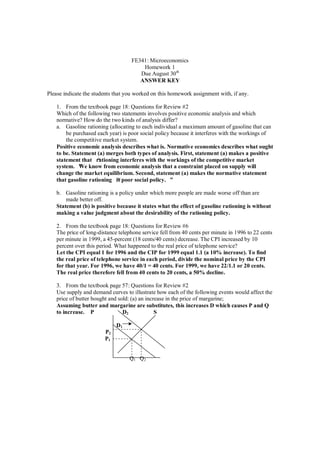
price of butter bought and sold: (a) an increase in the price of margarine;
Assuming butter and margarine are substitutes, this increases D which causes P and Q
to increase. P D2 S
D1
P2
P1
Q1 Q2
2. (b) an increase in the price of milk;
Assuming milk is the main ingredient in butter the cost of producing butter will
increase, this decreases S which causes P to increase and Q to decrease.
P S2 S1
D
P2
P1
Q2 Q1
NOTE: butter is actually made from the fat skimmed off the milk, so they are really
complements in production. If you noted this relationship, then as the price of milk
increases, so will the quantity of milk supplied, which will lead to more butter being
produced (an increase in supply). This will cause S to increase, P to fall and Q to
increase.
(c) a decrease in average income levels.
As average income levels fall, assuming butter is a normal good, this decreases D which
causes P and Q to decrease.
P D1 S
D2
P1
P2
Q2 Q1
4. From the textbook page 58: Questions for Review #7
Are the following statements true or false? Explain your answers.
a. The elasticity of demand is the same as the slope of the demand curve.
False –Elasticity of demand is the percentage change in quantity demanded for a given
percentage change in the price of the product. The slope of the demand curve is the
change in price for a given change in quantity demanded, measured in units of output.
Though similar in definition, the units for each measure are different.
b. The cross-price elasticity will always be positive.
False. The cross-price elasticity measures the percentage change in the quantity
demanded of one product for a given percentage change in the price of another product.
This elasticity will be positive for substitutes (an increase in the price of hot dogs is
likely to cause an increase in the quantity demanded of hamburgers) and negative for
complements (an increase in the price of hot dogs is likely to cause a decrease in the
quantity demanded of hot dog buns)).
c. The supply of apartments is more inelastic in the short run than in the long run.
True. In the short run it is difficulty to change the supply of apartments in response to a
change in price. Increasing the supply requires constructing new apartment buildings,
which can take a year or two more. Since apartments are a durable good, in the long
3. run a change in price will induce suppliers to create more apartments (if price
increases) or delay constructions (if price decreases).
5. From the textbook page 59: Exercises #6
The rent control agency of New York City has found that aggregate demand is
PQD 8160-= . Quantity is measured in tens of thousands of apartments. Price, the average
monthly rental rate, is measured in hundreds of dollars. The agency also noted that the
increase in Q at lower P results from more three-person families coming into the city from
Long Island and demanding apartments. The city’s board of realtors acknowledges that this is
a good demand estimate and has shown that supply is PQS 770 += .
a. If both the agency and the board are right about demand and supply, what is the free-
market price? What is the change in city population if the agency sets a maximum
average monthly rent of $300 and all those who cannot find an apartment leave the city?
To find the free equilibrium price, set supply equal to demand:
PQD 8160 -= = PQS 770 += à 600$=P (price is in hundreds of dollars).
Substituting into either supply or demand 1126*8160 =-=DQ , we see that 1,120,000
apartments are rented. If the rent control sets the maximum rental rate at $300, the
quantity supplied of apartments is given by 000,9103*770 =+=SQ , a decrease of
210,000 apartments from the free market equilibrium. At the rental rate of $300, the
quantity demanded of apartments is given by 000,360,13*8160 =-=DQ .
The population will fall by 630,000 (the 210,000 fewer available apartments times the 3
people who occupy each apartment).
b. Suppose the agency bows to the wishes of the board and sets a rental of $900 per month
on all apartments to allow landlords a “fair”rate of return. If 50 percent of any long-run
increases in apartment offerings comes from new construction, how many apartments are
constructed?
At a rental rate of $900, the supply of apartments would be 70 + 7*9 = 1,330,000 units,
which is an increase of 210,000 units over the free market equilibrium. Therefore, 50%o
of 210,000 = 105,000 units would be constructed. However, demand at $900 is only
880,000 units (160 –8*9), so 450,000 units will not be rented.
6. From the textbook page 59: Exercises #7
In 1998, Americans smoked 470 billion cigarettes, or 23.5 billion packs of cigarettes. The
average retail price was $2 per pack. Statistical studies have shown that the price elasticity of
demand is -0.4, and the price elasticity of supply is 0.5. Using this information, derive linear
demand and supply curves for the cigarette market.
Let the demand curve be of the general form Q = a –bP and the supply curve be
of the general form Q = c + dP, where a, b, c and d are the constants you have to
find from the information given.
Recall:
P
Q
Q
P
ED
P
D
D
= . You are given the D
PE , and the P and the Q, which means you
can solve for the slope (b in the general equation).
P
Q
D
D
=-
5.23
2
4.0 à 7.4-==
D
D
b
P
Q
.
4. To find the constant a, substitute for Q, P, and b into the formula Q = a –bP =
23.5 = a –4.7*2 à a = 32.9. Therefore, the demand equation is given by:
PQD 7.49.32 -=
Recall:
P
Q
Q
P
ES
P
D
D
= . You are given the S
PE , and the P and the Q, which means you can
solve for the slope (d in the general equation).
P
Q
D
D
=
5.23
2
5.0 à 875.5==
D
D
b
P
Q
. To
find the constant c, substitute for Q, P, and d into the formula Q = c + dP = 23.5
= c + 5.875*2 à c = 11.75. Therefore, the supply equation is given by:
PQs 875.575.11 +=