Charting the learning tracks
•
9 recomendaciones•1,920 vistas

Second part of the talk on the "Shape(s) of Educational Data" delivered at the meeting SOED, April 7-8, 2016 in Fairfax (VA).

Recomendados
Más contenido relacionado
Destacado
Destacado (13)
Más de Olga Caprotti
Más de Olga Caprotti (19)
Último
Último (20)
Charting the learning tracks
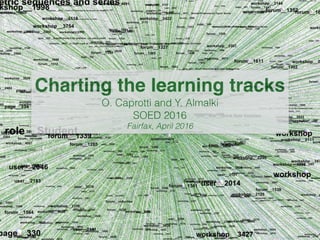
- 1. Charting the learning tracks O. Caprotti and Y. Almalki SOED 2016 Fairfax, April 2016
- 2. %%% quiz__550__Integration for practice - no extra credit quiz__549__Quiz 1: Recalling Integration quiz__603__Mathematics Diagnostic Test quiz__551__Quiz 2: Substitutions workshop__332__Workshop 1 (2 pgs) quiz__553__Quiz 3: Improper Integrals I workshop__332__TimothyBrownWorkshop1 workshop__332__Workshop 1, Will McCall workshop__332__Workshop 1 workshop__332__workshop 1workshop__332__Workshop 1: Integration By Substitution workshop__332__Workshop 1: Integration by Substitution workshop__333__Workshop 2 by Amanda Taft quiz__554__Quiz 4: Improper Integrals II workshop__333__Workshop 2 workshop__333__Workshop#2 Kevin Matheus workshop__334__Workshop 3 quiz__555__Quiz 5: Integration Practice workshop__334__workshop 3 workshop__334__Workshop 3-Christina Dadich workshop__335__Workshop 4 Amanda Taft workshop__335__workshop 4 workshop__335__Workshop 4 workshop__335__Workshop 4 GHS workshop__335__TimothyBrownhwk4 quiz__552__Substitutions II for practice - no extra credit quiz__625__Quick Quiz Areas quiz__629__Quick Quiz Volumes workshop__336__Workshop 5 Amanda Taft workshop__336__Workshop5 workshop__336__Workshop 5 workshop__336__Workshop Five--Christina Dadich workshop__337__Workshop 6 Amanda Taft workshop__337__Workshop 7 workshop__337__Workshop 6 workshop__337__workshop 6 workshop__337__Workshop 6: Sequences I workshop__338__Workshop 7 Amanda Taft quiz__671__Quiz 7: Geometric sequences and series workshop__338__27 like a champ workshop__338__Workshop 7workshop__338__workshop 7 workshop__338__Worksop 7 workshop__339__Workshop 8 Amanda Taft workshop__339__workshop 8 workshop__339__Workshop 8 workshop__339__WS8 (Rylan Caskey) workshop__339__Caroline Walker Workshop 8 workshop__340__Workshop 9 Amanda Taft workshop__340__WS9 (Rylan Caskey) workshop__340__Workshop 9 workshop__340__Woooooorkkkkkshooopp workshop__340__workshop 9 workshop__342__AmandaTaft Workshop11 workshop__343__AmandaTaftWorkshop12 workshop__343__Workshop12 workshop__343__workshop12workshop__343__WORKSHOP 12 workshop__343__Workshop 12workshop__343__Workshop #12 workshop__344__Workshop 13 workshop__344__Workshop 13 by Andrew Colangelo workshop__344__ws13 workshop__344__Ws13 workshop__332__Workshop #1 Emily Hebert workshop__332__Workshop 1 - Luis Vega workshop__332__Christopher Hartman Workshop #1 workshop__332__Workshop 2 workshop__332__1-4 Workshop 1 workshop__333__Workshop #2 Emily Hebert workshop__333__Workshop #2 workshop__333__workshop #2 workshop__333__Integration Workshop 2 workshop__333__Workshop 2 GHS workshop__334__Workshop 3 Emily Hebert workshop__334__kameron Martinez workshop__334__Workshop 3: Rylan Caskeyworkshop__334__kevin schaeffer workshop__335__Workshop #4 Emily Hebert workshop__335__Workshop #4 workshop__336__Workshop #5 quiz__626__Integration Practice - no extra credit quiz__557__Quiz 6: Sequences and Limits of Sequences workshop__337__Workshop #6 workshop__337__Work Shop 6 workshop__337__Workshop 6 problems 1-5 workshop__338__Workshop #7 workshop__338__Workshop 7: Sequences 2 workshop__338__Michael Mann workshop__338__ws 7 workshop__340__Workshop #9workshop__340__Workshop 9: Integral Test workshop__340__Workshop Nine-Christina Dadich workshop__341__Workshop 10 workshop__341__workshop 10 workshop__341__Workshop 10: Comparison Test workshop__341__Workshop 10 GHS workshop__342__Workshop 11 workshop__343__Michael Mann workshop__344__workshop 13 workshop__344__TimBrown Final hwk workshop__344__Caroline Walker Workshop 13 workshop__344__Workshop Thirteen--Christina Dadich workshop__344__FINAL WS workshop__332__John Pacheco - Workshop 1 workshop__332__Kameron Martinez WS #1 workshop__333__Workshop 2 problems workshop__333__Dem answers workshop__334__WS4 workshop__335__WorkShop 4 workshop__335__Workshop 4 Alex Hollen workshop__335__Workshop III workshop__338__Workshop7KathrynFreesmeier workshop__338__Workshop workshop__338__workshop7 workshop__338__glhf workshop__339__Workshop 8 by Andrew Colangelo workshop__340__Workshop 9 Kathryn workshop__340__Blah Blah workshop__340__Workshop 8 Kenneth Carril workshop__340__Ricardo Castilla_WS9 workshop__341__Workshop 10 Kathrynworkshop__341__10 workshop__332__Workshop 1 - Tyler Harris workshop__332__Palmer_Workshop1 workshop__332__Workshop1 workshop__334__Workshop 3 - Tyler Harris workshop__334__workshop 3 Ben Rooks workshop__334__Submission workshop__335__Workshop 4 - Tyler Harris workshop__336__Workshop 5 - Tyler Harris workshop__336__workshop 5 workshop__336__easiest workshop yet workshop__337__Workshop 6 - Tyler Harris workshop__337__WS6 workshop__337__Evans workshop 6 workshop__337__Workshop Six--Christina Dadich workshop__338__Workshop 7 - Tyler Harris workshop__340__Workshop 9 - Tyler Harris workshop__340__Mauriello WS 9 workshop__340__TimothyBrown.WKSP9 workshop__340__Workshop 9 #1-4 workshop__341__Workshop 10 - Tyler Harris workshop__341__Tim Brown wrk10 workshop__341__ws 10 workshop__341__Heyo workshop__341__ws10 workshop__342__Workshop 11 - Tyler Harris workshop__342__Workshop workshop__342__workshop workshop__342__Mauriello WS 11 workshop__342__workshopssssss workshop__342__11 workshop__343__Workshop 12 - Tyler Harris workshop__343__Ws workshop__344__Workshop 13 - Tyler Harris workshop__332__Work Shop 1 workshop__332__Workshop 1 written problems workshop__332__Worshop 1 workshop__332__Casey Rowe Workshop 1 workshop__333__2 workshop__333__Brandon Mauriello Workshop 2 workshop__333__Workshop 2: Integration Techniques I workshop__334__Workshop 3: Armageddon workshop__335__workshop 4 sillick workshop__335__Workshop4 workshop__336__Work shop 5 workshop__336__Work Shop 5 workshop__336__wksp5 workshop__336__Sarduy Workshop 5 workshop__336__Workshop workshop__338__Work Shop 7 workshop__338__ws7 workshop__338__WS7 workshop__338__Workshop7 workshop__339__Facts workshop__339__8 workshop__340__9 workshop__340__John Pacheco's Workshop 9workshop__340__Worskshop 9 workshop__341__Work shop 10 workshop__341__Work Shop 10 workshop__341__WS 10 workshop__341__Ws 10 workshop__343__Egads workshop__344__Final Workshop workshop__344__The Last One workshop__332__Workshop #1 workshop__332__Workshop 1 Problems workshop__332__Solutions workshop__332__Workshop One workshop__333__Connor Grace WS2 workshop__334__Workshop tres workshop__334__Workshop 3 by Andrew Colangelo workshop__335__Workshop 4 by Andrew Colangelo workshop__336__workshop #5 workshop__336__COWA workshop__338__Hunter Hayden WS 7workshop__338__Return of the Calculus: Last Light workshop__338__Caroline Walker Workshop 7 workshop__340__work shop problems workshop__340__Workshop9 workshop__341__Workshop 10 Antoine Mercidieu workshop__341__Workshop #10 workshop__342__Worksop 11 workshop__342__workshop 11 GHS workshop__342__W11 workshop__342__workshop 11 workshop__343__Workshop 11 workshop__343__Workshop 12 - Tyler O'Ferrell workshop__344__Last workshop workshop__344__last workshop workshop__344__error workshop__344__Workshop13 workshop__332__Hunter Hayden Workshop 1 Solutions workshop__332__Late(sorry) workshop__333__Workshop 2: Hunter Hayden workshop__333__IrmaLeandre_Workshop2 workshop__334__Workshop3_KevinMatheus workshop__334__ws 3 workshop__335__Exaltations Valiant Grader workshop__336__5 workshop__336__Caroline Walker Workshop 5 workshop__337__WorkShop 6workshop__337__W6 workshop__338__Workshop #6 workshop__339__Workshop8 workshop__339__Workshop 8 - Tyler O'Ferrell workshop__340__kevin schaeffer workshop__342__Workshop11 workshop__342__WS 11 workshop__342__ws 11 workshop__344__13 workshop__344__Workshop 13 Taylor Series workshop__332__Workshop 1 (I. Leandre) workshop__332__Evans, Kyle Workshop 1 workshop__332__Ricardo_Castilla-Workshop1 workshop__334__Workshop3 workshop__335__Mauriello Workshop 4 workshop__335__ws4 workshop__335__Luis Vega Workshop 4 workshop__338__Philip Wiezorek workshop__338__Workshop 7: Tyler O'Ferrell workshop__339__Ricardo Castilla_Workshop8 workshop__340__w9 workshop__342__kevin schaeffer workshop__343__Mauriello Workshop 12 workshop__343__Workshop Twelve--Christina Dadich workshop__344__Wkshp13 workshop__332__Workshop 1: Integration by Substitution Melissa Palomaworkshop__332__Workshop1- Integration - Brittaney Pratt workshop__333__MICHAEL MANN workshop__333__workshop 2 workshop__335__Connor Grace WS4 workshop__336__Workshop 5: Applications of Integration workshop__337__Workshop Six workshop__337__Ricardo Castilla Workshop 6 workshop__339__Michael Mann workshop__340__Praise ease workshop__341__WS10 workshop__341__Workshop 10: The Comparison Test workshop__342__WKSP 11 workshop__342__Workshop Eleven--Christina Dadich workshop__344__WS13 workshop__344__Workshop 13 Antoine Mercidieu workshop__332__Caroline Walker_Section 5_Workshop 1 workshop__332__Workshop 1 calculations workshop__333__Caroline Walker_Workshop 2 workshop__333__WS #2 workshop__334__Caroline Walker Workshop 3 workshop__334__#4 workshop__335__Caroline Walker Workshop 4 workshop__335__Workshop 4: Improper Integrals workshop__336__ws5 workshop__336__Workshop Fiveworkshop__336__Workshop 5 Applications of Integration workshop__337__Caroline Walker Workshop 6 workshop__338__WS7 (Rylan Caskey) workshop__338__Workshop 7 by Andrew Colangelo workshop__338__num 4 workshop__339__Connor Grace WS8 workshop__340__Caroline Walker Workshop 9 workshop__340__Workshop Nein Nein Nein workshop__340__ws9 workshop__341__Caroline Walker Workshop 10 workshop__341__Ricardo Castilla_WS10 workshop__342__Caroline Walker Workshop 11 workshop__342__Ws11 workshop__342__wk workshop__343__Caroline Walker Workshop 12 workshop__343__It's the most workshopful time of the year workshop__343__Workshop 12: Power Series workshop__344__Workshop 13: Taylor Series workshop__332__Sebastian A. Bellini Workshop 1 workshop__333__Kameron Martinez ws 2 workshop__334__Connor Grace WS 3 workshop__335__Ricardo_Castilla_Workshop4 workshop__336__The solutionsss workshop__338__Connor Grace WS7 workshop__339__WS 8 Alex Hollen workshop__340__Workshop 9 Antoine Mercidieu workshop__340__The answers workshop__341__Workshop Ten--Christina Dadich workshop__342__11.11.11 workshop__343__Ws12 workshop__343__ws12 workshop__343__WS12 workshop__343__ws 12 workshop__344__Workshop #13 workshop__332__Workshop #1 - Tyler O'Ferrell workshop__333__Tyler O'Ferrell - Workshop 2 workshop__334__Workshop #3 - Tyler O'Ferrell workshop__334__1,3,4 workshop__334__Mauriello workshop 3 workshop__335__Workshop 4 - Tyler O'Ferrell workshop__335__WS4 workshop__336__Workshop 5 - Tyler O'Ferrell workshop__336__kevin schaeffer workshop__337__Workshop 6 - Tyler O'Ferrell rkshop__337__Workshop 6: Sequences 1 workshop__337__Workshop Sex workshop__338__Ricardo Castilla_Workshop 7 workshop__338__WS7 Alex Hollen workshop__338__Workshop 7: Kimmey Palmer workshop__340__Tyler O'Ferrell - Workshop 9 workshop__340__ws 9 workshop__341__Workshop 10 - Tyler O'Ferrell workshop__341__Zein workshop__342__Workshop 11 - Tyler O'Ferrell workshop__343__workshop workshop__344__Tyler O'Ferrell - Workshop 13 workshop__344__workshop13 workshop__332__Mauriello Workshop 1 workshop__332__Workshop 1 Antoine Mercidieu workshop__333__submission workshop__334__Workshop 3 - Sophia Sobrito workshop__334__TimothyBrown.workshop3 workshop__335__Workshop 4 Submission workshop__335__Workshop Four- Christina Dadich workshop__335__ws 4 workshop__337__Brandon Mauriello Workshop 2 workshop__338__Mauriello Workshop 7 workshop__339__Mauriello workshop 8workshop__339__John Pacheco Workshop 8 workshop__340__Workshop workshop__340__WS 9 workshop__341__Mauriello WS 10 workshop__342__Ricardo Castilla workshop__344__Mauriello Workshop 13 workshop__344__ws 13 workshop__344__Michael Mann workshop__332__Workshop 1 GHS workshop__332__Sarduy_P_WS1 workshop__333__Workshop 2 - Luis Vega workshop__334__3 workshop__335__Workshop IV workshop__336__Workshop 5 GHS workshop__336__Boop workshop__340__Workshop 9 GHS workshop__341__Workshop 10 by Andrew Colangelo workshop__343__Workshop 12 GHS workshop__343__wrkshup 12 workshop__344__ws workshop__332__William Smith workshop__332__Workshop workshop__333__Workshop'n workshop__341__w56 workshop__342__Workshop 1 workshop__342__Hunter Hayden WS 11 workshop__343__wk workshop__332__Philip Wiezorek Workshop 1 workshop__332__Workshop 1 - Lindsay Hoop workshop__333__workshop2 workshop__334__Workshop #3 workshop__334__WORKSHOP 3 workshop__335__#4 workshop__337__Workshop workshop__338__7workshop__338__Joel Marti Workshop 7 workshop__338__Funtiemworkshop__338__kevin schaeffer workshop__339__Workshop workshop__339__Workshop Infinity workshop__340__Workshop Nine workshop__341__Workshop workshop__341__John Pacheco's Workshop 10 workshop__341__1-4 workshop__333__Workshop2-Ricardo Castilla workshop__334__Workshop 3: Integration Techniques II workshop__334__workshop workshop__335__kevin schaeffer workshop__336__AHollen WS 5 workshop__337__5 workshop__337__kevin schaeffer workshop__332__JSA WS1 Hell workshop__332__Rafael Mendoza workshop__333__Workshop 2 Sillick workshop__333__Zachary Moore Workshop 2 workshop__336__Workshop V workshop__337__Workshop 6 by Andrew Colangelo workshop__342__Kameron Martinez workshop__344__WS 13 workshop__334__WS3 #swag workshop__335__hi workshop__336__Rylan Caskey: WS5 workshop__339__Workshop 8: Introduction to Seriesworkshop__339__Work Shop 8 workshop__342__Workshop 11: Ratio and Root Test workshop__342__Workshop 11 Ratio and Root workshop__333__Workshop 2 Integration Techniques workshop__334__Workshop #3 Integration Techniques II workshop__337__Workshop 6 Sequences workshop__337__Worlshop 6 workshop__338__Workshop Seven workshop__338__Work shop 7 workshop__340__Workshop 9 Integral Test workshop__341__Workshop 10 Comparison Thereom workshop__343__Workshop 12 Power Series workshop__343__Bobbakanoosh workshop__343__John Pacheco's Workshop 12 workshop__332__Workshop 1 Zachary Moore workshop__333__Workshop 2, Sophia Sobrito workshop__333__kevin schaeffer workshop__335__Workshop 4 problems 1-4 workshop__336__Connor Grace WS5 workshop__338__Workshop Seven--Christina Dadich workshop__341__workshop10 workshop__341__Workshop10 workshop__342__Workshop 11 Antoine Mercidieuworkshop__343__Workshop workshop__344__Workshop Thirteen workshop__332__Grant Garavaglia Workshop 1 workshop__332__#1 workshop__338__Michael Scheer answers workshop__343__workshop 12 workshop__343__workshop #12 workshop__344__Workshop 13 Last One! workshop__344__The unluckiest workshop workshop__333__-----------Cow workshop__333__Evans Workshop 2 workshop__333__workshoppin workshop__333__Ventrella Workshop 2 workshop__335__Hello Clarice Workshop 1workshop__335__Workshop 4 - Kimmey Palmer workshop__337__Malik Ivey workshop__338__Hashtag Twerk Team workshop__338__Workshop 7! workshop__338__Workshop 7 John Pacheco workshop__342__Wu Tang Clan ain't nothin to bump with workshop__344__Ya momma workshop__332__Ben Rooks Workshop1 workshop__332__Workshop 1 - Sophia Sobrito workshop__334__Work Shop 3 workshop__334__Workshop3_Ricardo Castilla workshop__337__Workshop6 workshop__340__meow? workshop__342__wksp 11 workshop__332__Workshop 1 problems 1-4 workshop__332__Kenneth Carril Workshop 1 workshop__334__Work shop 3 workshop__335__Workshop 3 workshop__336__Hunter Hayden WS5 Submission workshop__336__Kameron Martinez wkshp 5 workshop__339__Workshop 8 - Jorgensen workshop__341__wrkshp 10 workshop__332__Workshop 1 Problems 1-4 workshop__334__Workshop 3. Problems 1-4 workshop__336__Workshop5 by Andrew Colangelo workshop__338__sorry about the mess workshop__332__Workshop 1 Solutions workshop__336__worshop 5workshop__336__Workshop 5 Sillick workshop__339__Workshop Eight: Christina Dadich workshop__339__stefan ollestad workshop__339__kevin schaeffer workshop__332__Submission 1 workshop__333__Work Shop 2 workshop__335__Rylan Caskey Workshop 4 workshop__337__WS 6workshop__337__ws 6 workshop__338__W7 workshop__339__workshop 7 workshop__344__kevin schaeffer workshop__332__WS1 workshop__333__Workshop 2 Submission workshop__335__Workshop 4 submission workshop__335__Workshop Four workshop__339__WS 8 workshop__337__ws6 workshop__343__kevin schaeffer workshop__343__Workshop 12 Antoine Mercidieu workshop__332__Workshop 1--Integration by Substitution. Christina Dadich workshop__334__shopIII workshop__336__Workshop 5 (Justin Morales) workshop__333__Workshop 2 problems 1,2,3,5 workshop__334__Workshop 3 Answers workshop__336__Workshop 5 Kenneth Carril workshop__337__WS6 (Rylan Caskey) workshop__339__Workshop #8 workshop__340__Hunter Hayden WS9 workshop__343__Hunter Hayden WS 12 workshop__332__Workshop 1 Shawn Stone rkshop__337__Workshop 6 (Justin Morales) workshop__341__kevin schaeffer workshop__343__work shippy shop 12 workshop__343__WS 12 workshop__333__John Pacheco's Workshop 2 workshop__334__Workshop Three workshop__335__Michael Mann workshop__342__Workshop 11 Ratio and Root Tests workshop__343__workshop 12 by Andrew Colangelo workshop__334__workshop 3: Integration techniques II workshop__334__Michael Mann workshop__337__dwawd workshop__337__WS 6 Hunter Hayden workshop__332__Ventrella Workshop 1 workshop__338__Workshop 7 (Justin Morales) workshop__344__Workshop Last workshop__333__Kenneth Carril Workshop 2 workshop__339__Workshop 8 (Justin Morales) workshop__332__Alex Hollen Workshop 1 workshop__332__Workshop 1 submit workshop__340__Workshop 9 by Andrew Colangelo workshop__340__Michael Mann workshop__342__Workshop 11: Ratio and Root Tests workshop__332__workshop 1 Lindsey Roberts workshop__332__Workshop 1 (p1-p4) workshop__334__WorkShop3Solutions workshop__335__kameron Martinez workshop__339__Kenneth Carril Workshop 8 workshop__339__w8 workshop__343__12 workshop__332__Workshop 1 GAlvarez workshop__332__Workshop 1: Rylan Caskey workshop__334__WS3 workshop__335__WORKSHOP 4 workshop__337__6 workshop__342__workshop 10+1 workshop__344__last workshop!!!!!!!!!!!! workshop__333__WS II workshop__334__ws3workshop__335__MISSION SUCCESS workshop__337__Workshop 5 workshop__338__workshop workshop__341__ws workshop__343__ws workshop__338__WorkShop 7 workshop__344__John Pacheco's Workshop 13 workshop__333__Workshop Two workshop__334__Zachary Moore Workshop 3 workshop__339__TimothyBrownhwk8 workshop__339__All solutions workshop__339__Worshop 8 workshop__342__workshop #11 workshop__342__WS11 (Rylan Caskey) workshop__336__Michael Mann workshop__339__workshop workshop__334__Tyndall WS 3 workshop__334__Hunter Hayden: Workshop 3 workshop__340__Kameron Martinez workshop__344__RicardoCastilla_WS13 workshop__334__Workshop III workshop__336__John Pacheco's Workshop 5 workshop__336__Adios workshop__341__w10 workshop__333__lindsey roberts ws 2 workshop__333__Viktor Dominguez workshop__344__12 workshop__344__Hunter Hayden WS 13 workshop__340__Workshop 8 workshop__338__Tim_Brown_HWK7 workshop__341__Workshop 10 "Comparison Test" workshop__342__Workshop 11 by Andrew Colangelo workshop__337__Michael Mann workshop__343__12 workshopers workshopping workshop__340__Work Shop 9 workshop__337__hwk6 workshop__341__HereDeyAree workshop__335__Hunter Hayden W4 Submission workshop__341__Hunter Hayden WS10 workshop__343__theJourney workshop__338__Kameron Martinez workshop__341__10workshop Riemann graphs 2
- 3. Course 230 chain Based on how students complete graded activities, we can compute the course Markov Chain which shows clearly how most student follow the course sequentially. 3
- 4. green track: sequential, nothing missed blue track: skipped one red track: skipped two (more than two in yellow) Student participation map START 2..08 2..14 2..15 3..19 4..23 6..34 7..38 8..40 9..43 12..57 13..60 123 16 4 1 1 2 2 2 2 11..5210..48 28 76 0 35 70 105 140 2..08 2..14 2..15 3..19 4..23 6..34 7..38 8..40 9..43 10..48 11..52 12..57 13..60 END 16 2 61 2111 4 63 1 2332 6 9 17 2 9 9121511 911 64 77 66 77 90 81847882 9095 105 123 as soon as skipping is feasible, skipping appears
- 5. WS8 in detail 5 A 3D surface model can already be constructed
- 6. Resources clicked 6 roughly a 3 color scheme: blues for lookback green for in-session yellows for lookahead
- 7. Sequences states 00_pa329 00_re4799 02_pa333 02_pa335 02_wo9314 03_wo9319 04_qu9841 05_qu9324 07_re4802 09_re4803 10_wo9348 11_ur1302 11_wo9352 12_wo9357 13_wo9360 14_re4812 00_re4798 00_re4799 02_pa333 02_pa335 02_wo9314 02_wo9315 03_qu9318 09_re4803 10_re4805 11_wo9352 12_wo9357 13_wo9360 14_re5047 00_re4798 02_wo9315 03_qu9318 04_qu9841 05_qu9324 05_re5049 14_re5047 Students on different tracks to WS8 never consulted:
- 8. Sequences to WS8 8 What can we say about lookbacks? Gabadinho, A., Ritschard, G., Müller, N.S. & Studer, M. (2011), Analyzing and visualizing state sequences in R with TraMineR, Journal of Statistical Software. Vol. 40(4), pp. 1-37.
- 9. Diligent students Looking locally does not really tell us how diligent a student is over the whole course. We only know that the red track will detract at least 2 points and the blue track will detract 1. 9
- 10. Tracks of diligence per target 10 0 35 70 105 140 2..08 2..14 2..15 3..19 4..23 6..34 7..38 8..40 9..43 10..48 11..52 12..57 13..60 END 32 32 32 32 32 32 32 32 32 32 32 3232 32 21 17 20 20 16 20 20 19 20 18 20 2021 21 20 10 17 15 14 20 18 16 19 15 19 19 18 20 16 11 12119 14 12 12 12 11 12 1414 16 5 2 4 2 4 4 4 4 3 355 5 8 5 425 5 3 8 4 5 555 8 8 1 32 452 5 4 5657 7 4 22121 2124 2 1 4 1 111 1 1 1 11 1 1 2 121 2 2 11 2 4 4 16 1 2 3 4 5 6 7 8 9 10 11 12 13 14
- 11. Diligence and gaps The means of the loopback degrees for each student, in each target activity are generally lower for diligent students: they show less gaps in their retention. 11 More generally, study which activities require the most recall
- 12. 12
- 13. Chronograms for paths to W8 13 The percentage of students in a certain state at a certain time Students are starting to look ahead
- 14. Chronograms by freq on WS7-WS8 14
- 15. Chronograms by freq on WS4,WS6-WS7 15
- 16. Vision Charting the tracks of the students, traced according to some property, on a Riemann surface so that we can help them navigate in their learning flow. 16
- 17. Digital student health check 17 order position 2 4 6 8 10 12 14 16 18 20 forum page quiz resource url workshop ● ● ● ● ● ● ● ● ● ● ● ● ● ● ● ● ● ● Student 2034 order position 2 4 6 8 10 12 14 16 18 20 forum page quiz resource url workshop ● ● ● ● ● ● ● ● ● ● ● ● ● ● ● ● ● ● ● ● ● ● ● Student 2036 order position 6 7 8 9 11 13 15 17 19 21 forum page quiz resource url workshop ● ● ● ● ● ● ● ● ● ● ● ● ● Student 2037 order position 9 10 11 12 13 14 15 16 17 18 forum page quiz resource url workshop ● ● ● ● ● ● ● Student 2039 order position 5 6 7 8 9 11 13 15 17 19 21 forum page quiz resource url workshop ● ● ● ● ● ● ● ● ● ● ● ● ● ● ● ● ● ● ● ● ● ● Student 2040 order position 6 7 8 9 11 13 15 17 19 21 forum page quiz resource url workshop ● ● ● ● ● ● ● ● ● ● ● ● ● ● ● ● Student 2041
- 18. 18