Pitney Bowes Paketversand-Index
•
0 recomendaciones•292 vistas

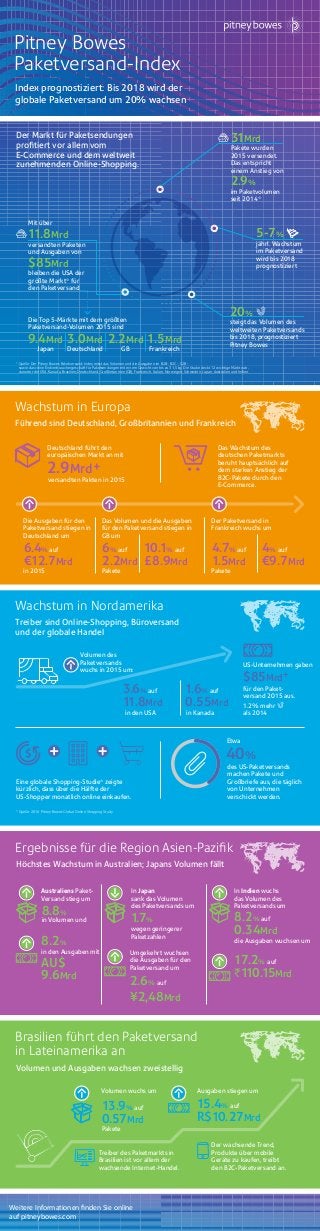
Index prognostiziert: Bis 2018 wird der globale Paketversand um 20% wachsen. Der Markt für Paketsendungen profitiert vor allem vom E-Commerce und dem weltweit zunehmenden Online-Shopping. Das weltweite Paketvolumen stieg im Jahr 2015 um 2,9 Prozent auf 31 Mrd. Pakete ++ Deutschland ist der größte europäische Paketmarkt ++ 2015 gaben die Deutschen 12,7 Mrd. Euro für den Paketversand aus. Mehr Details in der Pressemitteilung: http://www.pitneybowes.com/de/newsroom/pressemitteilungen/global-parcel-shipping-index-2016.html
Recomendados

Recomendados
Más contenido relacionado
Más de Pitney Bowes
Más de Pitney Bowes (20)
Pitney Bowes Paketversand-Index
- 1. * Quelle: Der Pitney Bowes Paketversand-Index misst das Volumen und die Ausgaben im B2B-, B2C-, C2B - sowie das reine Endverbrauchergeschäft für Paketsendungen mit einem Gewicht von bis zu 31,5 kg. Die Studie deckt 12 wichtige Märkte ab, darunter die USA, Kanada, Brasilien, Deutschland, Großbritannien (GB), Frankreich, Italien, Norwegen, Schweden, Japan, Australien und Indien. * Quelle: 2016 Pitney Bowes Global Online Shopping Study 20% steigt das Volumen des weltweiten Paketversands bis 2018, prognostiziert Pitney Bowes Mit über 11.8Mrd versandten Paketen und Ausgaben von $85Mrd bleiben die USA der größte Markt* für den Paketversand Die Top 5-Märkte mit dem größten Paketversand-Volumen 2015 sind 31Mrd Pakete wurden 2015 versendet. Das entspricht einem Anstieg von 2.9% im Paketvolumen seit 2014* 5-7% jährl. Wachstum im Paketversand wird bis 2018 prognostiziert 9.4Mrd Japan 3.0Mrd Deutschland 2.2Mrd GB 1.5Mrd Frankreich Der Markt für Paketsendungen profitiert vor allem vom E-Commerce und dem weltweit zunehmenden Online-Shopping. Führend sind Deutschland, Großbritannien und Frankreich Deutschland führt den europäischen Markt an mit 2.9Mrd+ versandten Pakten in 2015 6.4% auf €12.7Mrd Die Ausgaben für den Paketversand stiegen in Deutschland um in 2015 Das Wachstum des deutschen Paketmarkts beruht hauptsächlich auf dem starken Anstieg der B2C-Pakete durch den E-Commerce. Treiber des Paketmarkts in Brasilien ist vor allem der wachsende Internet-Handel. Der wachsende Trend, Produkte über mobile Geräte zu kaufen, treibt den B2C-Paketversand an. 6% auf 2.2Mrd Das Volumen und die Ausgaben für den Paketversand stiegen in GB um Pakete 10.1% auf £8.9Mrd Höchstes Wachstum in Australien; Japans Volumen fällt Volumen und Ausgaben wachsen zweistellig 4.7% auf 1.5Mrd Der Paketversand in Frankreich wuchs um Pakete 4% auf €9.7Mrd In Japan sank das Volumen des Paketversands um wegen geringerer Paketzahlen 1.7% ¥2,48Mrd Umgekehrt wuchsen die Ausgaben für den Paketversand um 2.6% auf Ausgaben stiegen um 15.4% auf R$10.27Mrd 8.8% in Volumen und Australiens Paket- Versand stieg um 8.2% in den Ausgaben mit AU$ 9.6Mrd 8.2% auf 0.34Mrd die Ausgaben wuchsen um In Indien wuchs das Volumen des Paketversands um 17.2% auf ₹110.15Mrd 13.9% auf 0.57Mrd Pakete Volumen wuchs um Weitere Informationen finden Sie online auf pitneybowes.com Treiber sind Online-Shopping, Büroversand und der globale Handel Volumen des Paketversands wuchs in 2015 um: $85Mrd+ 1.2% mehr als 2014 US-Unternehmen gaben für den Paket- versand 2015 aus. in den USA 3.6% auf 11.8Mrd in Kanada 1.6% auf 0.55Mrd 40% des US-Paketversands machen Pakete und Großbriefe aus, die täglich von Unternehmen verschickt werden. Etwa Eine globale Shopping-Studie* zeigte kürzlich, dass über die Hälfte der US-Shopper monatlich online einkaufen. Pitney Bowes Paketversand-Index Index prognostiziert: Bis 2018 wird der globale Paketversand um 20% wachsen Wachstum in Europa Wachstum in Nordamerika Ergebnisse für die Region Asien-Pazifik Brasilien führt den Paketversand in Lateinamerika an