

Recomendados
Más contenido relacionado
Similar a Dairy farmprojectreport buffalosmallscale
Similar a Dairy farmprojectreport buffalosmallscale (20)
Dairy farmprojectreport buffalosmallscale
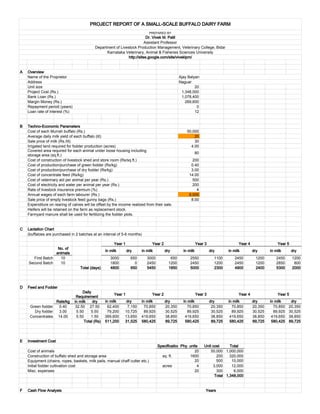
- 1. PROJECT REPORT OF A SMALL-SCALE BUFFALO DAIRY FARM PREPARED BY Dr. Vivek M. Patil Assistant Professor Department of Livestock Production Management, Veterinary College, Bidar Karnataka Veterinary, Animal & Fisheries Sciences University http://sites.google.com/site/viveklpm/ A Overview Name of the Proprietor Ajay Balyan Address Naguar Unit size 20 Project Cost (Rs.) 1,348,000 Bank Loan (Rs.) 1,078,400 Margin Money (Rs.) 269,600 Repayment period (years) 0 Loan rate of interest (%) 12 B Techno-Economic Parameters Cost of each Murrah buffalo (Rs.) 50,000 Average daily milk yield of each buffalo (lit) 20 Sale price of milk (Rs./lit) 30 Irrigated land required for fodder production (acres) 4.00 Covered area required for each animal under loose housing including 80 storage area (sq.ft.) Cost of construction of livestock shed and store room (Rs/sq.ft.) 200 Cost of production/purchase of green fodder (Rs/kg) 0.40 Cost of production/purchase of dry fodder (Rs/kg) 3.00 Cost of concentrate feed (Rs/kg) 14.00 Cost of veterinary aid per animal per year (Rs.) 500 Cost of electricity and water per animal per year (Rs.) 200 Rate of livestock insurance premium (%) 4 Annual wages of each farm labourer (Rs.) 8,000 Sale price of empty livestock feed gunny bags (Rs.) 8.00 Expenditure on rearing of calves will be offset by the income realized from their sale. Heifers will be retained on the farm as replacement stock. Farmyard manure shall be used for fertilizing the fodder plots. C Lactation Chart (buffaloes are purchased in 2 batches at an interval of 5-6 months) Year 1 Year 2 Year 3 Year 4 Year 5 No. of in milk dry in milk dry in milk dry in milk dry in milk dry animals First Batch 10 3000 650 3000 650 2550 1100 2450 1200 2450 1200 Second Batch 10 1800 0 2450 1200 2450 1200 2450 1200 2850 800 Total (days) 4800 650 5450 1850 5000 2300 4900 2400 5300 2000 D Feed and Fodder Daily Year 1 Year 2 Year 3 Year 4 Year 5 Requirement Rate/kg in milk dry in milk dry in milk dry in milk dry in milk dry in milk dry Green fodder 0.40 32.50 27.50 62,400 7,150 70,850 20,350 70,850 20,350 70,850 20,350 70,850 20,350 Dry fodder 3.00 5.50 5.50 79,200 10,725 89,925 30,525 89,925 30,525 89,925 30,525 89,925 30,525 Concentrates 14.00 5.50 1.50 369,600 13,650 419,650 38,850 419,650 38,850 419,650 38,850 419,650 38,850 Total (Rs) 511,200 31,525 580,425 89,725 580,425 89,725 580,425 89,725 580,425 89,725 E Investment Cost SpecificationsPhy. units Unit cost Total Cost of animals 20 50,000 1,000,000 Construction of buffalo shed and storage area sq. ft. 1600 200 320,000 Equipment (chains, ropes, baskets, milk pails, manual chaff cutter etc.) 20 500 10,000 Initial fodder cultivation cost acres 4 3,000 12,000 Misc. expenses 20 300 6,000 Total 1,348,000 F Cash Flow Analysis Years
- 2. I II III IV V 1 Costs a) Capital cost 1,348,000 b) Recurring cost Feeding during lactation period 511,200 580,425 580,425 580,425 580,425 Feeding during dry period 31,525 89,725 89,725 89,725 89,725 Veterinary aid 10,000 10,000 10,000 10,000 10,000 Cost of electricity & water 4,000 4,000 4,000 4,000 4,000 Insurance 40,000 40,000 40,000 40,000 40,000 Labour wages 32,000 32,000 32,000 32,000 32,000 Total 1,976,725 756,150 756,150 756,150 756,150 2 Benefits Sale of milk 2,880,000 3,270,000 3,000,000 2,940,000 3,180,000 Sale of gunny bags 4,380 5,240 4,952 4,888 5,144 Depreciated value of buildings 0 0 0 0 240,000 Depreciated value of equipments 0 0 0 0 5,000 Closing stock value 0 0 0 0 500,000 Total 2,884,380 3,275,240 3,004,952 2,944,888 3,930,144 3 DF @ 10% 0.91 0.83 0.75 0.68 0.62 4 Discounted Costs @ 10% 1,797,023 624,917 568,107 516,461 469,510 3,976,017 5 Discounted Benefits @ 10% 2,622,164 2,706,810 2,257,665 2,011,398 2,440,310 12,038,347 6 NPW @ 10% 8,062,330 7 BCR @ 10% 3.03 8 DF @ 50% 0.67 0.44 0.30 0.20 0.13 9 Net Benefits 907,655 2,519,090 2,248,802 2,188,738 3,173,994 10 Discounted Net Benefits @ 50% 605,103 1,119,596 666,312 432,343 417,975 3,241,328 11 IRR #NUM! G Repayment Schedule Equated Gross Net Year Income Expenses Annual Surplus Installment Surplus I 2,884,380 628,725 2,255,655 #DIV/0! #DIV/0! II 3,275,240 756,150 2,519,090 #DIV/0! #DIV/0! III 3,004,952 756,150 2,248,802 #DIV/0! #DIV/0! IV 2,944,888 756,150 2,188,738 #DIV/0! #DIV/0! V 3,185,144 756,150 2,428,994 #DIV/0! #DIV/0! Capital Recovery Factor #DIV/0! Date : 6/13/2012 17:29:36 Note : Data in highlighted cells are outside the parameters of this sheet. Please modify and re-enter the same in the Form. Disclaimer : The data provided in the Project Report is for reference purposes and uses standard assumptions. For customized Project Reports please contact the author or your nearest Veterinarian.