1. Prashant C. Uttarkar
(B.E production, DBM, Six Sigma Green Belt, Lean Expert
Certified)
Quality Control, Quality Department
LohaIspaatLtd,
Vill-Ransai. Dist-Raigad, Maharashtra,india
E-mail: prashantlight@yahoo.co.in
Contact No: +91-9921572981
21st January, 2014
LEAN THINKING:
IDENTIFY THE LEAD TIME BY USING
LITTLE’S LAW
1st International INAAR Convention Global Changes and Challenges
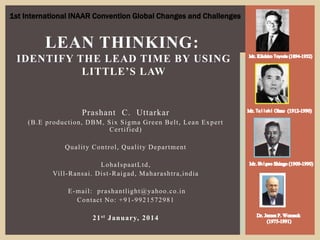
3. Dr. James P. Womack - (1975-1991).
Director of the IMVP at the MIT in Cambridge, Massachusetts, USA.
The initiator of the term “ Lean”.
What is Lean?
“A systematic approach to identifying and eliminating waste through continuous
improvement, flowing the product at the pull of the customer in pursuit of perfection.”
@ N a t i o n a l I n s t i t u t e o f S t a n d a r d s a n d T e c h n o l o g y M a n u f a c t u r i n g E x t e n s i o n
P a r t n e r s h i p ’ s L e a n N e t w o r k :
“LEAN IS… A mind-sets, or way of thinking, with a commitment to achieve a totally
waste-free operation that’s focused on your customer’s success….
Why Lean?
Necessity to service.
Reduce cash to cash cycle.
Improve Quality & service to customer.
Improve employee morale.
Lack of sales Linearity.
Customer fulfilment expectations increasing.
Struggling for inventory turns.
Business expects continuous productivity improvement.
@ Benchmark 6ix sigma Work show book.
INTRODUCTION
4. Prepare to lead change
Key elements in Change
Management
Define process measures and
scope
OEE, Takt time, Little's law
SIPOC and scope document
Document existing business
processes –
Mid-level maps (Swim lanes)
Detailed Process Map
VSM
Cross Functional Map
Analyse value stream and
eliminate waste
Using Pitch and Runner
Workload / Resource Balancing
Continuous flow
Set up time and SMED
Pull System and Kanban
Heijunka Box
Analyze risks and implement
controls –
FMEA (Failure Mode and Effects
Analysis)
FTA (Fault Tree Analysis)
Human Error Analysis using HTA
(Hierarchical Task Analysis)
Poka Yoke and Visual Controls
Standardize operations
Standardization and Standard Work
Late Point Differentiation
Risk Mitigation Plan
Build a culture of Kaizens
Kaizen
A3 problem solving
@ Benchmark 6ix sigma Work show
book.
A ROADMAP FOR LEAN
5. Dr. John Little :-
Little’s law can be used to derive the work load modelling
statistics
Little’s Theorem
describes the relationship between throughput rate (i.e. arrival
and service rate), cycle time and work in process (i.e. number of
customers/jobs in the system).
𝐿=𝜆𝑇
Lead time is the total time required to manufacture an item.
A high throughput means more business transactions and a low
response time means better end-user satisfaction.
If throughout rate is x, cycle time is 1/x.
Takt Time can be defined as the time required producing one unit daily
saleable quantity.
LITTLE’S THEOREM
6. Form Monthly Survey date it was identify that approx. an
average 300 TDC (Technical Delivery Condition) per day has to
issues to Production & Quality Department to process the
material as per Customer requirement, so that rejection rate
should be reduced. TDC person gives the TDC of each Customer
per each Size of material.
Planning department give planning sheet approx. at time
2pm to TDC person, he has 4 hr. to give TDC on machine or line.
Takt Time=Available Working Time per day/ Customer
Demand per day.
Takt time= 48 sec.
CASE STUDY-
OPTIMISED THE LEAD TIME BY USING LITTLE’S LAW.
7. Time require to given TDC = 2 TDC/min. and across checking the each TDC before signing
time require is 30 sec/TDC, 30% new TDC added per day and 20% TDC get cancelled or it
already given on machine or line. Find out how much time is requires to issues total TDC.
Throughput rate = 2 TDC/min. (20% cancelled)
= 1.6 TDC/min (30% new added)
=2.08 TDC/min.
If throughout rate is x, cycle time is 1/x.
Cycle time =0.4807 min = 29 sec.
Item-in-process /Inventory = 300 no/ day.
Little’s Law:
Lead Time = (WIP) Item-in-process/Throughout rate
= 300/2.08=144.2307 min
= 2.4038 hr.
Across Checking time for each TDC is 30 sec. 300 TDC require 2.5 hr. to checking
Total time requires
After calculation we found that Total time is require is 4.90 hr. which mean that approx.
Time requires is 5 hours. By above result can say that TDC person requires 1 hour (29 TDC)
extra to issues TDC.
OPTIMISED THE LEAD TIME BY USING
LITTLE’S LAW.
8. 1. TDC person should check TDC before giving print it requires approx. 10
sec.
2. When PO arrived make TDC parallel as per Customer once at a time in
correct format. So that checking time reduces.
3. Train a Quality person about TDC & it parameter to check as per ISO
standards. And minor error will be corrected on line/machine by QC
person itself.
4. After general shift if any TDC require, than QC person will take it from
Computer as it requires.
5. Implementation the kanban system-Pull system. When material
processes take a hard copy and refer it.
6. Building a culture of kaizens - each machine/Line should have a PC, so
that QC person refer TDC online and fill it online (SAP Software). It
reduces the hard copy/paper work and maintaining the documentation
cost up to 50%.
7. We also find out the Lead Time/Cycle Time by using several simulation
software (iGrafx, Visio etc) simply by using Flow Analysis Approaches:-
Cross Function Mapping, Value Stream Mapping, Process Flow Diagram,
String Diagram, From-To- Charts, ABC Analysis, Activity Relationship
chart.
CASE STUDY-
CORRECTIVE ACTION AND PREVENTIVE ACTION
9. Process Map (SAP for Quality Department )
Marketing/
Procurement
Laboratory
Test
Production
Dept
Quality Dept
PDI/TC
Logistic
Billing
Raw Material
Testin
g
Slitting/cut to
length line
M/T
Ok
Supplier
Not Ok
Prepare
Invoice
Customer
Pre-
Dispatch
Inspectio
n and
Test
Certificat
e
Dispatch
Divert or
Secondary
Not Ok
Ok
In line
Inspection
Process
Without
Order
OK
TDC
Planning
Clearance
from HOD
11. 1. Lean is a commitment to a process and a tremendous learning
experience should you attempt to implement Lean principles
and practices into organization.
2. The use of Little’s Law provides a mechanism to prove the
validity of these state representations and the predicted
changes in cycle time.
3. To improve cycle time, only two options are available, increase
throughput or reduce work in process.
1. The first option, increasing throughput, may require process
improvement or significant investment to increase the scale of the
system to better handle the increase in work in process.
2. Only the second option, reducing work in process, can be used to
effectively address these short-term demand variations. Reducing work
in process may require some counterintuitive actions.
4. This Case Study shows that it is possible to reduce the
workload by rethinking the system.
CONCLUSIONS