SlideShare a Scribd company logo
1 of 6
Mahindra & Mahindra Ltd. : Ratio AnalysisIndustryAuto - Cars & JeepsBSE Code500520Face ValueRs. 10.00ChairmanMr. Keshub MahindraNSE CodeM&MMarket Lot1GroupM & M GroupISIN NoINE101A01018Book Closure30/07/2009You can view the most widely used ratios such as Per share, Profitability, Leverage, Liquidity, Coverage ratios etc. Besides the ratios can be viewed for a period of 5 years Mar ' 09 Mar ' 08 Mar ' 07 Mar ' 06 Mar ' 05 PER SHARE RATIOS           Adjusted E P S (Rs.) 28.35 37.29 40.38 25.61 43.83Adjusted Cash EPS (Rs.) 39.04 47.30 49.20 34.19 60.33Reported EPS (Rs.) 30.69 46.15 44.88 36.72 45.92Reported Cash EPS (Rs.) 41.39 56.16 53.70 45.30 62.42Dividend Per Share 10.00 11.50 11.50 10.00 13.00Operating Profit Per Share (Rs.) 40.07 48.42 47.73 37.34 64.39Book Value (Excl Rev Res) Per Share (Rs.) 10.19 180.87 147.98 123.29 176.77Book Value (Incl Rev Res) Per Share (Rs.) 10.19 181.39 148.52 123.86 178.05Net Operating Income Per Share (Rs.) 481.48 473.09 416.81 348.61 590.67Free Reserves Per Share (Rs.) 170.32 168.36 135.66 109.86 158.02      PROFITABILITY RATIOS           Operating Margin (%) 8.32 10.23 11.45 10.71 10.90Gross Profit Margin (%) 6.10 8.12 9.33 8.25 8.10Net Profit Margin (%) 6.22 9.45 10.34 10.28 7.56Adjusted Cash Margin (%) 7.92 9.68 11.34 9.57 9.93Adjusted Return On Net Worth (%) 14.80 20.61 27.28 20.77 24.79Reported Return On Net Worth (%) 16.03 25.51 30.33 29.78 25.97Return On long Term Funds (%) 12.36 19.64 26.09 23.17 24.32      LEVERAGE RATIOS           Long Term Debt / Equity 0.83 0.62 0.53 0.40 0.60Total Debt/Equity 0.77 0.59 0.46 0.30 0.52Owners fund as % of total Source 56.34 62.63 68.39 76.62 65.49Fixed Assets Turnover Ratio 2.85 3.22 3.14 2.85 2.47      LIQUIDITY RATIOS           Current Ratio 1.06 1.10 1.37 1.24 1.19Current Ratio (Inc. ST Loans) 0.90 0.86 1.31 1.21 1.10Quick Ratio 0.83 0.74 1.01 0.83 0.78Inventory Turnover Ratio 14.60 12.49 13.42 11.13 10.66      PAYOUT RATIOS           Dividend payout Ratio (Net Profit) 37.29 29.10 30.39 32.45 33.54Dividend payout Ratio (Cash Profit) 27.65 23.91 25.40 26.30 24.67Earning Retention Ratio 59.63 63.99 66.22 53.46 64.87Cash Earnings Retention Ratio 70.69 71.61 72.28 65.14 74.48      COVERAGE RATIOS           Adjusted Cash Flow Time Total Debt 3.81 2.29 1.40 1.11 1.56Financial Charges Coverage Ratio 10.43 17.37 77.85 39.60 29.94Fin. Charges Cov.Ratio (Post Tax) 9.41 16.33 65.57 40.23 24.04      COMPONENT RATIOS           Material Cost Component(% earnings) 70.15 70.41 69.92 72.33 73.22Selling Cost Component 4.38 7.11 6.40 5.63 5.60Exports as percent of Total Sales 5.26 7.81 7.18 6.24 5.14Import Comp. in Raw Mat. Consumed 1.39 1.59 1.97 1.86 2.41Long term assets / Total Assets 0.63 0.63 0.50 0.53 0.52Bonus Component In Equity Capital (%) 62.58 71.36 71.67 73.09 47.0Maruti Suzuki India Ltd. : Ratio Analysis IndustryAuto - Cars & JeepsBSE Code532500Face ValueRs. 5.00ChairmanMr. R C BhargavaNSE CodeMARUTIMarket Lot1GroupMNC AssociateISIN NoINE585B01010Book Closure02/09/2009You can view the most widely used ratios such as Per share, Profitability, Leverage, Liquidity, Coverage ratios etc. Besides the ratios can be viewed for a period of 5 years Mar ' 08 Mar ' 07 Mar ' 06 Mar ' 05 Mar ' 04 PER SHARE RATIOS           Adjusted E P S (Rs.) 55.94 53.69 43.87 28.85 21.16Adjusted Cash EPS (Rs.) 75.61 63.09 53.75 45.23 40.80Reported EPS (Rs.) 59.91 54.07 41.16 29.55 18.76Reported Cash EPS (Rs.) 79.57 63.46 51.04 45.92 38.40Dividend Per Share 5.00 4.50 3.50 2.00 1.50Operating Profit Per Share (Rs.) 88.31 76.30 64.59 54.35 43.35Book Value (Excl Rev Res) Per Share (Rs.) 291.28 237.23 188.73 151.56 123.74Book Value (Incl Rev Res) Per Share (Rs.) 291.28 237.23 188.73 151.56 123.74Net Operating Income Per Share (Rs.) 625.34 512.49 422.20 382.34 327.07Free Reserves Per Share (Rs.) 286.28 231.89 183.18 144.13 116.91      PROFITABILITY RATIOS           Operating Margin (%) 14.12 14.88 15.29 14.21 13.25Gross Profit Margin (%) 10.97 13.05 12.95 10.08 8.01Net Profit Margin (%) 9.34 10.29 9.53 7.57 5.61Adjusted Cash Margin (%) 11.79 12.01 12.45 11.59 12.21Adjusted Return On Net Worth (%) 19.20 22.63 23.24 19.03 17.10Reported Return On Net Worth (%) 20.56 22.78 21.80 19.49 15.16Return On long Term Funds (%) 27.35 30.74 33.47 28.12 22.71      LEVERAGE RATIOS           Long Term Debt / Equity 0.05 0.08 0.01 0.06 0.08Total Debt/Equity 0.10 0.09 0.01 0.07 0.08Owners fund as % of total Source 90.33 91.57 98.70 93.43 92.00Fixed Assets Turnover Ratio 2.48 2.41 2.46 2.19 2.07      LIQUIDITY RATIOS           Current Ratio 1.03 1.42 1.77 1.68 1.17Current Ratio (Inc. ST Loans) 0.91 1.40 1.77 1.67 1.15Quick Ratio 0.66 1.13 1.31 1.25 0.85Inventory Turnover Ratio 22.93 28.76 18.78 22.97 30.43      PAYOUT RATIOS           Dividend payout Ratio (Net Profit) 9.78 9.72 9.69 7.73 9.02Dividend payout Ratio (Cash Profit) 7.36 8.28 7.81 4.97 4.40Earning Retention Ratio 89.53 90.21 90.91 92.09 92.01Cash Earnings Retention Ratio 92.25 91.67 92.58 94.95 95.86      COVERAGE RATIOS           Adjusted Cash Flow Time Total Debt 0.41 0.34 0.04 0.23 0.26Financial Charges Coverage Ratio 50.46 68.23 104.61 49.70 32.32Fin. Charges Cov.Ratio (Post Tax) 39.57 49.76 73.28 37.85 25.71      COMPONENT RATIOS           Material Cost Component(% earnings) 77.25 73.36 77.25 78.30 74.47Selling Cost Component 3.10 3.37 2.91 3.34 7.05Exports as percent of Total Sales 4.10 3.90 4.78 8.89 9.96Import Comp. in Raw Mat. Consumed 10.84 12.62 18.75 19.69 20.40Long term assets / Total Assets 0.74 0.61 0.49 0.52 0.62Bonus Component In Equity Capital (%) 0.00 0.00 0.00 0.00 0.00Tata Motors Ltd. : Ratio AnalysisIndustryAuto - LCVs/HCVsBSE Code500570Face ValueRs. 10.00ChairmanMr. Ratan N TataNSE CodeTATAMOTORSMarket Lot1GroupTata GroupISIN NoINE155A01014Book Closure25/08/2009You can view the most widely used ratios such as Per share, Profitability, Leverage, Liquidity, Coverage ratios etc. Besides the ratios can be viewed for a period of 5 years Mar ' 08 Mar ' 07 Mar ' 06 Mar ' 05 Mar ' 04 PER SHARE RATIOS           Adjusted E P S (Rs.) 42.91 43.76 35.57 34.08 23.24Adjusted Cash EPS (Rs.) 61.50 61.18 51.10 48.38 35.54Reported EPS (Rs.) 52.63 49.65 39.94 34.19 22.96Reported Cash EPS (Rs.) 71.22 67.07 55.47 48.49 35.26Dividend Per Share 15.00 15.00 13.00 12.50 8.00Operating Profit Per Share (Rs.) 77.84 67.12 56.06 55.29 48.94Book Value (Excl Rev Res) Per Share (Rs.) 202.54 177.33 143.58 113.15 101.08Book Value (Incl Rev Res) Per Share (Rs.) 203.20 178.00 144.26 113.15 101.08Net Operating Income Per Share (Rs.) 745.47 691.91 524.73 475.44 369.11Free Reserves Per Share (Rs.) 182.38 157.16 123.34 93.85 81.54      PROFITABILITY RATIOS           Operating Margin (%) 10.44 9.70 10.68 11.62 13.25Gross Profit Margin (%) 8.17 7.50 8.09 9.01 10.32Net Profit Margin (%) 6.96 6.94 7.35 7.02 6.10Adjusted Cash Margin (%) 8.13 8.55 9.41 9.94 9.45Adjusted Return On Net Worth (%) 21.18 24.67 24.77 30.12 22.98Reported Return On Net Worth (%) 25.98 28.00 27.81 30.21 22.71Return On long Term Funds (%) 22.73 31.18 28.65 28.72 32.21      LEVERAGE RATIOS           Long Term Debt / Equity 0.50 0.31 0.41 0.59 0.32Total Debt/Equity 0.80 0.58 0.53 0.60 0.35Owners fund as % of total Source 55.43 63.05 65.23 62.22 74.02Fixed Assets Turnover Ratio 2.68 3.08 2.55 2.62 2.18      LIQUIDITY RATIOS           Current Ratio 0.89 1.24 1.24 0.99 0.72Current Ratio (Inc. ST Loans) 0.64 0.85 1.07 0.98 0.69Quick Ratio 0.66 0.91 0.96 0.76 0.47Inventory Turnover Ratio 14.43 13.26 12.63 14.06 14.91      PAYOUT RATIOS           Dividend payout Ratio (Net Profit) 32.51 35.34 37.13 41.68 39.27Dividend payout Ratio (Cash Profit) 24.02 26.16 26.73 29.39 25.57Earning Retention Ratio 60.13 59.90 58.31 58.18 61.20Cash Earnings Retention Ratio 72.18 71.32 70.98 70.54 74.63      COVERAGE RATIOS           Adjusted Cash Flow Time Total Debt 2.65 1.70 1.50 1.43 1.00Financial Charges Coverage Ratio 7.19 7.62 8.08 10.24 8.69Fin. Charges Cov.Ratio (Post Tax) 6.82 6.67 7.06 8.49 6.51      COMPONENT RATIOS           Material Cost Component(% earnings) 72.69 74.55 72.84 71.19 65.84Selling Cost Component 4.10 4.00 3.78 3.48 3.49Exports as percent of Total Sales 9.89 10.18 11.87 8.70 7.80Import Comp. in Raw Mat. Consumed 4.60 3.88 4.64 2.30 2.43Long term assets / Total Assets 0.58 0.45 0.39 0.47 0.62Bonus Component In Equity Capital (%) 28.86 28.87 29.06 30.76 31.5
Mnm Tata Motor Maruti

More Related Content

What's hot

Vodpod Jan 7, 2009 Markets Plummet As Investors Panic After Satyam Shocker
Vodpod Jan 7, 2009 Markets Plummet As Investors Panic After Satyam ShockerVodpod Jan 7, 2009 Markets Plummet As Investors Panic After Satyam Shocker
Vodpod Jan 7, 2009 Markets Plummet As Investors Panic After Satyam ShockerJagannadham Thunuguntla
 
AOL News Jan 7, 2009 Markets Plummet As Investors Panic After Satyam Shocker
AOL News Jan 7, 2009 Markets Plummet As Investors Panic After Satyam ShockerAOL News Jan 7, 2009 Markets Plummet As Investors Panic After Satyam Shocker
AOL News Jan 7, 2009 Markets Plummet As Investors Panic After Satyam ShockerJagannadham Thunuguntla
 
Web India 123 Jan 7, 2009 Markets Plummet As Investors Panic After Satyam Sh...
Web India 123  Jan 7, 2009 Markets Plummet As Investors Panic After Satyam Sh...Web India 123  Jan 7, 2009 Markets Plummet As Investors Panic After Satyam Sh...
Web India 123 Jan 7, 2009 Markets Plummet As Investors Panic After Satyam Sh...Jagannadham Thunuguntla
 
Net India 123 Jan 7, 2009 Markets Plummet As Investors Panic After Satyam Sho...
Net India 123 Jan 7, 2009 Markets Plummet As Investors Panic After Satyam Sho...Net India 123 Jan 7, 2009 Markets Plummet As Investors Panic After Satyam Sho...
Net India 123 Jan 7, 2009 Markets Plummet As Investors Panic After Satyam Sho...Jagannadham Thunuguntla
 
Indian Era Jan 7, 2009 Markets Plummet As Investors Panic After Satyam Shocker
Indian Era  Jan 7, 2009 Markets Plummet As Investors Panic After Satyam ShockerIndian Era  Jan 7, 2009 Markets Plummet As Investors Panic After Satyam Shocker
Indian Era Jan 7, 2009 Markets Plummet As Investors Panic After Satyam ShockerJagannadham Thunuguntla
 
Sindh Today Jan 7, 2009 Markets Plummet As Investors Panic After Satyam Shocker
Sindh Today  Jan 7, 2009 Markets Plummet As Investors Panic After Satyam ShockerSindh Today  Jan 7, 2009 Markets Plummet As Investors Panic After Satyam Shocker
Sindh Today Jan 7, 2009 Markets Plummet As Investors Panic After Satyam ShockerJagannadham Thunuguntla
 
Smas Hits Jan 7, 2009 Markets Plummet As Investors Panic After Satyam Shocker
Smas Hits Jan 7, 2009 Markets Plummet As Investors Panic After Satyam ShockerSmas Hits Jan 7, 2009 Markets Plummet As Investors Panic After Satyam Shocker
Smas Hits Jan 7, 2009 Markets Plummet As Investors Panic After Satyam ShockerJagannadham Thunuguntla
 
Manglorean Jan 7, 2009 Markets Plummet As Investors Panic After Satyam Shocker
Manglorean  Jan 7, 2009 Markets Plummet As Investors Panic After Satyam ShockerManglorean  Jan 7, 2009 Markets Plummet As Investors Panic After Satyam Shocker
Manglorean Jan 7, 2009 Markets Plummet As Investors Panic After Satyam ShockerJagannadham Thunuguntla
 
Daily Times India Jan 7, 2009 Markets Plummet As Investors Panic After Satya...
Daily Times India  Jan 7, 2009 Markets Plummet As Investors Panic After Satya...Daily Times India  Jan 7, 2009 Markets Plummet As Investors Panic After Satya...
Daily Times India Jan 7, 2009 Markets Plummet As Investors Panic After Satya...Jagannadham Thunuguntla
 
Thaindian Jan 7, 2009 Markets Plummet As Investors Panic After Satyam Shocker
Thaindian Jan 7, 2009 Markets Plummet As Investors Panic After Satyam ShockerThaindian Jan 7, 2009 Markets Plummet As Investors Panic After Satyam Shocker
Thaindian Jan 7, 2009 Markets Plummet As Investors Panic After Satyam ShockerJagannadham Thunuguntla
 
Sulekha Jan 7, 2009 Markets Plummet As Investors Panic After Satyam Shocker
Sulekha  Jan 7, 2009 Markets Plummet As Investors Panic After Satyam ShockerSulekha  Jan 7, 2009 Markets Plummet As Investors Panic After Satyam Shocker
Sulekha Jan 7, 2009 Markets Plummet As Investors Panic After Satyam ShockerJagannadham Thunuguntla
 
Jack Meyers Media Village Jan 7, 2009 Markets Plummet As Investors Panic Aft...
Jack Meyers Media Village  Jan 7, 2009 Markets Plummet As Investors Panic Aft...Jack Meyers Media Village  Jan 7, 2009 Markets Plummet As Investors Panic Aft...
Jack Meyers Media Village Jan 7, 2009 Markets Plummet As Investors Panic Aft...Jagannadham Thunuguntla
 
South Asia News Jan 7, 2009 Markets Plummet As Investors Panic After Satyam ...
South Asia News  Jan 7, 2009 Markets Plummet As Investors Panic After Satyam ...South Asia News  Jan 7, 2009 Markets Plummet As Investors Panic After Satyam ...
South Asia News Jan 7, 2009 Markets Plummet As Investors Panic After Satyam ...Jagannadham Thunuguntla
 
India.Com Jan 7, 2009 Markets Plummet As Investors Panic After Satyam Shocker
India.Com  Jan 7, 2009 Markets Plummet As Investors Panic After Satyam ShockerIndia.Com  Jan 7, 2009 Markets Plummet As Investors Panic After Satyam Shocker
India.Com Jan 7, 2009 Markets Plummet As Investors Panic After Satyam ShockerJagannadham Thunuguntla
 
Tata Motors Capital Structure
Tata Motors Capital StructureTata Motors Capital Structure
Tata Motors Capital Structureitsvineeth209
 
Headlines India Jan 7, 2009 Markets Plummet As Investors Panic After Satyam S...
Headlines India Jan 7, 2009 Markets Plummet As Investors Panic After Satyam S...Headlines India Jan 7, 2009 Markets Plummet As Investors Panic After Satyam S...
Headlines India Jan 7, 2009 Markets Plummet As Investors Panic After Satyam S...Jagannadham Thunuguntla
 
Yahoo News Jan 7, 2009 Markets Plummet As Investors Panic After Satyam Shocker
Yahoo News Jan 7, 2009 Markets Plummet As Investors Panic After Satyam ShockerYahoo News Jan 7, 2009 Markets Plummet As Investors Panic After Satyam Shocker
Yahoo News Jan 7, 2009 Markets Plummet As Investors Panic After Satyam ShockerJagannadham Thunuguntla
 

What's hot (18)

Vodpod Jan 7, 2009 Markets Plummet As Investors Panic After Satyam Shocker
Vodpod Jan 7, 2009 Markets Plummet As Investors Panic After Satyam ShockerVodpod Jan 7, 2009 Markets Plummet As Investors Panic After Satyam Shocker
Vodpod Jan 7, 2009 Markets Plummet As Investors Panic After Satyam Shocker
 
AOL News Jan 7, 2009 Markets Plummet As Investors Panic After Satyam Shocker
AOL News Jan 7, 2009 Markets Plummet As Investors Panic After Satyam ShockerAOL News Jan 7, 2009 Markets Plummet As Investors Panic After Satyam Shocker
AOL News Jan 7, 2009 Markets Plummet As Investors Panic After Satyam Shocker
 
Web India 123 Jan 7, 2009 Markets Plummet As Investors Panic After Satyam Sh...
Web India 123  Jan 7, 2009 Markets Plummet As Investors Panic After Satyam Sh...Web India 123  Jan 7, 2009 Markets Plummet As Investors Panic After Satyam Sh...
Web India 123 Jan 7, 2009 Markets Plummet As Investors Panic After Satyam Sh...
 
Net India 123 Jan 7, 2009 Markets Plummet As Investors Panic After Satyam Sho...
Net India 123 Jan 7, 2009 Markets Plummet As Investors Panic After Satyam Sho...Net India 123 Jan 7, 2009 Markets Plummet As Investors Panic After Satyam Sho...
Net India 123 Jan 7, 2009 Markets Plummet As Investors Panic After Satyam Sho...
 
Indian Era Jan 7, 2009 Markets Plummet As Investors Panic After Satyam Shocker
Indian Era  Jan 7, 2009 Markets Plummet As Investors Panic After Satyam ShockerIndian Era  Jan 7, 2009 Markets Plummet As Investors Panic After Satyam Shocker
Indian Era Jan 7, 2009 Markets Plummet As Investors Panic After Satyam Shocker
 
Sindh Today Jan 7, 2009 Markets Plummet As Investors Panic After Satyam Shocker
Sindh Today  Jan 7, 2009 Markets Plummet As Investors Panic After Satyam ShockerSindh Today  Jan 7, 2009 Markets Plummet As Investors Panic After Satyam Shocker
Sindh Today Jan 7, 2009 Markets Plummet As Investors Panic After Satyam Shocker
 
Smas Hits Jan 7, 2009 Markets Plummet As Investors Panic After Satyam Shocker
Smas Hits Jan 7, 2009 Markets Plummet As Investors Panic After Satyam ShockerSmas Hits Jan 7, 2009 Markets Plummet As Investors Panic After Satyam Shocker
Smas Hits Jan 7, 2009 Markets Plummet As Investors Panic After Satyam Shocker
 
Manglorean Jan 7, 2009 Markets Plummet As Investors Panic After Satyam Shocker
Manglorean  Jan 7, 2009 Markets Plummet As Investors Panic After Satyam ShockerManglorean  Jan 7, 2009 Markets Plummet As Investors Panic After Satyam Shocker
Manglorean Jan 7, 2009 Markets Plummet As Investors Panic After Satyam Shocker
 
Daily Times India Jan 7, 2009 Markets Plummet As Investors Panic After Satya...
Daily Times India  Jan 7, 2009 Markets Plummet As Investors Panic After Satya...Daily Times India  Jan 7, 2009 Markets Plummet As Investors Panic After Satya...
Daily Times India Jan 7, 2009 Markets Plummet As Investors Panic After Satya...
 
Thaindian Jan 7, 2009 Markets Plummet As Investors Panic After Satyam Shocker
Thaindian Jan 7, 2009 Markets Plummet As Investors Panic After Satyam ShockerThaindian Jan 7, 2009 Markets Plummet As Investors Panic After Satyam Shocker
Thaindian Jan 7, 2009 Markets Plummet As Investors Panic After Satyam Shocker
 
Sulekha Jan 7, 2009 Markets Plummet As Investors Panic After Satyam Shocker
Sulekha  Jan 7, 2009 Markets Plummet As Investors Panic After Satyam ShockerSulekha  Jan 7, 2009 Markets Plummet As Investors Panic After Satyam Shocker
Sulekha Jan 7, 2009 Markets Plummet As Investors Panic After Satyam Shocker
 
Jack Meyers Media Village Jan 7, 2009 Markets Plummet As Investors Panic Aft...
Jack Meyers Media Village  Jan 7, 2009 Markets Plummet As Investors Panic Aft...Jack Meyers Media Village  Jan 7, 2009 Markets Plummet As Investors Panic Aft...
Jack Meyers Media Village Jan 7, 2009 Markets Plummet As Investors Panic Aft...
 
South Asia News Jan 7, 2009 Markets Plummet As Investors Panic After Satyam ...
South Asia News  Jan 7, 2009 Markets Plummet As Investors Panic After Satyam ...South Asia News  Jan 7, 2009 Markets Plummet As Investors Panic After Satyam ...
South Asia News Jan 7, 2009 Markets Plummet As Investors Panic After Satyam ...
 
India.Com Jan 7, 2009 Markets Plummet As Investors Panic After Satyam Shocker
India.Com  Jan 7, 2009 Markets Plummet As Investors Panic After Satyam ShockerIndia.Com  Jan 7, 2009 Markets Plummet As Investors Panic After Satyam Shocker
India.Com Jan 7, 2009 Markets Plummet As Investors Panic After Satyam Shocker
 
Tata Motors Capital Structure
Tata Motors Capital StructureTata Motors Capital Structure
Tata Motors Capital Structure
 
1551068739daily report--25-feb--2019
1551068739daily report--25-feb--20191551068739daily report--25-feb--2019
1551068739daily report--25-feb--2019
 
Headlines India Jan 7, 2009 Markets Plummet As Investors Panic After Satyam S...
Headlines India Jan 7, 2009 Markets Plummet As Investors Panic After Satyam S...Headlines India Jan 7, 2009 Markets Plummet As Investors Panic After Satyam S...
Headlines India Jan 7, 2009 Markets Plummet As Investors Panic After Satyam S...
 
Yahoo News Jan 7, 2009 Markets Plummet As Investors Panic After Satyam Shocker
Yahoo News Jan 7, 2009 Markets Plummet As Investors Panic After Satyam ShockerYahoo News Jan 7, 2009 Markets Plummet As Investors Panic After Satyam Shocker
Yahoo News Jan 7, 2009 Markets Plummet As Investors Panic After Satyam Shocker
 

Similar to Mnm Tata Motor Maruti

Bharti airtel ratios
Bharti airtel ratiosBharti airtel ratios
Bharti airtel ratiosAayush Kumar
 
Maruti final ppt
Maruti final pptMaruti final ppt
Maruti final pptAmit Kasar
 
Fce tvs motors_28_jul15
Fce tvs motors_28_jul15Fce tvs motors_28_jul15
Fce tvs motors_28_jul15IndiaNotes.com
 
Lumax Industries quarterly results above estimates; buy
Lumax Industries quarterly results above estimates; buyLumax Industries quarterly results above estimates; buy
Lumax Industries quarterly results above estimates; buyIndiaNotes.com
 
Cummins India: No interest burden being free from long-term or short-term debt
Cummins India: No interest burden being free from long-term or short-term debtCummins India: No interest burden being free from long-term or short-term debt
Cummins India: No interest burden being free from long-term or short-term debtIndiaNotes.com
 
Atul Auto: Aims at Rs1000 cr turnover in the medium term
Atul Auto: Aims at Rs1000 cr turnover in the medium termAtul Auto: Aims at Rs1000 cr turnover in the medium term
Atul Auto: Aims at Rs1000 cr turnover in the medium termIndiaNotes.com
 
Profitability of sbi
Profitability of sbiProfitability of sbi
Profitability of sbiSandeep Rai
 
Firstcall oberoi realty_ltd_16_june15
Firstcall oberoi realty_ltd_16_june15Firstcall oberoi realty_ltd_16_june15
Firstcall oberoi realty_ltd_16_june15IndiaNotes.com
 
Go long on Simmonds Marshall for the mid- to long-term
Go long on Simmonds Marshall for the mid- to long-termGo long on Simmonds Marshall for the mid- to long-term
Go long on Simmonds Marshall for the mid- to long-termIndiaNotes.com
 
Firstcall simmonds marshall_ltd_1_july15
Firstcall simmonds marshall_ltd_1_july15Firstcall simmonds marshall_ltd_1_july15
Firstcall simmonds marshall_ltd_1_july15IndiaNotes.com
 
Capital Structure Analysis
Capital Structure Analysis Capital Structure Analysis
Capital Structure Analysis Dipika Sahoo
 
Gabriel India: Q4FY15 net profit up 55.52% y/y to INR129.55m; 'Buy'
Gabriel India: Q4FY15 net profit up 55.52% y/y to INR129.55m; 'Buy'Gabriel India: Q4FY15 net profit up 55.52% y/y to INR129.55m; 'Buy'
Gabriel India: Q4FY15 net profit up 55.52% y/y to INR129.55m; 'Buy'IndiaNotes.com
 
M M Forgings: Q4FY15 net profit up 42.18% y/y to INR111.15m, Buy
M M Forgings: Q4FY15 net profit up 42.18% y/y to INR111.15m, BuyM M Forgings: Q4FY15 net profit up 42.18% y/y to INR111.15m, Buy
M M Forgings: Q4FY15 net profit up 42.18% y/y to INR111.15m, BuyIndiaNotes.com
 
Ashok Leyland Q1FY15: Losses narrowed down to Rs48 mn, hold
 Ashok Leyland Q1FY15: Losses narrowed down to Rs48 mn, hold Ashok Leyland Q1FY15: Losses narrowed down to Rs48 mn, hold
Ashok Leyland Q1FY15: Losses narrowed down to Rs48 mn, holdIndiaNotes.com
 
Patel Integrated Logistics: FY15 net profit up 155%; transportation sector re...
Patel Integrated Logistics: FY15 net profit up 155%; transportation sector re...Patel Integrated Logistics: FY15 net profit up 155%; transportation sector re...
Patel Integrated Logistics: FY15 net profit up 155%; transportation sector re...IndiaNotes.com
 
深圳大学 Stay real_长安汽车_决赛ppt
深圳大学 Stay real_长安汽车_决赛ppt深圳大学 Stay real_长安汽车_决赛ppt
深圳大学 Stay real_长安汽车_决赛pptGabriel Fong
 
Stock snapshot
Stock snapshotStock snapshot
Stock snapshotmhhhhhh
 
Menon Pistons' Q4FY15 net profit up 213.38% y/y, Firstcall recommends 'Buy'
Menon Pistons' Q4FY15 net profit up 213.38% y/y, Firstcall recommends 'Buy'Menon Pistons' Q4FY15 net profit up 213.38% y/y, Firstcall recommends 'Buy'
Menon Pistons' Q4FY15 net profit up 213.38% y/y, Firstcall recommends 'Buy'IndiaNotes.com
 
Voltas Q4FY15: Firstcall recommend 'Buy'
Voltas Q4FY15: Firstcall recommend 'Buy'Voltas Q4FY15: Firstcall recommend 'Buy'
Voltas Q4FY15: Firstcall recommend 'Buy'IndiaNotes.com
 
Analysis-MRF-Limited.pdf
Analysis-MRF-Limited.pdfAnalysis-MRF-Limited.pdf
Analysis-MRF-Limited.pdfvikrant860663
 

Similar to Mnm Tata Motor Maruti (20)

Bharti airtel ratios
Bharti airtel ratiosBharti airtel ratios
Bharti airtel ratios
 
Maruti final ppt
Maruti final pptMaruti final ppt
Maruti final ppt
 
Fce tvs motors_28_jul15
Fce tvs motors_28_jul15Fce tvs motors_28_jul15
Fce tvs motors_28_jul15
 
Lumax Industries quarterly results above estimates; buy
Lumax Industries quarterly results above estimates; buyLumax Industries quarterly results above estimates; buy
Lumax Industries quarterly results above estimates; buy
 
Cummins India: No interest burden being free from long-term or short-term debt
Cummins India: No interest burden being free from long-term or short-term debtCummins India: No interest burden being free from long-term or short-term debt
Cummins India: No interest burden being free from long-term or short-term debt
 
Atul Auto: Aims at Rs1000 cr turnover in the medium term
Atul Auto: Aims at Rs1000 cr turnover in the medium termAtul Auto: Aims at Rs1000 cr turnover in the medium term
Atul Auto: Aims at Rs1000 cr turnover in the medium term
 
Profitability of sbi
Profitability of sbiProfitability of sbi
Profitability of sbi
 
Firstcall oberoi realty_ltd_16_june15
Firstcall oberoi realty_ltd_16_june15Firstcall oberoi realty_ltd_16_june15
Firstcall oberoi realty_ltd_16_june15
 
Go long on Simmonds Marshall for the mid- to long-term
Go long on Simmonds Marshall for the mid- to long-termGo long on Simmonds Marshall for the mid- to long-term
Go long on Simmonds Marshall for the mid- to long-term
 
Firstcall simmonds marshall_ltd_1_july15
Firstcall simmonds marshall_ltd_1_july15Firstcall simmonds marshall_ltd_1_july15
Firstcall simmonds marshall_ltd_1_july15
 
Capital Structure Analysis
Capital Structure Analysis Capital Structure Analysis
Capital Structure Analysis
 
Gabriel India: Q4FY15 net profit up 55.52% y/y to INR129.55m; 'Buy'
Gabriel India: Q4FY15 net profit up 55.52% y/y to INR129.55m; 'Buy'Gabriel India: Q4FY15 net profit up 55.52% y/y to INR129.55m; 'Buy'
Gabriel India: Q4FY15 net profit up 55.52% y/y to INR129.55m; 'Buy'
 
M M Forgings: Q4FY15 net profit up 42.18% y/y to INR111.15m, Buy
M M Forgings: Q4FY15 net profit up 42.18% y/y to INR111.15m, BuyM M Forgings: Q4FY15 net profit up 42.18% y/y to INR111.15m, Buy
M M Forgings: Q4FY15 net profit up 42.18% y/y to INR111.15m, Buy
 
Ashok Leyland Q1FY15: Losses narrowed down to Rs48 mn, hold
 Ashok Leyland Q1FY15: Losses narrowed down to Rs48 mn, hold Ashok Leyland Q1FY15: Losses narrowed down to Rs48 mn, hold
Ashok Leyland Q1FY15: Losses narrowed down to Rs48 mn, hold
 
Patel Integrated Logistics: FY15 net profit up 155%; transportation sector re...
Patel Integrated Logistics: FY15 net profit up 155%; transportation sector re...Patel Integrated Logistics: FY15 net profit up 155%; transportation sector re...
Patel Integrated Logistics: FY15 net profit up 155%; transportation sector re...
 
深圳大学 Stay real_长安汽车_决赛ppt
深圳大学 Stay real_长安汽车_决赛ppt深圳大学 Stay real_长安汽车_决赛ppt
深圳大学 Stay real_长安汽车_决赛ppt
 
Stock snapshot
Stock snapshotStock snapshot
Stock snapshot
 
Menon Pistons' Q4FY15 net profit up 213.38% y/y, Firstcall recommends 'Buy'
Menon Pistons' Q4FY15 net profit up 213.38% y/y, Firstcall recommends 'Buy'Menon Pistons' Q4FY15 net profit up 213.38% y/y, Firstcall recommends 'Buy'
Menon Pistons' Q4FY15 net profit up 213.38% y/y, Firstcall recommends 'Buy'
 
Voltas Q4FY15: Firstcall recommend 'Buy'
Voltas Q4FY15: Firstcall recommend 'Buy'Voltas Q4FY15: Firstcall recommend 'Buy'
Voltas Q4FY15: Firstcall recommend 'Buy'
 
Analysis-MRF-Limited.pdf
Analysis-MRF-Limited.pdfAnalysis-MRF-Limited.pdf
Analysis-MRF-Limited.pdf
 

More from purval

Retail Sector In India
Retail Sector In IndiaRetail Sector In India
Retail Sector In Indiapurval
 
Ethics And Functional Areas Finance
Ethics And  Functional Areas  FinanceEthics And  Functional Areas  Finance
Ethics And Functional Areas Financepurval
 
Ethics And Functional Areas H R M
Ethics And  Functional Areas  H R MEthics And  Functional Areas  H R M
Ethics And Functional Areas H R Mpurval
 
Company C S R
Company  C S RCompany  C S R
Company C S Rpurval
 
C G Transparency
C G  TransparencyC G  Transparency
C G Transparencypurval
 
Clause 49
Clause 49Clause 49
Clause 49purval
 
Business Ethics
Business  EthicsBusiness  Ethics
Business Ethicspurval
 
C G Intro
C G  IntroC G  Intro
C G Intropurval
 
Trouble
TroubleTrouble
Troublepurval
 
Role Of C E O In C G
Role Of  C E O In  C GRole Of  C E O In  C G
Role Of C E O In C Gpurval
 
C S R Intro
C S R  IntroC S R  Intro
C S R Intropurval
 
I T C 1
I T C 1I T C 1
I T C 1purval
 
Carroll Model
Carroll  ModelCarroll  Model
Carroll Modelpurval
 
U S C G
U S  C GU S  C G
U S C Gpurval
 
Ethics And Functional Areas Prod
Ethics And  Functional Areas   ProdEthics And  Functional Areas   Prod
Ethics And Functional Areas Prodpurval
 
Ethical Dilemma
Ethical  DilemmaEthical  Dilemma
Ethical Dilemmapurval
 
C G Code
C G  CodeC G  Code
C G Codepurval
 
Corp Ethical Behavior
Corp  Ethical BehaviorCorp  Ethical Behavior
Corp Ethical Behaviorpurval
 
C S R First World Report
C S R  First  World  ReportC S R  First  World  Report
C S R First World Reportpurval
 
Ethics And Functional Areas Mktg
Ethics And  Functional Areas    MktgEthics And  Functional Areas    Mktg
Ethics And Functional Areas Mktgpurval
 

More from purval (20)

Retail Sector In India
Retail Sector In IndiaRetail Sector In India
Retail Sector In India
 
Ethics And Functional Areas Finance
Ethics And  Functional Areas  FinanceEthics And  Functional Areas  Finance
Ethics And Functional Areas Finance
 
Ethics And Functional Areas H R M
Ethics And  Functional Areas  H R MEthics And  Functional Areas  H R M
Ethics And Functional Areas H R M
 
Company C S R
Company  C S RCompany  C S R
Company C S R
 
C G Transparency
C G  TransparencyC G  Transparency
C G Transparency
 
Clause 49
Clause 49Clause 49
Clause 49
 
Business Ethics
Business  EthicsBusiness  Ethics
Business Ethics
 
C G Intro
C G  IntroC G  Intro
C G Intro
 
Trouble
TroubleTrouble
Trouble
 
Role Of C E O In C G
Role Of  C E O In  C GRole Of  C E O In  C G
Role Of C E O In C G
 
C S R Intro
C S R  IntroC S R  Intro
C S R Intro
 
I T C 1
I T C 1I T C 1
I T C 1
 
Carroll Model
Carroll  ModelCarroll  Model
Carroll Model
 
U S C G
U S  C GU S  C G
U S C G
 
Ethics And Functional Areas Prod
Ethics And  Functional Areas   ProdEthics And  Functional Areas   Prod
Ethics And Functional Areas Prod
 
Ethical Dilemma
Ethical  DilemmaEthical  Dilemma
Ethical Dilemma
 
C G Code
C G  CodeC G  Code
C G Code
 
Corp Ethical Behavior
Corp  Ethical BehaviorCorp  Ethical Behavior
Corp Ethical Behavior
 
C S R First World Report
C S R  First  World  ReportC S R  First  World  Report
C S R First World Report
 
Ethics And Functional Areas Mktg
Ethics And  Functional Areas    MktgEthics And  Functional Areas    Mktg
Ethics And Functional Areas Mktg
 

Recently uploaded

Strategies for Unlocking Knowledge Management in Microsoft 365 in the Copilot...
Strategies for Unlocking Knowledge Management in Microsoft 365 in the Copilot...Strategies for Unlocking Knowledge Management in Microsoft 365 in the Copilot...
Strategies for Unlocking Knowledge Management in Microsoft 365 in the Copilot...Drew Madelung
 
Architecting Cloud Native Applications
Architecting Cloud Native ApplicationsArchitecting Cloud Native Applications
Architecting Cloud Native ApplicationsWSO2
 
AXA XL - Insurer Innovation Award Americas 2024
AXA XL - Insurer Innovation Award Americas 2024AXA XL - Insurer Innovation Award Americas 2024
AXA XL - Insurer Innovation Award Americas 2024The Digital Insurer
 
How to Troubleshoot Apps for the Modern Connected Worker
How to Troubleshoot Apps for the Modern Connected WorkerHow to Troubleshoot Apps for the Modern Connected Worker
How to Troubleshoot Apps for the Modern Connected WorkerThousandEyes
 
A Beginners Guide to Building a RAG App Using Open Source Milvus
A Beginners Guide to Building a RAG App Using Open Source MilvusA Beginners Guide to Building a RAG App Using Open Source Milvus
A Beginners Guide to Building a RAG App Using Open Source MilvusZilliz
 
Apidays New York 2024 - Scaling API-first by Ian Reasor and Radu Cotescu, Adobe
Apidays New York 2024 - Scaling API-first by Ian Reasor and Radu Cotescu, AdobeApidays New York 2024 - Scaling API-first by Ian Reasor and Radu Cotescu, Adobe
Apidays New York 2024 - Scaling API-first by Ian Reasor and Radu Cotescu, Adobeapidays
 
Apidays New York 2024 - The value of a flexible API Management solution for O...
Apidays New York 2024 - The value of a flexible API Management solution for O...Apidays New York 2024 - The value of a flexible API Management solution for O...
Apidays New York 2024 - The value of a flexible API Management solution for O...apidays
 
Corporate and higher education May webinar.pptx
Corporate and higher education May webinar.pptxCorporate and higher education May webinar.pptx
Corporate and higher education May webinar.pptxRustici Software
 
A Year of the Servo Reboot: Where Are We Now?
A Year of the Servo Reboot: Where Are We Now?A Year of the Servo Reboot: Where Are We Now?
A Year of the Servo Reboot: Where Are We Now?Igalia
 
FWD Group - Insurer Innovation Award 2024
FWD Group - Insurer Innovation Award 2024FWD Group - Insurer Innovation Award 2024
FWD Group - Insurer Innovation Award 2024The Digital Insurer
 
Axa Assurance Maroc - Insurer Innovation Award 2024
Axa Assurance Maroc - Insurer Innovation Award 2024Axa Assurance Maroc - Insurer Innovation Award 2024
Axa Assurance Maroc - Insurer Innovation Award 2024The Digital Insurer
 
MINDCTI Revenue Release Quarter One 2024
MINDCTI Revenue Release Quarter One 2024MINDCTI Revenue Release Quarter One 2024
MINDCTI Revenue Release Quarter One 2024MIND CTI
 
Exploring the Future Potential of AI-Enabled Smartphone Processors
Exploring the Future Potential of AI-Enabled Smartphone ProcessorsExploring the Future Potential of AI-Enabled Smartphone Processors
Exploring the Future Potential of AI-Enabled Smartphone Processorsdebabhi2
 
Cloud Frontiers: A Deep Dive into Serverless Spatial Data and FME
Cloud Frontiers:  A Deep Dive into Serverless Spatial Data and FMECloud Frontiers:  A Deep Dive into Serverless Spatial Data and FME
Cloud Frontiers: A Deep Dive into Serverless Spatial Data and FMESafe Software
 
Connector Corner: Accelerate revenue generation using UiPath API-centric busi...
Connector Corner: Accelerate revenue generation using UiPath API-centric busi...Connector Corner: Accelerate revenue generation using UiPath API-centric busi...
Connector Corner: Accelerate revenue generation using UiPath API-centric busi...DianaGray10
 
Apidays New York 2024 - The Good, the Bad and the Governed by David O'Neill, ...
Apidays New York 2024 - The Good, the Bad and the Governed by David O'Neill, ...Apidays New York 2024 - The Good, the Bad and the Governed by David O'Neill, ...
Apidays New York 2024 - The Good, the Bad and the Governed by David O'Neill, ...apidays
 
Apidays Singapore 2024 - Scalable LLM APIs for AI and Generative AI Applicati...
Apidays Singapore 2024 - Scalable LLM APIs for AI and Generative AI Applicati...Apidays Singapore 2024 - Scalable LLM APIs for AI and Generative AI Applicati...
Apidays Singapore 2024 - Scalable LLM APIs for AI and Generative AI Applicati...apidays
 
Automating Google Workspace (GWS) & more with Apps Script
Automating Google Workspace (GWS) & more with Apps ScriptAutomating Google Workspace (GWS) & more with Apps Script
Automating Google Workspace (GWS) & more with Apps Scriptwesley chun
 
Web Form Automation for Bonterra Impact Management (fka Social Solutions Apri...
Web Form Automation for Bonterra Impact Management (fka Social Solutions Apri...Web Form Automation for Bonterra Impact Management (fka Social Solutions Apri...
Web Form Automation for Bonterra Impact Management (fka Social Solutions Apri...Jeffrey Haguewood
 
Navi Mumbai Call Girls 🥰 8617370543 Service Offer VIP Hot Model
Navi Mumbai Call Girls 🥰 8617370543 Service Offer VIP Hot ModelNavi Mumbai Call Girls 🥰 8617370543 Service Offer VIP Hot Model
Navi Mumbai Call Girls 🥰 8617370543 Service Offer VIP Hot ModelDeepika Singh
 

Recently uploaded (20)

Strategies for Unlocking Knowledge Management in Microsoft 365 in the Copilot...
Strategies for Unlocking Knowledge Management in Microsoft 365 in the Copilot...Strategies for Unlocking Knowledge Management in Microsoft 365 in the Copilot...
Strategies for Unlocking Knowledge Management in Microsoft 365 in the Copilot...
 
Architecting Cloud Native Applications
Architecting Cloud Native ApplicationsArchitecting Cloud Native Applications
Architecting Cloud Native Applications
 
AXA XL - Insurer Innovation Award Americas 2024
AXA XL - Insurer Innovation Award Americas 2024AXA XL - Insurer Innovation Award Americas 2024
AXA XL - Insurer Innovation Award Americas 2024
 
How to Troubleshoot Apps for the Modern Connected Worker
How to Troubleshoot Apps for the Modern Connected WorkerHow to Troubleshoot Apps for the Modern Connected Worker
How to Troubleshoot Apps for the Modern Connected Worker
 
A Beginners Guide to Building a RAG App Using Open Source Milvus
A Beginners Guide to Building a RAG App Using Open Source MilvusA Beginners Guide to Building a RAG App Using Open Source Milvus
A Beginners Guide to Building a RAG App Using Open Source Milvus
 
Apidays New York 2024 - Scaling API-first by Ian Reasor and Radu Cotescu, Adobe
Apidays New York 2024 - Scaling API-first by Ian Reasor and Radu Cotescu, AdobeApidays New York 2024 - Scaling API-first by Ian Reasor and Radu Cotescu, Adobe
Apidays New York 2024 - Scaling API-first by Ian Reasor and Radu Cotescu, Adobe
 
Apidays New York 2024 - The value of a flexible API Management solution for O...
Apidays New York 2024 - The value of a flexible API Management solution for O...Apidays New York 2024 - The value of a flexible API Management solution for O...
Apidays New York 2024 - The value of a flexible API Management solution for O...
 
Corporate and higher education May webinar.pptx
Corporate and higher education May webinar.pptxCorporate and higher education May webinar.pptx
Corporate and higher education May webinar.pptx
 
A Year of the Servo Reboot: Where Are We Now?
A Year of the Servo Reboot: Where Are We Now?A Year of the Servo Reboot: Where Are We Now?
A Year of the Servo Reboot: Where Are We Now?
 
FWD Group - Insurer Innovation Award 2024
FWD Group - Insurer Innovation Award 2024FWD Group - Insurer Innovation Award 2024
FWD Group - Insurer Innovation Award 2024
 
Axa Assurance Maroc - Insurer Innovation Award 2024
Axa Assurance Maroc - Insurer Innovation Award 2024Axa Assurance Maroc - Insurer Innovation Award 2024
Axa Assurance Maroc - Insurer Innovation Award 2024
 
MINDCTI Revenue Release Quarter One 2024
MINDCTI Revenue Release Quarter One 2024MINDCTI Revenue Release Quarter One 2024
MINDCTI Revenue Release Quarter One 2024
 
Exploring the Future Potential of AI-Enabled Smartphone Processors
Exploring the Future Potential of AI-Enabled Smartphone ProcessorsExploring the Future Potential of AI-Enabled Smartphone Processors
Exploring the Future Potential of AI-Enabled Smartphone Processors
 
Cloud Frontiers: A Deep Dive into Serverless Spatial Data and FME
Cloud Frontiers:  A Deep Dive into Serverless Spatial Data and FMECloud Frontiers:  A Deep Dive into Serverless Spatial Data and FME
Cloud Frontiers: A Deep Dive into Serverless Spatial Data and FME
 
Connector Corner: Accelerate revenue generation using UiPath API-centric busi...
Connector Corner: Accelerate revenue generation using UiPath API-centric busi...Connector Corner: Accelerate revenue generation using UiPath API-centric busi...
Connector Corner: Accelerate revenue generation using UiPath API-centric busi...
 
Apidays New York 2024 - The Good, the Bad and the Governed by David O'Neill, ...
Apidays New York 2024 - The Good, the Bad and the Governed by David O'Neill, ...Apidays New York 2024 - The Good, the Bad and the Governed by David O'Neill, ...
Apidays New York 2024 - The Good, the Bad and the Governed by David O'Neill, ...
 
Apidays Singapore 2024 - Scalable LLM APIs for AI and Generative AI Applicati...
Apidays Singapore 2024 - Scalable LLM APIs for AI and Generative AI Applicati...Apidays Singapore 2024 - Scalable LLM APIs for AI and Generative AI Applicati...
Apidays Singapore 2024 - Scalable LLM APIs for AI and Generative AI Applicati...
 
Automating Google Workspace (GWS) & more with Apps Script
Automating Google Workspace (GWS) & more with Apps ScriptAutomating Google Workspace (GWS) & more with Apps Script
Automating Google Workspace (GWS) & more with Apps Script
 
Web Form Automation for Bonterra Impact Management (fka Social Solutions Apri...
Web Form Automation for Bonterra Impact Management (fka Social Solutions Apri...Web Form Automation for Bonterra Impact Management (fka Social Solutions Apri...
Web Form Automation for Bonterra Impact Management (fka Social Solutions Apri...
 
Navi Mumbai Call Girls 🥰 8617370543 Service Offer VIP Hot Model
Navi Mumbai Call Girls 🥰 8617370543 Service Offer VIP Hot ModelNavi Mumbai Call Girls 🥰 8617370543 Service Offer VIP Hot Model
Navi Mumbai Call Girls 🥰 8617370543 Service Offer VIP Hot Model
 

Mnm Tata Motor Maruti

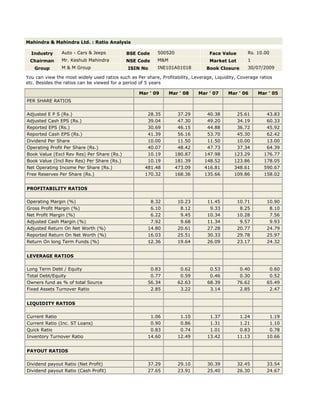
  • 1. Mahindra & Mahindra Ltd. : Ratio AnalysisIndustryAuto - Cars & JeepsBSE Code500520Face ValueRs. 10.00ChairmanMr. Keshub MahindraNSE CodeM&MMarket Lot1GroupM & M GroupISIN NoINE101A01018Book Closure30/07/2009You can view the most widely used ratios such as Per share, Profitability, Leverage, Liquidity, Coverage ratios etc. Besides the ratios can be viewed for a period of 5 years Mar ' 09 Mar ' 08 Mar ' 07 Mar ' 06 Mar ' 05 PER SHARE RATIOS           Adjusted E P S (Rs.) 28.35 37.29 40.38 25.61 43.83Adjusted Cash EPS (Rs.) 39.04 47.30 49.20 34.19 60.33Reported EPS (Rs.) 30.69 46.15 44.88 36.72 45.92Reported Cash EPS (Rs.) 41.39 56.16 53.70 45.30 62.42Dividend Per Share 10.00 11.50 11.50 10.00 13.00Operating Profit Per Share (Rs.) 40.07 48.42 47.73 37.34 64.39Book Value (Excl Rev Res) Per Share (Rs.) 10.19 180.87 147.98 123.29 176.77Book Value (Incl Rev Res) Per Share (Rs.) 10.19 181.39 148.52 123.86 178.05Net Operating Income Per Share (Rs.) 481.48 473.09 416.81 348.61 590.67Free Reserves Per Share (Rs.) 170.32 168.36 135.66 109.86 158.02      PROFITABILITY RATIOS           Operating Margin (%) 8.32 10.23 11.45 10.71 10.90Gross Profit Margin (%) 6.10 8.12 9.33 8.25 8.10Net Profit Margin (%) 6.22 9.45 10.34 10.28 7.56Adjusted Cash Margin (%) 7.92 9.68 11.34 9.57 9.93Adjusted Return On Net Worth (%) 14.80 20.61 27.28 20.77 24.79Reported Return On Net Worth (%) 16.03 25.51 30.33 29.78 25.97Return On long Term Funds (%) 12.36 19.64 26.09 23.17 24.32      LEVERAGE RATIOS           Long Term Debt / Equity 0.83 0.62 0.53 0.40 0.60Total Debt/Equity 0.77 0.59 0.46 0.30 0.52Owners fund as % of total Source 56.34 62.63 68.39 76.62 65.49Fixed Assets Turnover Ratio 2.85 3.22 3.14 2.85 2.47      LIQUIDITY RATIOS           Current Ratio 1.06 1.10 1.37 1.24 1.19Current Ratio (Inc. ST Loans) 0.90 0.86 1.31 1.21 1.10Quick Ratio 0.83 0.74 1.01 0.83 0.78Inventory Turnover Ratio 14.60 12.49 13.42 11.13 10.66      PAYOUT RATIOS           Dividend payout Ratio (Net Profit) 37.29 29.10 30.39 32.45 33.54Dividend payout Ratio (Cash Profit) 27.65 23.91 25.40 26.30 24.67Earning Retention Ratio 59.63 63.99 66.22 53.46 64.87Cash Earnings Retention Ratio 70.69 71.61 72.28 65.14 74.48      COVERAGE RATIOS           Adjusted Cash Flow Time Total Debt 3.81 2.29 1.40 1.11 1.56Financial Charges Coverage Ratio 10.43 17.37 77.85 39.60 29.94Fin. Charges Cov.Ratio (Post Tax) 9.41 16.33 65.57 40.23 24.04      COMPONENT RATIOS           Material Cost Component(% earnings) 70.15 70.41 69.92 72.33 73.22Selling Cost Component 4.38 7.11 6.40 5.63 5.60Exports as percent of Total Sales 5.26 7.81 7.18 6.24 5.14Import Comp. in Raw Mat. Consumed 1.39 1.59 1.97 1.86 2.41Long term assets / Total Assets 0.63 0.63 0.50 0.53 0.52Bonus Component In Equity Capital (%) 62.58 71.36 71.67 73.09 47.0Maruti Suzuki India Ltd. : Ratio Analysis IndustryAuto - Cars & JeepsBSE Code532500Face ValueRs. 5.00ChairmanMr. R C BhargavaNSE CodeMARUTIMarket Lot1GroupMNC AssociateISIN NoINE585B01010Book Closure02/09/2009You can view the most widely used ratios such as Per share, Profitability, Leverage, Liquidity, Coverage ratios etc. Besides the ratios can be viewed for a period of 5 years Mar ' 08 Mar ' 07 Mar ' 06 Mar ' 05 Mar ' 04 PER SHARE RATIOS           Adjusted E P S (Rs.) 55.94 53.69 43.87 28.85 21.16Adjusted Cash EPS (Rs.) 75.61 63.09 53.75 45.23 40.80Reported EPS (Rs.) 59.91 54.07 41.16 29.55 18.76Reported Cash EPS (Rs.) 79.57 63.46 51.04 45.92 38.40Dividend Per Share 5.00 4.50 3.50 2.00 1.50Operating Profit Per Share (Rs.) 88.31 76.30 64.59 54.35 43.35Book Value (Excl Rev Res) Per Share (Rs.) 291.28 237.23 188.73 151.56 123.74Book Value (Incl Rev Res) Per Share (Rs.) 291.28 237.23 188.73 151.56 123.74Net Operating Income Per Share (Rs.) 625.34 512.49 422.20 382.34 327.07Free Reserves Per Share (Rs.) 286.28 231.89 183.18 144.13 116.91      PROFITABILITY RATIOS           Operating Margin (%) 14.12 14.88 15.29 14.21 13.25Gross Profit Margin (%) 10.97 13.05 12.95 10.08 8.01Net Profit Margin (%) 9.34 10.29 9.53 7.57 5.61Adjusted Cash Margin (%) 11.79 12.01 12.45 11.59 12.21Adjusted Return On Net Worth (%) 19.20 22.63 23.24 19.03 17.10Reported Return On Net Worth (%) 20.56 22.78 21.80 19.49 15.16Return On long Term Funds (%) 27.35 30.74 33.47 28.12 22.71      LEVERAGE RATIOS           Long Term Debt / Equity 0.05 0.08 0.01 0.06 0.08Total Debt/Equity 0.10 0.09 0.01 0.07 0.08Owners fund as % of total Source 90.33 91.57 98.70 93.43 92.00Fixed Assets Turnover Ratio 2.48 2.41 2.46 2.19 2.07      LIQUIDITY RATIOS           Current Ratio 1.03 1.42 1.77 1.68 1.17Current Ratio (Inc. ST Loans) 0.91 1.40 1.77 1.67 1.15Quick Ratio 0.66 1.13 1.31 1.25 0.85Inventory Turnover Ratio 22.93 28.76 18.78 22.97 30.43      PAYOUT RATIOS           Dividend payout Ratio (Net Profit) 9.78 9.72 9.69 7.73 9.02Dividend payout Ratio (Cash Profit) 7.36 8.28 7.81 4.97 4.40Earning Retention Ratio 89.53 90.21 90.91 92.09 92.01Cash Earnings Retention Ratio 92.25 91.67 92.58 94.95 95.86      COVERAGE RATIOS           Adjusted Cash Flow Time Total Debt 0.41 0.34 0.04 0.23 0.26Financial Charges Coverage Ratio 50.46 68.23 104.61 49.70 32.32Fin. Charges Cov.Ratio (Post Tax) 39.57 49.76 73.28 37.85 25.71      COMPONENT RATIOS           Material Cost Component(% earnings) 77.25 73.36 77.25 78.30 74.47Selling Cost Component 3.10 3.37 2.91 3.34 7.05Exports as percent of Total Sales 4.10 3.90 4.78 8.89 9.96Import Comp. in Raw Mat. Consumed 10.84 12.62 18.75 19.69 20.40Long term assets / Total Assets 0.74 0.61 0.49 0.52 0.62Bonus Component In Equity Capital (%) 0.00 0.00 0.00 0.00 0.00Tata Motors Ltd. : Ratio AnalysisIndustryAuto - LCVs/HCVsBSE Code500570Face ValueRs. 10.00ChairmanMr. Ratan N TataNSE CodeTATAMOTORSMarket Lot1GroupTata GroupISIN NoINE155A01014Book Closure25/08/2009You can view the most widely used ratios such as Per share, Profitability, Leverage, Liquidity, Coverage ratios etc. Besides the ratios can be viewed for a period of 5 years Mar ' 08 Mar ' 07 Mar ' 06 Mar ' 05 Mar ' 04 PER SHARE RATIOS           Adjusted E P S (Rs.) 42.91 43.76 35.57 34.08 23.24Adjusted Cash EPS (Rs.) 61.50 61.18 51.10 48.38 35.54Reported EPS (Rs.) 52.63 49.65 39.94 34.19 22.96Reported Cash EPS (Rs.) 71.22 67.07 55.47 48.49 35.26Dividend Per Share 15.00 15.00 13.00 12.50 8.00Operating Profit Per Share (Rs.) 77.84 67.12 56.06 55.29 48.94Book Value (Excl Rev Res) Per Share (Rs.) 202.54 177.33 143.58 113.15 101.08Book Value (Incl Rev Res) Per Share (Rs.) 203.20 178.00 144.26 113.15 101.08Net Operating Income Per Share (Rs.) 745.47 691.91 524.73 475.44 369.11Free Reserves Per Share (Rs.) 182.38 157.16 123.34 93.85 81.54      PROFITABILITY RATIOS           Operating Margin (%) 10.44 9.70 10.68 11.62 13.25Gross Profit Margin (%) 8.17 7.50 8.09 9.01 10.32Net Profit Margin (%) 6.96 6.94 7.35 7.02 6.10Adjusted Cash Margin (%) 8.13 8.55 9.41 9.94 9.45Adjusted Return On Net Worth (%) 21.18 24.67 24.77 30.12 22.98Reported Return On Net Worth (%) 25.98 28.00 27.81 30.21 22.71Return On long Term Funds (%) 22.73 31.18 28.65 28.72 32.21      LEVERAGE RATIOS           Long Term Debt / Equity 0.50 0.31 0.41 0.59 0.32Total Debt/Equity 0.80 0.58 0.53 0.60 0.35Owners fund as % of total Source 55.43 63.05 65.23 62.22 74.02Fixed Assets Turnover Ratio 2.68 3.08 2.55 2.62 2.18      LIQUIDITY RATIOS           Current Ratio 0.89 1.24 1.24 0.99 0.72Current Ratio (Inc. ST Loans) 0.64 0.85 1.07 0.98 0.69Quick Ratio 0.66 0.91 0.96 0.76 0.47Inventory Turnover Ratio 14.43 13.26 12.63 14.06 14.91      PAYOUT RATIOS           Dividend payout Ratio (Net Profit) 32.51 35.34 37.13 41.68 39.27Dividend payout Ratio (Cash Profit) 24.02 26.16 26.73 29.39 25.57Earning Retention Ratio 60.13 59.90 58.31 58.18 61.20Cash Earnings Retention Ratio 72.18 71.32 70.98 70.54 74.63      COVERAGE RATIOS           Adjusted Cash Flow Time Total Debt 2.65 1.70 1.50 1.43 1.00Financial Charges Coverage Ratio 7.19 7.62 8.08 10.24 8.69Fin. Charges Cov.Ratio (Post Tax) 6.82 6.67 7.06 8.49 6.51      COMPONENT RATIOS           Material Cost Component(% earnings) 72.69 74.55 72.84 71.19 65.84Selling Cost Component 4.10 4.00 3.78 3.48 3.49Exports as percent of Total Sales 9.89 10.18 11.87 8.70 7.80Import Comp. in Raw Mat. Consumed 4.60 3.88 4.64 2.30 2.43Long term assets / Total Assets 0.58 0.45 0.39 0.47 0.62Bonus Component In Equity Capital (%) 28.86 28.87 29.06 30.76 31.5