SlideShare a Scribd company logo
1 of 50
Download to read offline
Soil Analysis of Selected Sites
in the Cleveland Botanical Woodland Garden
      by Lisa K. Schlag on 6 August 2008
Purpose of Research


       • Begin to record baseline values of soil quality
indicators of the Woodland Garden soil for subsequent
evaluation and comparison; and, in the course of collecting
specific data on earthworm densities, provide pilot testing
for earthworm collection procedures.
       • In addition to the plant inventory data, collecting
data on Woodland Garden soil will provide additional
information that will assist with future management and
planning.
Introduction

What is soil ?
       Unconsolidated mineral and organic material on the
immediate surface of the earth that contains living and nonliving
matter and serves as a natural medium for the growth of land plants.
Functions of soil for plants
       anchorage • water • oxygen • nutrients
Soil Quality Indicators
       qualitative and/or quantitative techniques
              • collect measurements
              • evaluate patterns, if any
              • compare results to measurements taken at different
                time/location
Site Characteristics

Soil Quality Indicators
      evaluate within context of site and climate characteristics
Soil Series: UeA (Urban land Elnora complex)
              Elnora: 0 - 9“ loamy fine sand
              Oshtemo: 0 - 8“ sandy loam
              Glenford: 0 - 7“ silt loam
              Stafford Variant: 0 - 4“ sandy loam
      Cuyahoga county lies entirely within glaciated part of Ohio.
      Bedrock underlying glacial deposits is sandstone and shale.
Management History: low       Slope %: varies with site
Climate Information : 35.4” average annual precipitation
Site Characteristics
Site One
OO - NW quadrant
Site Two
NN - NW quadrant
Site Three
MM - NW quadrant
Site Four
LL - NW quadrant
Site Five
KK - NW quadrant
Site Six
JJ - NW quadrant
Properties of Soil -- Soil Quality Indicators
Physical Property Indicators
   • Soil Texture                 • availability of Oxygen (aeration)
   • Soil Structure               • mobility of water through soil
   • Bulk Density                 • ease of root penetration and growth
   • Soil Temperature             • soil fertility
Chemical Property Indicators
   • Electrical Conductivity      • availability of nutrients and water
   • Soil pH                      • plant growth
   • Soil Nutrient Availability   • macro/micro organism activity
Biological Property Indicators
   • Earthworm Density            • all above to a greater or lesser extent
Physical Property
Soil Quality Indicator -- Soil Texture

                   Proportions of mineral
                   separates in a particular soil
                   determine soil texture class


                   Sand • house key thickness
                        • small pin head
                        • book page thickness
                   Silt • visible under microscope
                   Clay • most are not visible
                          even under a microscope
Soil Quality Indicator -- Soil Texture
             Procedures
Soil Quality Indicator -- Soil Texture
             Procedures
Soil Quality Indicator -- Soil Texture
             Procedures
Soil Quality Indicator -- Soil Texture
             Procedures
Site OO -- Soil Texture Class
          Sandy Loam


4% Clay
  41% Silt


  55% Sand
Site NN -- Soil Texture Class
          Sandy Loam


3% Clay

 39% Silt


58% Sand
Site MM -- Soil Texture Class
          Loamy Sand


 2% Clay
22% Silt


 76% Sand
Site LL -- Soil Texture Class
              Silt Loam


4% Clay

  57% Silt

  39% Sand
Site KK -- Soil Texture Class
          Sandy Loam


6% Clay
  35% Silt


  59% Sand           ●
Site JJ -- Soil Texture Class
            Sandy Loam


4% Clay
  25 Silt


  71% Sand
Soil Texture Classes of all Sites


                               OO: sandy loam
                               NN: sandy loam
                               MM: loamy sand
                              LL: silt loam
                               KK: sandy loam
                              JJ: sandy loam
Physical Property
        Soil Quality Indicator -- Soil Structure


 How soil particles grouped together into stable aggregates
                       Characteristics
Type (shape)       Class (size)        Grade (cohesion strength)
•   angular blocky   •   very fine     • weak
•   subangular       •   fine          • moderate
•   granular         •   medium        • strong
•   columnar         •   coarse
•   platy            •   very coarse
•   prismatic
Site OO -- Soil Structure


                                      A horizon
                                       >20 cm


dark grayish brown sandy loam, moderate medium and fine
                    granular structure
Site NN -- Soil Structure


                                       A horizon
                                 3 cm//6 cm//11 cm


dark grayish brown sandy loam, moderate medium and fine
                    granular structure
Site MM -- Soil Structure


                                         A horizon
                                   8 cm//10 cm//15 cm


dark grayish brown loamy fine sand, weak medium and fine
                    granular structure
Site LL -- Soil Structure


                                             A horizon
                                        2 cm//6 cm//9 cm


very dark grayish brown silt loam, moderate medium and fine
                     granular structure
Site KK -- Soil Structure


                                      A horizon
                                        >20 cm


dark grayish brown sandy loam, weak medium and fine
                granular structure
Site JJ -- Soil Structure


                                       A horizon
                                     13 cm// 20 cm


dark grayish brown sandy loam, weak medium and fine
                granular structure
Physical Property
         Soil Quality Indicator -- Bulk Density
Measurement of soil mass for a volume of soil as it appears
naturally, including any air space and organic materials.


      • Determines if soil layers are too compacted to allow root
        penetration or adequate aeration
      • soil mass calculated dry
      • soils with different bulk densities due to different textures may
        be equally good for plant growth
Soil Quality Indicator -- Bulk Density
              Procedures
Bulk Density of all Sites

                                    Water          > 20 - 30% organic matter
mineral soil densities weigh more           organic soil densities weigh less

     OO      LL     MM      JJ     1g/cm3    KK       NN


 Site Bulk Density (g/cm3)       Soil Texture Ideal BD for plant growth
 OO        1.584966              sandy loam           < 1.60
 NN         .749718              sandy loam           < 1.60
 MM        1.481139              loamy sand           < 1.60
 LL        1.492541              silty loam           < 1.40
 KK         .918373              sandy loam           < 1.60
 JJ        1.097283              sandy loam           < 1.60
Physical Property
       Soil Quality Indicator -- Soil Temperature

                                Determined by
                                 • Heat supply to soil surface
                                      > organic soil covering reduces
                                 • Dissipation of heat in soil
                                      > if soil water content higher, more
                                        heat needed for temperature
                                        changes

Soil temperature changes with depth and time of day.

Daily air temperature fluctuations seldom affect soil deeper than 12 -
16” (30 - 40cm).
Soil Temperature of all Sites


Soil Temp/Site OO   NN     MM     LL     KK     JJ
<=12”depth   72oF   65oF   63oF   66oF   68oF   68oF
Soil Temperature of all Sites


Soil Temp/Site OO    NN     MM     LL     KK     JJ
12”depth      68oF   62oF   61oF   64oF   63oF   63oF
18”depth      63oF   60oF   60oF   62oF   63oF   63oF
Chemical Property
 Soil Quality Indicator -- Electrical Conductivity
Measurement of soil salinity

Factors affecting EC
  • Porosity: greater porosity more easily electricity conducted
  • Temperature: decrease in temperature toward freezing point of
                   water soil EC decreases
  • Precipitation: if too low, usually <15" annually, to provide
                   leaching, most or all soluble salts remain in soil
                        • average Cleveland annual precipitation is
                          35.4"
Chemical Property
  Soil Quality Indicator -- Soil pH
Indication of the acidity or basicity of soil
Soil Quality Indicators --
       Electrical Conductivity and Soil pH
                    Procedures


1:1 soil-water suspension
Electrical Conductivity of all Sites


 Normal Soils
 < 4 dS/m
           Site       EC      Salinity Class
           OO       .8 dS/m   non saline
           NN       .9 dS/m   non saline
           MM      1.6 dS/m   very slight saline
           LL       .9 dS/m   non saline
           KK      1.2 dS/m   very slight saline
           JJ       .6 dS/m   non saline
Soil pH of all Sites


Soil pH/Site   OO    NN    MM    LL    KK    JJ
Sensor         7.3   7.1   7.1   7.8   6.2   6.2
Lab            7.1   6.8   6.8   7.4   6.5   6.3
Chemical Property
Soil Quality Indicator -- Soil Nutrient Availability


     Site   OO    NN    MM    LL    KK    JJ    lab
     pH     7.1   6.8   6.8   7.4   6.5   6.3
Soil Nutrient Availability of all Sites
                  Lab Analysis

       Site        Measure of Available Soil Nutrients
                     P         K       Ca       Mg
       OO          surplus   high     medium   medium
       NN          high      high     medium   medium
       MM          medium    high     medium   medium
       LL          high      high     medium   medium
       KK          high      medium   medium   medium
       JJ          high      medium   medium   medium

Nutrient availability appears good
Biological Property
      Soil Quality Indicator -- Earthworm Density
  Earthworms important, but not necessary soil organisms
                    in all habitats
 Earthworm populations vary with food availability and soil conditions
                 Favorable Conditions              Unfavorable Conditions
Temperature      10 - 20ºC (50 - 68ºF)              25 - 35ºC (77 - 95ºF)
Soil properties medium texture                      sandy/clayey
Soil pH          5-7.4 pH                           <=4.5pH
Food source      do NOT eat living vegetation      conifer needles -- pine
                 elm, ash, & birch litter eaten     and spruce hardly eaten
                 more freely than oak & beech
Soil disturbance undisturbed soil system

                       Generally, improve soil quality
        • increase availability of nutrients in soil
        • accelerate decomposition of organic matter (can be
          unfavorable, especially in certain hardwood forest habitats)
        • improve physical properties
Soil Quality Indicator -- Earthworm Density
                 Procedures
Soil Quality Indicator -- Earthworm Density
                 Procedures
Earthworm Density of four of the six Sites


     No Adults/
     Juveniles
Site per 13.3cm2       per m2
OO        8              72
NN        7              63
MM        8              72
LL        7              63
(most appeared to be near
 surface dwellers (epigeic))
Do Differently

1. retain core samples taken for soil structure
2. collect more core samples
3. collect more soil samples for soil texture average
4. record slope percentage
5. record soil color as indicators of parent material,
      organic material, and soil conditions, such as
      water retention
6. test bulk density using another method to compare
      results
7. do earthworm sampling in spring or autumn
State Soil of Ohio
                          Miamian Soil

                        Consists of very deep, well drained soils that formed in
                        a thin layer of loess and in the underlying loamy till,
                        which is high in content of lime. The original
                        vegetation consisted of deciduous forest species,
                        principally white oak, maple, elm, ash, and hickory.
                        Most extensive soils in Ohio. They occur on more than
                        750,000 acres in the state. They are productive soils.
                        Corn, soybeans, and winter wheat are the primary
                        crops. The average annual precipitation ranges from
                        33 to 42 inches.

Ap--0 to 23 cm (0 to 9 inches); brown (10YR 4/3) silt loam, pale brown
(10YR 6/3) dry; moderate medium subangular blocky structure parting to
weak fine granular; friable; common fine roots; 1 percent gravel; neutral;
abrupt smooth boundary. [13 to 25 cm (5 to 10 inches) thick]

More Related Content

What's hot

Soil testing for n,p,k
Soil testing for n,p,kSoil testing for n,p,k
Soil testing for n,p,kvigyanashram
 
Determining Soil organic carbon by Walkley and Black method
Determining Soil organic carbon by Walkley and Black methodDetermining Soil organic carbon by Walkley and Black method
Determining Soil organic carbon by Walkley and Black methodTribhuvan University, Kathmandu
 
Determination of Soil Reaction (pH): Theoretical Concept and Teacher's Guide
Determination of Soil Reaction (pH): Theoretical Concept and Teacher's GuideDetermination of Soil Reaction (pH): Theoretical Concept and Teacher's Guide
Determination of Soil Reaction (pH): Theoretical Concept and Teacher's GuideSarada Mandal
 
Fertilizer analysis
Fertilizer analysisFertilizer analysis
Fertilizer analysisAkma Ija
 
Determination of total nitrogen in soil by semi micro Kjeldahl method
Determination of total nitrogen in soil by semi micro Kjeldahl methodDetermination of total nitrogen in soil by semi micro Kjeldahl method
Determination of total nitrogen in soil by semi micro Kjeldahl methodsaifur rahman
 
DETERMINATION OF PHOSPHOROUS IN SOIL
DETERMINATION OF PHOSPHOROUS IN SOILDETERMINATION OF PHOSPHOROUS IN SOIL
DETERMINATION OF PHOSPHOROUS IN SOILNarendrareddy123
 
Soil parameters, analysis protocols, interpretation, and fertilizer recommend...
Soil parameters, analysis protocols, interpretation, and fertilizer recommend...Soil parameters, analysis protocols, interpretation, and fertilizer recommend...
Soil parameters, analysis protocols, interpretation, and fertilizer recommend...ExternalEvents
 
PPT_1_ Soil Color.pptx
PPT_1_ Soil Color.pptxPPT_1_ Soil Color.pptx
PPT_1_ Soil Color.pptxUsman Mastoi
 
Alkalinity in Water
Alkalinity in WaterAlkalinity in Water
Alkalinity in WaterFirasMfarrej
 
Soil Testing – its importance
Soil Testing – its importanceSoil Testing – its importance
Soil Testing – its importanceAmit Pundir
 

What's hot (20)

Soil testing for n,p,k
Soil testing for n,p,kSoil testing for n,p,k
Soil testing for n,p,k
 
Soil testing
Soil testingSoil testing
Soil testing
 
Determining Soil organic carbon by Walkley and Black method
Determining Soil organic carbon by Walkley and Black methodDetermining Soil organic carbon by Walkley and Black method
Determining Soil organic carbon by Walkley and Black method
 
Determination of Soil Reaction (pH): Theoretical Concept and Teacher's Guide
Determination of Soil Reaction (pH): Theoretical Concept and Teacher's GuideDetermination of Soil Reaction (pH): Theoretical Concept and Teacher's Guide
Determination of Soil Reaction (pH): Theoretical Concept and Teacher's Guide
 
Elemental Analysis of Plant Material
Elemental Analysis of Plant MaterialElemental Analysis of Plant Material
Elemental Analysis of Plant Material
 
Determination of calcium and magnecium in water sample
Determination of calcium and magnecium in water sample Determination of calcium and magnecium in water sample
Determination of calcium and magnecium in water sample
 
Soil analysis
Soil analysisSoil analysis
Soil analysis
 
Fertilizer analysis
Fertilizer analysisFertilizer analysis
Fertilizer analysis
 
Determination of Soil pH and soil EC
Determination of Soil pH and soil ECDetermination of Soil pH and soil EC
Determination of Soil pH and soil EC
 
Determination of total nitrogen in soil by semi micro Kjeldahl method
Determination of total nitrogen in soil by semi micro Kjeldahl methodDetermination of total nitrogen in soil by semi micro Kjeldahl method
Determination of total nitrogen in soil by semi micro Kjeldahl method
 
Determination of soil available phosphorous
Determination of soil available phosphorousDetermination of soil available phosphorous
Determination of soil available phosphorous
 
pH and Soil pH
pH and Soil pHpH and Soil pH
pH and Soil pH
 
Electrical conductivity
Electrical conductivityElectrical conductivity
Electrical conductivity
 
DETERMINATION OF PHOSPHOROUS IN SOIL
DETERMINATION OF PHOSPHOROUS IN SOILDETERMINATION OF PHOSPHOROUS IN SOIL
DETERMINATION OF PHOSPHOROUS IN SOIL
 
Analysis of fertilizer
Analysis of fertilizerAnalysis of fertilizer
Analysis of fertilizer
 
Clay Mineralogy
Clay MineralogyClay Mineralogy
Clay Mineralogy
 
Soil parameters, analysis protocols, interpretation, and fertilizer recommend...
Soil parameters, analysis protocols, interpretation, and fertilizer recommend...Soil parameters, analysis protocols, interpretation, and fertilizer recommend...
Soil parameters, analysis protocols, interpretation, and fertilizer recommend...
 
PPT_1_ Soil Color.pptx
PPT_1_ Soil Color.pptxPPT_1_ Soil Color.pptx
PPT_1_ Soil Color.pptx
 
Alkalinity in Water
Alkalinity in WaterAlkalinity in Water
Alkalinity in Water
 
Soil Testing – its importance
Soil Testing – its importanceSoil Testing – its importance
Soil Testing – its importance
 

Similar to Soil Analysis Presentation

Physicalpropertiesofsoils 161120102232
Physicalpropertiesofsoils 161120102232Physicalpropertiesofsoils 161120102232
Physicalpropertiesofsoils 161120102232Christian ONA PAKO
 
Physical properties of soils
Physical properties of soilsPhysical properties of soils
Physical properties of soilsmuruganjey
 
Geotechnical Engineering- Testing Aspects
Geotechnical Engineering-  Testing AspectsGeotechnical Engineering-  Testing Aspects
Geotechnical Engineering- Testing AspectsYogesh Bafna
 
highwaymaterials-soil-ppt_class_1.pdf
highwaymaterials-soil-ppt_class_1.pdfhighwaymaterials-soil-ppt_class_1.pdf
highwaymaterials-soil-ppt_class_1.pdfReigerRoyal
 
4.soil texture and structure
4.soil texture and structure4.soil texture and structure
4.soil texture and structurejkervrodriguez
 
Geo Technical Engineering (Soil compaction)
Geo Technical Engineering (Soil compaction)Geo Technical Engineering (Soil compaction)
Geo Technical Engineering (Soil compaction)Latif Hyder Wadho
 
Determination of Soil Texture.
Determination of Soil Texture.Determination of Soil Texture.
Determination of Soil Texture.Pourani SGM
 
Building materials - Soil
Building materials - SoilBuilding materials - Soil
Building materials - Soilmoonjazzy
 
SOIL MECHANICS INTRODUCTION WITH ADVANTAGES AND WHY SOIL MECHANICS STUDY IS S...
SOIL MECHANICS INTRODUCTION WITH ADVANTAGES AND WHY SOIL MECHANICS STUDY IS S...SOIL MECHANICS INTRODUCTION WITH ADVANTAGES AND WHY SOIL MECHANICS STUDY IS S...
SOIL MECHANICS INTRODUCTION WITH ADVANTAGES AND WHY SOIL MECHANICS STUDY IS S...MuhangiChristopher
 
31. soil science By Allah Dad Khan
31. soil science By Allah Dad Khan 31. soil science By Allah Dad Khan
31. soil science By Allah Dad Khan Mr.Allah Dad Khan
 
PPT_2_ Soil Texture.pptx
PPT_2_ Soil Texture.pptxPPT_2_ Soil Texture.pptx
PPT_2_ Soil Texture.pptxUsman Mastoi
 
topic 5 The physical properties of soil dr, mactal.ppt
topic 5 The physical properties of soil dr, mactal.ppttopic 5 The physical properties of soil dr, mactal.ppt
topic 5 The physical properties of soil dr, mactal.pptalfordglenn
 
Introduction to Soil Science
Introduction to Soil ScienceIntroduction to Soil Science
Introduction to Soil ScienceAndy Kleinschmidt
 
Soil Science Simplified.ppt #soil science #fundamentals of sail
Soil Science Simplified.ppt #soil science #fundamentals of sailSoil Science Simplified.ppt #soil science #fundamentals of sail
Soil Science Simplified.ppt #soil science #fundamentals of sailajaysaini99283371
 

Similar to Soil Analysis Presentation (20)

Physicalpropertiesofsoils 161120102232
Physicalpropertiesofsoils 161120102232Physicalpropertiesofsoils 161120102232
Physicalpropertiesofsoils 161120102232
 
Physical properties of soils
Physical properties of soilsPhysical properties of soils
Physical properties of soils
 
CCA_Soil_Water_Mgmt.pdf
CCA_Soil_Water_Mgmt.pdfCCA_Soil_Water_Mgmt.pdf
CCA_Soil_Water_Mgmt.pdf
 
Highway materials - soil
Highway materials - soil Highway materials - soil
Highway materials - soil
 
Geotechnical Engineering- Testing Aspects
Geotechnical Engineering-  Testing AspectsGeotechnical Engineering-  Testing Aspects
Geotechnical Engineering- Testing Aspects
 
highwaymaterials-soil-ppt_class_1.pdf
highwaymaterials-soil-ppt_class_1.pdfhighwaymaterials-soil-ppt_class_1.pdf
highwaymaterials-soil-ppt_class_1.pdf
 
4.soil texture and structure
4.soil texture and structure4.soil texture and structure
4.soil texture and structure
 
Basic soil characteristics.pdf
Basic soil characteristics.pdfBasic soil characteristics.pdf
Basic soil characteristics.pdf
 
Geo Technical Engineering (Soil compaction)
Geo Technical Engineering (Soil compaction)Geo Technical Engineering (Soil compaction)
Geo Technical Engineering (Soil compaction)
 
Determination of Soil Texture.
Determination of Soil Texture.Determination of Soil Texture.
Determination of Soil Texture.
 
Compaction susceptibility of selct alabama kanhapludults
Compaction susceptibility of selct alabama kanhapludultsCompaction susceptibility of selct alabama kanhapludults
Compaction susceptibility of selct alabama kanhapludults
 
Building materials - Soil
Building materials - SoilBuilding materials - Soil
Building materials - Soil
 
SOIL MECHANICS INTRODUCTION WITH ADVANTAGES AND WHY SOIL MECHANICS STUDY IS S...
SOIL MECHANICS INTRODUCTION WITH ADVANTAGES AND WHY SOIL MECHANICS STUDY IS S...SOIL MECHANICS INTRODUCTION WITH ADVANTAGES AND WHY SOIL MECHANICS STUDY IS S...
SOIL MECHANICS INTRODUCTION WITH ADVANTAGES AND WHY SOIL MECHANICS STUDY IS S...
 
31. soil science By Allah Dad Khan
31. soil science By Allah Dad Khan 31. soil science By Allah Dad Khan
31. soil science By Allah Dad Khan
 
PPT_2_ Soil Texture.pptx
PPT_2_ Soil Texture.pptxPPT_2_ Soil Texture.pptx
PPT_2_ Soil Texture.pptx
 
Soil water relationship
Soil water relationshipSoil water relationship
Soil water relationship
 
topic 5 The physical properties of soil dr, mactal.ppt
topic 5 The physical properties of soil dr, mactal.ppttopic 5 The physical properties of soil dr, mactal.ppt
topic 5 The physical properties of soil dr, mactal.ppt
 
Introduction to Soil Science
Introduction to Soil ScienceIntroduction to Soil Science
Introduction to Soil Science
 
Soil Science Simplified.ppt #soil science #fundamentals of sail
Soil Science Simplified.ppt #soil science #fundamentals of sailSoil Science Simplified.ppt #soil science #fundamentals of sail
Soil Science Simplified.ppt #soil science #fundamentals of sail
 
Soil Water Plant Relationships
Soil Water Plant RelationshipsSoil Water Plant Relationships
Soil Water Plant Relationships
 

Soil Analysis Presentation

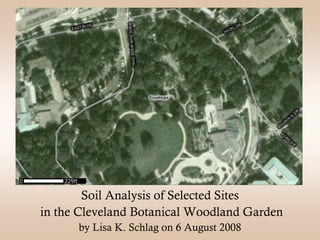
  • 1. Soil Analysis of Selected Sites in the Cleveland Botanical Woodland Garden by Lisa K. Schlag on 6 August 2008
  • 2. Purpose of Research • Begin to record baseline values of soil quality indicators of the Woodland Garden soil for subsequent evaluation and comparison; and, in the course of collecting specific data on earthworm densities, provide pilot testing for earthworm collection procedures. • In addition to the plant inventory data, collecting data on Woodland Garden soil will provide additional information that will assist with future management and planning.
  • 3. Introduction What is soil ? Unconsolidated mineral and organic material on the immediate surface of the earth that contains living and nonliving matter and serves as a natural medium for the growth of land plants. Functions of soil for plants anchorage • water • oxygen • nutrients Soil Quality Indicators qualitative and/or quantitative techniques • collect measurements • evaluate patterns, if any • compare results to measurements taken at different time/location
  • 4. Site Characteristics Soil Quality Indicators evaluate within context of site and climate characteristics Soil Series: UeA (Urban land Elnora complex) Elnora: 0 - 9“ loamy fine sand Oshtemo: 0 - 8“ sandy loam Glenford: 0 - 7“ silt loam Stafford Variant: 0 - 4“ sandy loam Cuyahoga county lies entirely within glaciated part of Ohio. Bedrock underlying glacial deposits is sandstone and shale. Management History: low Slope %: varies with site Climate Information : 35.4” average annual precipitation
  • 6. Site One OO - NW quadrant
  • 7. Site Two NN - NW quadrant
  • 8. Site Three MM - NW quadrant
  • 9. Site Four LL - NW quadrant
  • 10. Site Five KK - NW quadrant
  • 11. Site Six JJ - NW quadrant
  • 12. Properties of Soil -- Soil Quality Indicators Physical Property Indicators • Soil Texture • availability of Oxygen (aeration) • Soil Structure • mobility of water through soil • Bulk Density • ease of root penetration and growth • Soil Temperature • soil fertility Chemical Property Indicators • Electrical Conductivity • availability of nutrients and water • Soil pH • plant growth • Soil Nutrient Availability • macro/micro organism activity Biological Property Indicators • Earthworm Density • all above to a greater or lesser extent
  • 13. Physical Property Soil Quality Indicator -- Soil Texture Proportions of mineral separates in a particular soil determine soil texture class Sand • house key thickness • small pin head • book page thickness Silt • visible under microscope Clay • most are not visible even under a microscope
  • 14. Soil Quality Indicator -- Soil Texture Procedures
  • 15. Soil Quality Indicator -- Soil Texture Procedures
  • 16. Soil Quality Indicator -- Soil Texture Procedures
  • 17. Soil Quality Indicator -- Soil Texture Procedures
  • 18. Site OO -- Soil Texture Class Sandy Loam 4% Clay 41% Silt 55% Sand
  • 19. Site NN -- Soil Texture Class Sandy Loam 3% Clay 39% Silt 58% Sand
  • 20. Site MM -- Soil Texture Class Loamy Sand 2% Clay 22% Silt 76% Sand
  • 21. Site LL -- Soil Texture Class Silt Loam 4% Clay 57% Silt 39% Sand
  • 22. Site KK -- Soil Texture Class Sandy Loam 6% Clay 35% Silt 59% Sand ●
  • 23. Site JJ -- Soil Texture Class Sandy Loam 4% Clay 25 Silt 71% Sand
  • 24. Soil Texture Classes of all Sites OO: sandy loam NN: sandy loam MM: loamy sand LL: silt loam KK: sandy loam JJ: sandy loam
  • 25. Physical Property Soil Quality Indicator -- Soil Structure How soil particles grouped together into stable aggregates Characteristics Type (shape) Class (size) Grade (cohesion strength) • angular blocky • very fine • weak • subangular • fine • moderate • granular • medium • strong • columnar • coarse • platy • very coarse • prismatic
  • 26. Site OO -- Soil Structure A horizon >20 cm dark grayish brown sandy loam, moderate medium and fine granular structure
  • 27. Site NN -- Soil Structure A horizon 3 cm//6 cm//11 cm dark grayish brown sandy loam, moderate medium and fine granular structure
  • 28. Site MM -- Soil Structure A horizon 8 cm//10 cm//15 cm dark grayish brown loamy fine sand, weak medium and fine granular structure
  • 29. Site LL -- Soil Structure A horizon 2 cm//6 cm//9 cm very dark grayish brown silt loam, moderate medium and fine granular structure
  • 30. Site KK -- Soil Structure A horizon >20 cm dark grayish brown sandy loam, weak medium and fine granular structure
  • 31. Site JJ -- Soil Structure A horizon 13 cm// 20 cm dark grayish brown sandy loam, weak medium and fine granular structure
  • 32. Physical Property Soil Quality Indicator -- Bulk Density Measurement of soil mass for a volume of soil as it appears naturally, including any air space and organic materials. • Determines if soil layers are too compacted to allow root penetration or adequate aeration • soil mass calculated dry • soils with different bulk densities due to different textures may be equally good for plant growth
  • 33. Soil Quality Indicator -- Bulk Density Procedures
  • 34. Bulk Density of all Sites Water > 20 - 30% organic matter mineral soil densities weigh more organic soil densities weigh less OO LL MM JJ 1g/cm3 KK NN Site Bulk Density (g/cm3) Soil Texture Ideal BD for plant growth OO 1.584966 sandy loam < 1.60 NN .749718 sandy loam < 1.60 MM 1.481139 loamy sand < 1.60 LL 1.492541 silty loam < 1.40 KK .918373 sandy loam < 1.60 JJ 1.097283 sandy loam < 1.60
  • 35. Physical Property Soil Quality Indicator -- Soil Temperature Determined by • Heat supply to soil surface > organic soil covering reduces • Dissipation of heat in soil > if soil water content higher, more heat needed for temperature changes Soil temperature changes with depth and time of day. Daily air temperature fluctuations seldom affect soil deeper than 12 - 16” (30 - 40cm).
  • 36. Soil Temperature of all Sites Soil Temp/Site OO NN MM LL KK JJ <=12”depth 72oF 65oF 63oF 66oF 68oF 68oF
  • 37. Soil Temperature of all Sites Soil Temp/Site OO NN MM LL KK JJ 12”depth 68oF 62oF 61oF 64oF 63oF 63oF 18”depth 63oF 60oF 60oF 62oF 63oF 63oF
  • 38. Chemical Property Soil Quality Indicator -- Electrical Conductivity Measurement of soil salinity Factors affecting EC • Porosity: greater porosity more easily electricity conducted • Temperature: decrease in temperature toward freezing point of water soil EC decreases • Precipitation: if too low, usually <15" annually, to provide leaching, most or all soluble salts remain in soil • average Cleveland annual precipitation is 35.4"
  • 39. Chemical Property Soil Quality Indicator -- Soil pH Indication of the acidity or basicity of soil
  • 40. Soil Quality Indicators -- Electrical Conductivity and Soil pH Procedures 1:1 soil-water suspension
  • 41. Electrical Conductivity of all Sites Normal Soils < 4 dS/m Site EC Salinity Class OO .8 dS/m non saline NN .9 dS/m non saline MM 1.6 dS/m very slight saline LL .9 dS/m non saline KK 1.2 dS/m very slight saline JJ .6 dS/m non saline
  • 42. Soil pH of all Sites Soil pH/Site OO NN MM LL KK JJ Sensor 7.3 7.1 7.1 7.8 6.2 6.2 Lab 7.1 6.8 6.8 7.4 6.5 6.3
  • 43. Chemical Property Soil Quality Indicator -- Soil Nutrient Availability Site OO NN MM LL KK JJ lab pH 7.1 6.8 6.8 7.4 6.5 6.3
  • 44. Soil Nutrient Availability of all Sites Lab Analysis Site Measure of Available Soil Nutrients P K Ca Mg OO surplus high medium medium NN high high medium medium MM medium high medium medium LL high high medium medium KK high medium medium medium JJ high medium medium medium Nutrient availability appears good
  • 45. Biological Property Soil Quality Indicator -- Earthworm Density Earthworms important, but not necessary soil organisms in all habitats Earthworm populations vary with food availability and soil conditions Favorable Conditions Unfavorable Conditions Temperature 10 - 20ºC (50 - 68ºF) 25 - 35ºC (77 - 95ºF) Soil properties medium texture sandy/clayey Soil pH 5-7.4 pH <=4.5pH Food source do NOT eat living vegetation conifer needles -- pine elm, ash, & birch litter eaten and spruce hardly eaten more freely than oak & beech Soil disturbance undisturbed soil system Generally, improve soil quality • increase availability of nutrients in soil • accelerate decomposition of organic matter (can be unfavorable, especially in certain hardwood forest habitats) • improve physical properties
  • 46. Soil Quality Indicator -- Earthworm Density Procedures
  • 47. Soil Quality Indicator -- Earthworm Density Procedures
  • 48. Earthworm Density of four of the six Sites No Adults/ Juveniles Site per 13.3cm2 per m2 OO 8 72 NN 7 63 MM 8 72 LL 7 63 (most appeared to be near surface dwellers (epigeic))
  • 49. Do Differently 1. retain core samples taken for soil structure 2. collect more core samples 3. collect more soil samples for soil texture average 4. record slope percentage 5. record soil color as indicators of parent material, organic material, and soil conditions, such as water retention 6. test bulk density using another method to compare results 7. do earthworm sampling in spring or autumn
  • 50. State Soil of Ohio Miamian Soil Consists of very deep, well drained soils that formed in a thin layer of loess and in the underlying loamy till, which is high in content of lime. The original vegetation consisted of deciduous forest species, principally white oak, maple, elm, ash, and hickory. Most extensive soils in Ohio. They occur on more than 750,000 acres in the state. They are productive soils. Corn, soybeans, and winter wheat are the primary crops. The average annual precipitation ranges from 33 to 42 inches. Ap--0 to 23 cm (0 to 9 inches); brown (10YR 4/3) silt loam, pale brown (10YR 6/3) dry; moderate medium subangular blocky structure parting to weak fine granular; friable; common fine roots; 1 percent gravel; neutral; abrupt smooth boundary. [13 to 25 cm (5 to 10 inches) thick]