BMI Growth Chart for Girls Ages 5-19
•
1 like•1,690 views

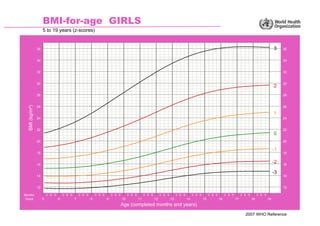
This chart shows BMI-for-age growth curves for girls ages 5 to 19 based on World Health Organization standards from 2007. The y-axis displays BMI in kg/m^2 and the x-axis shows age in months and years. Colored lines on the chart indicate z-scores ranging from -3 to +3 standard deviations from the mean BMI.
Recommended

Recommended
More Related Content
What's hot
What's hot (20)
Similar to BMI Growth Chart for Girls Ages 5-19
Similar to BMI Growth Chart for Girls Ages 5-19 (20)
More from Raul Rojas
More from Raul Rojas (14)
Recently uploaded
Recently uploaded (20)
BMI Growth Chart for Girls Ages 5-19
- 1. BMI-for-age GIRLS 5 to 19 years (z-scores) 36 3 36 34 34 32 32 30 30 2 28 28 BMI (kg/m²) 26 26 1 24 24 22 22 0 20 20 -1 18 18 16 -2 16 -3 14 14 12 12 Months 3 6 9 3 6 9 3 6 9 3 6 9 3 6 9 3 6 9 3 6 9 3 6 9 3 6 9 3 6 9 3 6 9 3 6 9 3 6 9 3 6 9 Years 5 6 7 8 9 10 11 12 13 14 15 16 17 18 19 Age (completed months and years) 2007 WHO Reference