November 2011 Market Watch
•
0 recomendaciones•373 vistas


Recomendados
Recomendados
Más contenido relacionado
La actualidad más candente
La actualidad más candente (12)
Destacado
Destacado (15)
Similar a November 2011 Market Watch
Similar a November 2011 Market Watch (19)
Más de Richard Silver, Certified International REALTOR®
Más de Richard Silver, Certified International REALTOR® (20)
Último
Último (20)
November 2011 Market Watch
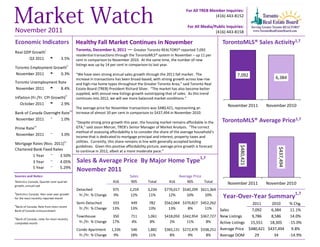
- 1. For All TREB Member Inquiries: (416) 443-8152 For All Media/Public Inquiries: November 2011 (416) 443-8158 Economic Indicators Healthy Fall Market Continues in November TorontoMLS® Sales Activity1,7 Toronto, December 6, 2011 — Greater Toronto REALTORS® reported 7,092 Real GDP Growthi residential transactions through the TorontoMLS® system in November – up 11 per Q3 2011 t 3.5% cent in comparison to November 2010. At the same time, the number of new listings was up by 14 per cent in comparison to last year. Toronto Employment Growthi i November 2011 t 0.3% “We have seen strong annual sales growth through the 2011 fall market. The 7,092 increase in transactions has been broad-based, with strong growth across low-rise 6,384 Toronto Unemployment Rate and high-rise home types throughout the Greater Toronto Area,” said Toronto Real November 2011 t 8.4% Estate Board (TREB) President Richard Silver. “The market has also become better ii supplied, with annual new listings growth outstripping that of sales. As this trend Inflation (Yr./Yr. CPI Growth) continues into 2012, we will see more balanced market conditions.” October 2011 u 2.9% November 2011 November 2010 The average price for November transactions was $480,421, representing an iii Bank of Canada Overnight Rate increase of almost 10 per cent in comparison to $437,494 in November 2010. November 2011 q 1.0% TorontoMLS® Average Price1,7 “Despite strong price growth this year, the housing market remains affordable in the iv GTA,” said Jason Mercer, TREB’s Senior Manager of Market Analysis. “The correct Prime Rate method of assessing affordability is to consider the share of the average household’s November 2011 q 3.0% income that is dedicated to mortgage principal and interest, property taxes and iv utilities. Currently, this share remains in line with generally accepted lending Mortgage Rates (Nov. 2011) guidelines. Given this positive affordability picture, average price growth is forecast $480,421 $437,494 Chartered Bank Fixed Rates to continue in 2012, albeit at a more moderate pace.” 1 Year q 3.50% 1,7 3 Year q 4.05% Sales & Average Price By Major Home Type 5 Year q 5.29% November 2011 Sources and Notes: Sales Average Price i Statistics Canada, Quarter-over-quarter 416 905 Total 416 905 Total November 2011 November 2010 growth, annualized Detached 975 2,259 3,234 $776,017 $540,299 $611,364 ii Statistics Canada, Year-over-year growth 1,7 for the most recently reported month Yr./Yr. % Change 9% 12% 11% 12% 10% 10% Year-Over-Year Summary Semi-Detached 333 449 782 $562,064 $370,827 $452,262 2011 2010 % Chg. iii Bank of Canada, Rate from most recent Yr./Yr. % Change 13% 13% 13% 13% 8% 11% Sales 7,092 6,384 11.1% Bank of Canada announcement iv Townhouse 350 711 1,061 $418,050 $342,954 $367,727 New Listings 9,786 8,586 14.0% Bank of Canada, rates for most recently completed month Yr./Yr. % Change 17% 4% 8% 2% 11% 8% Active Listings 15,551 18,305 -15.0% Condo Apartment 1,336 546 1,882 $365,131 $272,479 $338,251 Average Price $480,421 $437,494 9.8% Yr./Yr. % Change 9% 18% 11% 8% 9% 8% Average DOM 29 34 -14.9%
- 2. Toronto Real Estate Board SALES BY PRICE RANGE AND HOUSE TYPE1,7 NOVEMBER 2011 Price Range Detached Semi-Detached Att/Row/Twnhouse Condo Townhouse Condo Apt Link Co-op Apt Det Condo Co-ownership Apt Total $0 to $99,999 1 0 0 4 21 0 1 0 0 27 $100,000 to $199,999 55 17 8 71 272 3 5 0 3 434 $200,000 to $299,999 274 75 98 179 606 18 1 5 5 1,261 $300,000 to $399,999 580 280 178 191 556 22 2 1 2 1,812 $400,000 to $499,999 652 209 136 52 237 43 0 2 0 1,331 $500,000 to $599,999 551 87 57 21 90 17 1 0 0 824 $600,000 to $699,999 353 50 21 9 48 2 0 0 0 483 $700,000 to $799,999 241 34 7 5 18 0 0 0 0 305 $800,000 to $899,999 123 9 10 1 6 0 0 0 0 149 $900,000 to $999,999 85 2 6 0 7 0 0 0 0 100 $1,000,000 to $1,249,999 132 9 3 3 11 0 0 0 0 158 $1,250,000 to $1,499,999 71 6 1 0 1 0 0 0 0 79 $1,500,000 to $1,749,999 42 2 0 0 0 0 0 0 0 44 $1,750,000 to $1,999,999 25 2 0 0 3 0 0 0 0 30 $2,000,000 + 49 0 0 0 6 0 0 0 0 55 Total Sales 3,234 782 525 536 1,882 105 10 8 10 7,092 Share of Total Sales 45.6% 11.0% 7.4% 7.6% 26.5% 1.5% 0.1% 0.1% 0.1% - Average Price $611,364 $452,262 $416,027 $320,418 $338,251 $403,659 $232,100 $309,700 $239,919 $480,421 SALES BY PRICE RANGE AND HOUSE TYPE1,7 YEAR-TO-DATE, 2011 Price Range Detached Semi-Detached Att/Row/Twnhouse Condo Townhouse Condo Apt Link Co-op Apt Det Condo Co-ownership Apt Total $0 to $99,999 29 3 5 41 213 0 14 0 4 309 $100,000 to $199,999 762 215 80 829 3,085 20 55 4 23 5,073 $200,000 to $299,999 3,581 1,040 1,258 2,378 7,010 330 24 32 40 15,693 $300,000 to $399,999 7,668 3,664 2,356 2,374 6,286 329 21 26 7 22,731 $400,000 to $499,999 8,322 2,638 1,435 543 2,474 510 7 24 0 15,953 $500,000 to $599,999 6,721 806 537 209 976 181 5 7 1 9,443 $600,000 to $699,999 4,438 473 223 126 407 27 0 0 0 5,694 $700,000 to $799,999 2,583 262 93 59 205 3 0 3 0 3,208 $800,000 to $899,999 1,629 122 56 26 86 0 0 2 0 1,921 $900,000 to $999,999 971 43 22 13 56 0 0 0 0 1,105 $1,000,000 to $1,249,999 1,346 70 18 15 90 0 1 0 0 1,540 $1,250,000 to $1,499,999 772 30 10 8 36 0 0 0 0 856 $1,500,000 to $1,749,999 413 18 6 2 32 0 0 0 0 471 $1,750,000 to $1,999,999 237 12 2 0 17 0 0 1 0 269 $2,000,000 + 531 18 0 1 43 0 0 0 0 593 Total Sales 40,003 9,414 6,101 6,624 21,016 1,400 127 99 75 84,859 Share of Total Sales 47.1% 11.1% 7.2% 7.8% 24.8% 1.6% 0.1% 0.1% 0.1% - Average Price $584,457 $432,161 $396,823 $317,947 $331,474 $392,261 $226,731 $386,189 $222,419 $466,357 Page 3 July 2010 Market Watch, November 2011 2
- 3. Toronto Real Estate Board ALL HOME TYPES, NOVEMBER 2011 SUMMARY OF EXISTING HOME TRANSACTIONS ALL TREB AREAS Number of Sales Dollar Volume1 Average Price1 Median Price1 New Listings2 Active Listings3 Avg. SP/LP 4 Avg. DOM5 TREB Total 7,092 $3,407,148,245 $480,421 $400,000 9,786 15,551 98% 29 Halton Region 418 $216,550,081 $518,062 $454,450 514 972 98% 32 Burlington 60 $24,609,220 $410,154 $382,000 56 111 98% 33 Halton Hills 82 $37,812,750 $461,131 $430,000 90 185 98% 42 Milton 118 $51,574,781 $437,074 $404,750 164 223 98% 24 Oakville 158 $102,553,330 $649,072 $571,000 204 453 97% 31 Peel Region 1,405 $583,015,165 $414,957 $372,000 2,118 3,155 98% 27 Brampton 563 $216,847,258 $385,164 $362,000 930 1,321 97% 28 Caledon 55 $30,259,836 $550,179 $489,900 83 248 97% 51 Mississauga 787 $335,908,071 $426,821 $372,000 1,105 1,586 98% 25 City of Toronto 3,028 $1,588,749,233 $524,686 $412,000 4,229 6,281 99% 27 ! TURN PAGE FOR CITY OF TORONTO TABLES OR CLICK HERE: York Region 1,286 $713,570,296 $554,876 $485,000 1,621 2,490 98% 28 Aurora 68 $36,508,452 $536,889 $455,500 82 126 98% 27 E. Gwillimbury 30 $12,649,950 $421,665 $396,250 35 69 97% 34 Georgina 67 $22,160,445 $330,753 $292,000 80 207 95% 41 King 25 $22,927,000 $917,080 $735,000 40 158 95% 69 Markham 326 $182,964,792 $561,242 $495,000 441 596 98% 26 Newmarket 106 $45,336,865 $427,706 $403,050 113 110 98% 25 Richmond Hill 336 $209,335,545 $623,022 $545,300 392 502 98% 25 Vaughan 283 $155,462,197 $549,336 $500,000 370 545 97% 28 Whitchurch-Stouffville 45 $26,225,050 $582,779 $495,000 68 177 97% 34 Durham Region 771 $244,488,740 $317,106 $295,000 1,061 1,902 98% 31 Ajax 135 $45,282,661 $335,427 $318,000 182 241 98% 26 Brock 13 $3,303,000 $254,077 $200,000 29 131 95% 82 Clarington 118 $34,661,540 $293,742 $266,700 156 330 98% 37 Oshawa 226 $61,253,225 $271,032 $247,500 313 538 97% 30 Pickering 102 $37,460,350 $367,258 $344,000 151 234 97% 25 Scugog 22 $6,872,435 $312,383 $294,500 35 94 97% 54 Uxbridge 24 $10,518,700 $438,279 $400,950 32 118 98% 58 Whitby 131 $45,136,829 $344,556 $325,000 163 216 99% 25 Dufferin County 40 $12,218,050 $305,451 $316,500 55 135 98% 36 Orangeville 40 $12,218,050 $305,451 $316,500 55 135 98% 36 Simcoe County 144 $48,556,680 $337,199 $317,300 188 616 97% 54 Adjala-Tosorontio 13 $5,329,000 $409,923 $382,500 24 101 97% 86 Bradford West Gwillimbury 40 $15,408,000 $385,200 $351,500 59 110 98% 39 Essa 10 $3,595,774 $359,577 $295,000 19 84 96% 69 Innisfil 34 $10,743,400 $315,982 $313,500 50 178 97% 61 New Tecumseth 47 $13,480,506 $286,819 $265,000 36 143 97% 49 Page 3 July 2010 Market Watch, November 2011 3
- 4. Toronto Real Estate Board ALL HOME TYPES, NOVEMBER 2011 SUMMARY OF EXISTING HOME TRANSACTIONS CITY OF TORONTO MUNICIPAL BREAKDOWN 1 1 1 2 3 4 5 Number of Sales Dollar Volume Average Price Median Price New Listings Active Listings Avg. SP/LP Avg. DOM TREB Total 7,092 $3,407,148,245 $480,421 $400,000 9,786 15,551 98% 29 City of Toronto Total 3,028 $1,588,749,233 $524,686 $412,000 4,229 6,281 99% 27 Toronto West 757 $330,221,513 $436,224 $382,000 1,119 1,813 99% 30 Toronto W01 65 $33,826,000 $520,400 $494,000 64 86 102% 20 Toronto W02 68 $41,775,873 $614,351 $530,000 104 100 102% 14 Toronto W03 63 $23,875,150 $378,971 $353,000 95 123 98% 32 Toronto W04 71 $22,773,600 $320,755 $300,000 96 191 98% 32 Toronto W05 102 $33,128,700 $324,791 $331,600 155 287 97% 36 Toronto W06 94 $39,457,888 $419,765 $384,650 176 313 99% 31 Toronto W07 32 $18,991,908 $593,497 $587,500 40 41 102% 23 Toronto W08 151 $82,465,444 $546,129 $482,000 205 329 98% 31 Toronto W09 47 $16,177,050 $344,193 $379,500 68 126 97% 39 Toronto W10 64 $17,749,900 $277,342 $287,050 116 217 98% 41 Toronto Central 1,443 $913,247,994 $632,881 $440,500 1,987 2,928 99% 27 Toronto C01 416 $182,075,291 $437,681 $385,000 606 935 99% 28 Toronto C02 67 $71,564,650 $1,068,129 $754,000 98 198 98% 28 Toronto C03 53 $51,294,187 $967,815 $575,000 71 107 99% 24 Toronto C04 95 $96,228,388 $1,012,930 $860,000 131 183 100% 22 Toronto C06 22 $13,032,460 $592,385 $560,000 34 58 100% 22 Toronto C07 108 $55,111,067 $510,288 $431,950 130 194 99% 27 Toronto C08 150 $71,835,422 $478,903 $417,750 164 253 99% 25 Toronto C09 30 $45,310,069 $1,510,336 $1,265,000 40 68 97% 28 Toronto C10 65 $42,865,305 $659,466 $555,000 76 80 100% 23 Toronto C11 33 $16,599,810 $503,025 $238,000 58 74 98% 28 Toronto C12 44 $76,065,220 $1,728,755 $1,584,000 49 125 95% 49 Toronto C13 75 $41,432,715 $552,436 $450,000 91 120 100% 24 Toronto C14 167 $88,474,102 $529,785 $370,000 263 296 100% 26 Toronto C15 118 $61,359,308 $519,994 $442,400 176 237 100% 27 Toronto East 828 $345,279,726 $417,005 $390,800 1,123 1,540 100% 24 Toronto E01 87 $48,188,890 $553,895 $524,500 122 120 101% 15 Toronto E02 72 $43,301,583 $601,411 $572,475 85 89 101% 18 Toronto E03 100 $49,272,159 $492,722 $469,957 122 123 102% 17 Toronto E04 89 $29,207,040 $328,169 $350,100 136 198 99% 24 Toronto E05 99 $36,437,333 $368,054 $330,000 123 122 99% 23 Toronto E06 25 $14,310,500 $572,420 $485,000 29 52 97% 24 Toronto E07 83 $28,338,655 $341,430 $310,000 121 218 98% 33 Toronto E08 47 $20,525,600 $436,715 $375,000 75 111 98% 26 Toronto E09 94 $31,016,128 $329,959 $350,000 138 233 98% 25 Toronto E10 52 $20,114,150 $386,811 $386,250 65 97 98% 24 Toronto E11 80 $24,567,688 $307,096 $297,944 107 177 98% 30 Page 3 July 2010 Market Watch, November 2011 4
- 5. Toronto Real Estate Board ALL HOME TYPES, YEAR-TO-DATE 2011 SUMMARY OF EXISTING HOME TRANSACTIONS ALL TREB AREAS Number of Sales Dollar Volume1 Average Price1 Median Price1 New Listings2 Avg. SP/LP 4 Avg. DOM5 TREB Total 84,859 $39,574,621,782 $466,357 $392,000 142,479 99% 25 Halton Region 4,967 $2,575,893,629 $518,601 $440,000 8,100 98% 27 Burlington 607 $262,015,664 $431,657 $370,000 915 97% 30 Halton Hills 896 $394,941,591 $440,783 $410,000 1,369 98% 32 Milton 1,512 $648,009,094 $428,577 $404,950 2,421 99% 20 Oakville 1,952 $1,270,927,280 $651,090 $550,000 3,395 97% 29 Peel Region 17,895 $7,304,502,279 $408,187 $371,000 30,109 98% 23 Brampton 7,216 $2,738,357,734 $379,484 $360,000 12,450 98% 23 Caledon 765 $395,340,255 $516,785 $460,000 1,401 97% 32 Mississauga 9,914 $4,170,804,290 $420,698 $376,000 16,258 98% 23 City of Toronto 34,122 $17,194,227,035 $503,904 $400,000 58,071 100% 24 ! TURN PAGE FOR CITY OF TORONTO TABLES OR CLICK HERE: York Region 16,192 $8,763,968,331 $541,253 $482,000 25,863 98% 24 Aurora 932 $491,904,764 $527,795 $447,000 1,372 98% 25 E. Gwillimbury 271 $120,117,778 $443,239 $387,000 479 97% 38 Georgina 812 $234,257,733 $288,495 $270,000 1,406 97% 42 King 232 $185,652,377 $800,226 $681,500 584 94% 54 Markham 4,295 $2,408,769,238 $560,831 $505,000 6,802 99% 20 Newmarket 1,352 $563,668,743 $416,915 $385,325 1,819 98% 24 Richmond Hill 4,195 $2,514,833,579 $599,484 $545,000 6,776 99% 21 Vaughan 3,391 $1,853,252,579 $546,521 $495,000 5,401 98% 24 Whitchurch-Stouffville 712 $391,511,540 $549,876 $460,000 1,224 97% 34 Durham Region 9,347 $2,966,582,122 $317,383 $293,000 16,257 98% 30 Ajax 1,680 $581,269,189 $345,994 $328,250 2,833 98% 25 Brock 171 $41,755,357 $244,183 $219,000 458 95% 70 Clarington 1,377 $388,771,634 $282,332 $262,900 2,519 98% 33 Oshawa 2,713 $725,575,965 $267,444 $246,000 4,749 98% 31 Pickering 1,252 $472,352,226 $377,278 $345,000 2,033 98% 25 Scugog 288 $102,056,969 $354,364 $318,750 565 97% 53 Uxbridge 323 $146,821,810 $454,557 $409,000 616 97% 52 Whitby 1,543 $507,978,972 $329,215 $315,000 2,484 98% 23 Dufferin County 564 $180,307,981 $319,695 $299,625 882 98% 35 Orangeville 564 $180,307,981 $319,695 $299,625 882 98% 35 Simcoe County 1,772 $589,140,405 $332,472 $300,000 3,197 97% 51 Adjala-Tosorontio 141 $59,390,750 $421,211 $382,500 326 97% 72 Bradford West Gwillimbury 489 $177,102,927 $362,174 $341,000 747 98% 36 Essa 223 $65,006,705 $291,510 $253,000 451 97% 57 Innisfil 433 $136,823,105 $315,989 $281,500 879 96% 58 New Tecumseth 486 $150,816,918 $310,323 $285,000 794 97% 50 Page 3 July 2010 Market Watch, November 2011 5
- 6. Toronto Real Estate Board ALL HOME TYPES, YEAR-TO-DATE 2011 SUMMARY OF EXISTING HOME TRANSACTIONS CITY OF TORONTO MUNICIPAL BREAKDOWN 1 1 1 2 4 5 Number of Sales Dollar Volume Average Price Median Price New Listings Avg. SP/LP Avg. DOM TREB Total 84,859 $39,574,621,782 $466,357 $392,000 142,479 99% 25 City of Toronto Total 34,122 $17,194,227,035 $503,904 $400,000 58,071 100% 24 Toronto West 8,223 $3,591,134,758 $436,718 $380,000 14,548 99% 27 Toronto W01 690 $367,419,440 $532,492 $438,950 1,151 102% 21 Toronto W02 803 $435,544,596 $542,397 $490,000 1,184 102% 16 Toronto W03 715 $250,993,822 $351,040 $345,000 1,232 99% 26 Toronto W04 754 $255,039,398 $338,249 $328,000 1,354 98% 32 Toronto W05 1,034 $346,333,636 $334,945 $340,000 1,984 97% 35 Toronto W06 1,085 $463,234,020 $426,944 $398,000 2,156 99% 29 Toronto W07 508 $288,696,008 $568,299 $547,844 717 100% 22 Toronto W08 1,258 $745,177,982 $592,351 $505,000 2,211 99% 25 Toronto W09 492 $190,833,241 $387,872 $409,000 935 99% 34 Toronto W10 884 $247,862,615 $280,388 $290,000 1,624 97% 31 Toronto Central 16,274 $9,717,431,530 $597,114 $429,000 27,594 99% 24 Toronto C01 4,559 $1,979,438,642 $434,183 $380,000 8,397 99% 27 Toronto C02 785 $720,441,222 $917,760 $685,000 1,404 99% 25 Toronto C03 542 $467,333,593 $862,239 $576,250 935 99% 25 Toronto C04 981 $921,477,543 $939,325 $835,000 1,642 100% 20 Toronto C06 337 $185,910,735 $551,664 $537,500 564 99% 22 Toronto C07 1,287 $643,628,672 $500,100 $408,000 2,014 99% 23 Toronto C08 1,621 $700,327,719 $432,034 $382,000 2,635 99% 24 Toronto C09 356 $447,218,514 $1,256,232 $930,000 562 99% 24 Toronto C10 831 $640,676,016 $770,970 $575,000 1,221 100% 21 Toronto C11 410 $242,894,173 $592,425 $417,500 671 101% 24 Toronto C12 407 $640,349,050 $1,573,339 $1,314,000 776 96% 32 Toronto C13 735 $360,614,664 $490,632 $399,000 1,183 100% 23 Toronto C14 2,049 $1,092,138,660 $533,011 $399,800 3,314 100% 22 Toronto C15 1,374 $674,982,327 $491,254 $421,500 2,276 100% 23 Toronto East 9,625 $3,885,660,747 $403,705 $378,000 15,929 100% 22 Toronto E01 861 $470,550,627 $546,516 $524,000 1,436 103% 14 Toronto E02 833 $520,638,990 $625,017 $545,300 1,344 101% 14 Toronto E03 1,132 $513,982,359 $454,048 $440,000 1,826 101% 19 Toronto E04 975 $317,390,405 $325,529 $348,000 1,646 99% 22 Toronto E05 1,069 $395,203,030 $369,694 $332,800 1,559 101% 19 Toronto E06 511 $232,292,305 $454,584 $403,600 830 99% 21 Toronto E07 936 $344,408,238 $367,958 $362,000 1,644 100% 22 Toronto E08 721 $266,624,914 $369,799 $350,000 1,191 98% 29 Toronto E09 1,144 $337,957,026 $295,417 $286,500 2,000 98% 27 Toronto E10 519 $209,775,737 $404,192 $400,000 847 99% 22 Toronto E11 924 $276,837,116 $299,607 $290,000 1,606 98% 29 Page 3 July 2010 Market Watch, November 2011 6
- 7. Toronto Real Estate Board DETACHED HOUSES, NOVEMBER 2011 Industrial Leasing SUMMARY OF EXISTING HOME TRANSACTIONS ALL TREB AREAS Sales1 Dollar Volume1 Average Price1 Median Price1 New Listings2 Active Listings3 Avg. SP/LP 4 Avg. DOM5 TREB Total 3,234 - $1,977,151,713 - $611,364 - $510,050 - 4,436 - 7,795 - 98% - 29 - Halton Region 258 $159,320,548 $617,522 $543,750 338 734 97% 35 Burlington 26 $13,986,020 $537,924 $545,250 34 80 98% 33 Halton Hills 68 $33,806,550 $497,155 $471,250 73 165 98% 44 Milton 59 $30,842,181 $522,749 $497,500 93 162 97% 30 Oakville 105 - $80,685,797 - $768,436 - $665,000 - 138 - 327 - 97% - 32 - Peel Region 604 $334,410,995 $553,661 $510,000 997 1,704 97% 28 Brampton 302 $139,056,508 $460,452 $445,500 528 821 97% 28 Caledon 47 $27,355,225 $582,026 $538,500 71 230 97% 55 Mississauga 255 - $167,999,262 - $658,821 - $575,000 - 398 - 653 - 98% - 23 - City of Toronto 975 $756,616,355 $776,017 $592,000 1,266 1,658 99% 22 ! TURN PAGE FOR CITY OF TORONTO TABLES OR CLICK HERE: - - - - - - - - York Region 721 $489,428,784 $678,819 $600,000 907 1,640 97% 30 Aurora 40 $25,390,552 $634,764 $599,000 51 85 98% 26 E. Gwillimbury 25 $11,048,400 $441,936 $421,000 29 65 97% 38 Georgina 60 $20,188,545 $336,476 $300,000 68 195 95% 43 King 23 $22,122,000 $961,826 $789,000 39 147 95% 68 Markham 143 $105,865,639 $740,319 $659,000 193 281 98% 28 Newmarket 65 $31,955,005 $491,615 $472,000 64 69 97% 28 Richmond Hill 180 $146,671,557 $814,842 $722,000 216 319 97% 24 Vaughan 148 $103,053,036 $696,304 $594,000 207 329 97% 28 Whitchurch-Stouffville 37 - $23,134,050 - $625,245 - $515,000 - 40 - 150 - 96% - 39 - Durham Region 534 $187,008,925 $350,204 $330,250 728 1,417 98% 33 Ajax 83 $31,209,686 $376,020 $360,000 109 140 98% 25 Brock 13 $3,303,000 $254,077 $200,000 26 123 95% 82 Clarington 92 $29,215,950 $317,565 $284,500 116 246 98% 36 Oshawa 161 $48,520,025 $301,367 $285,000 227 409 97% 31 Pickering 57 $25,031,650 $439,152 $400,000 81 151 97% 27 Scugog 21 $6,688,935 $318,521 $295,000 33 92 97% 55 Uxbridge 21 $9,767,800 $465,133 $445,000 28 103 98% 63 Whitby 86 - $33,271,879 - $386,882 - $375,000 - 108 - 153 - 99% - 26 - Dufferin County 31 $10,301,800 $332,316 $337,500 43 97 98% 39 Orangeville 31 - $10,301,800 - $332,316 - $337,500 - 43 - 97 - 98% - 39 - Simcoe County 111 $40,064,306 $360,940 $323,500 157 545 97% 58 Adjala-Tosorontio 13 $5,329,000 $409,923 $382,500 24 101 97% 86 Bradford West Gwillimbury 32 $12,822,000 $400,688 $422,500 45 93 98% 44 Essa 7 $2,956,800 $422,400 $345,000 15 71 96% 72 Innisfil 30 $9,880,500 $329,350 $320,750 49 175 97% 66 New Tecumseth 29 $9,076,006 $312,966 $282,500 24 105 97% 50 Page 3 July 2010 Market Watch, November 2011 7
- 8. Toronto Real Estate Board DETACHED HOUSES, NOVEMBER 2011 Industrial Leasing SUMMARY OF EXISTING HOME TRANSACTIONS CITY OF TORONTO MUNICIPAL BREAKDOWN Sales1 Dollar Volume1 Average Price1 Median Price1 New Listings2 Active Listings3 Avg. SP/LP 4 Avg. DOM5 TREB Total 3,234 $1,977,151,713 $611,364 $510,050 4,436 7,795 98% 29 City of Toronto Total 975 $756,616,355 $776,017 $592,000 1,266 1,658 99% 22 Toronto West 299 $178,435,009 $596,773 $515,000 404 586 99% 24 Toronto W01 15 $12,437,800 $829,187 $831,000 13 19 105% 16 Toronto W02 24 $20,428,500 $851,188 $773,500 35 31 103% 14 Toronto W03 35 $14,436,850 $412,481 $370,000 47 64 98% 30 Toronto W04 29 $12,943,500 $446,328 $422,500 49 95 99% 26 Toronto W05 25 $11,890,000 $475,600 $457,000 37 55 96% 33 Toronto W06 33 $16,345,000 $495,303 $453,000 43 54 100% 20 Toronto W07 25 $16,246,408 $649,856 $636,800 33 29 102% 16 Toronto W08 64 $51,238,651 $800,604 $702,500 78 131 98% 24 Toronto W09 22 $12,070,500 $548,659 $532,500 29 47 97% 24 Toronto W10 27 $10,397,800 $385,104 $381,000 40 61 99% 33 Toronto Central 317 $392,777,428 $1,239,046 $985,000 428 593 99% 21 Toronto C01 4 $2,696,245 $674,061 $639,500 10 7 100% 17 Toronto C02 12 $17,839,000 $1,486,583 $1,472,500 23 38 101% 23 Toronto C03 22 $33,509,700 $1,523,168 $971,000 36 63 97% 18 Toronto C04 71 $84,743,500 $1,193,570 $1,100,000 85 116 100% 18 Toronto C06 13 $9,733,270 $748,713 $680,000 25 32 100% 12 Toronto C07 38 $28,892,579 $760,331 $679,500 43 70 99% 22 Toronto C08 1 $692,000 $692,000 $692,000 4 7 99% 19 Toronto C09 15 $34,123,069 $2,274,871 $1,750,000 10 26 98% 29 Toronto C10 15 $16,366,000 $1,091,067 $925,000 21 15 102% 12 Toronto C11 9 $10,184,011 $1,131,557 $960,011 17 20 97% 15 Toronto C12 29 $65,498,220 $2,258,559 $2,000,000 34 92 95% 43 Toronto C13 23 $22,858,850 $993,863 $870,000 28 27 101% 20 Toronto C14 31 $36,790,276 $1,186,783 $1,157,000 49 43 102% 18 Toronto C15 34 $28,850,708 $848,550 $753,450 43 37 102% 19 Toronto East 359 $185,403,918 $516,445 $455,000 434 479 99% 20 Toronto E01 17 $12,119,900 $712,935 $625,000 22 22 100% 13 Toronto E02 28 $18,651,000 $666,107 $630,500 27 30 101% 22 Toronto E03 60 $33,170,907 $552,848 $500,250 76 67 102% 15 Toronto E04 46 $18,373,500 $399,424 $402,000 60 67 99% 18 Toronto E05 23 $13,539,600 $588,678 $580,000 37 37 100% 19 Toronto E06 20 $12,631,500 $631,575 $530,250 25 42 97% 22 Toronto E07 24 $12,239,875 $509,995 $516,500 24 24 98% 24 Toronto E08 32 $17,216,000 $538,000 $458,000 35 43 99% 22 Toronto E09 51 $20,883,598 $409,482 $403,500 46 44 99% 20 Toronto E10 34 $15,978,650 $469,960 $454,250 42 54 98% 21 Toronto E11 24 $10,599,388 $441,641 $459,000 40 49 98% 29 Page 3 July 2010 Market Watch, November 2011 8
- 9. Toronto Real Estate Board SEMI-DETACHED HOUSES, NOVEMBER 2011 Industrial Leasing SUMMARY OF EXISTING HOME TRANSACTIONS ALL TREB AREAS Sales1 Dollar Volume1 Average Price1 Median Price1 New Listings2 Active Listings3 Avg. SP/LP 4 Avg. DOM5 TREB Total 782 - $353,668,617 - $452,262 - $408,000 - 1,014 - 917 - 100% - 20 - Halton Region 36 $14,268,500 $396,347 $375,000 46 40 98% 15 Burlington 6 $2,184,900 $364,150 $360,500 2 1 98% 11 Halton Hills 1 $367,000 $367,000 $367,000 3 3 97% 8 Milton 20 $7,691,300 $384,565 $375,000 31 25 99% 11 Oakville 9- $4,025,300 - $447,256 - $455,000 - 10 - 11 - 98% - 27 - Peel Region 244 $89,757,339 $367,858 $361,900 328 311 98% 24 Brampton 126 $42,530,899 $337,547 $336,500 182 173 98% 26 Caledon 3 $1,131,000 $377,000 $362,000 7 6 99% 17 Mississauga 115 - $46,095,440 - $400,830 - $397,900 - 139 - 132 - 98% - 22 - City of Toronto 333 $187,167,303 $562,064 $508,000 428 363 101% 18 ! TURN PAGE FOR CITY OF TORONTO TABLES OR CLICK HERE: - - - - - - - - York Region 110 $47,966,350 $436,058 $442,750 123 100 99% 20 Aurora 10 $3,814,000 $381,400 $366,750 6 2 99% 21 E. Gwillimbury - - - - - - - - Georgina 1 $287,000 $287,000 $287,000 3 4 99% 17 King - - - - - - - - Markham 41 $18,340,800 $447,337 $443,000 32 27 99% 24 Newmarket 14 $4,673,000 $333,786 $342,500 19 14 98% 22 Richmond Hill 18 $8,854,000 $491,889 $489,000 19 9 98% 21 Vaughan 22 $10,377,550 $471,707 $465,000 29 27 100% 12 Whitchurch-Stouffville 4- $1,620,000 - $405,000 - $404,500 - 15 - 17 - 101% - 15 - Durham Region 49 $11,832,125 $241,472 $221,000 78 84 98% 19 Ajax 9 $2,593,425 $288,158 $294,000 14 14 97% 20 Brock - - - - - - - - Clarington 5 $958,900 $191,780 $182,500 1 3 96% 20 Oshawa 21 $3,939,900 $187,614 $193,000 30 42 97% 21 Pickering 9 $3,023,400 $335,933 $325,000 25 18 100% 13 Scugog 1 $183,500 $183,500 $183,500 1 1 93% 31 Uxbridge - - - - 1 3 - - Whitby 4- $1,133,000 - $283,250 - $285,750 - 6- 3- 98% - 16 - Dufferin County 3 $721,000 $240,333 $229,000 4 8 97% 19 Orangeville 3 - $721,000 - $240,333 - $229,000 - 4 - 8 - 97% - 19 - Simcoe County 7 $1,956,000 $279,429 $265,000 7 11 98% 30 Adjala-Tosorontio - - - - - - - - Bradford West Gwillimbury 4 $1,270,000 $317,500 $305,000 4 6 98% 29 Essa - - - - 1 2 - - Innisfil - - - - - - - - New Tecumseth 3 $686,000 $228,667 $232,000 2 3 97% 31 Page 3 July 2010 Market Watch, November 2011 9
- 10. Toronto Real Estate Board SEMI-DETACHED HOUSES, NOVEMBER 2011 Industrial Leasing SUMMARY OF EXISTING HOME TRANSACTIONS CITY OF TORONTO MUNICIPAL BREAKDOWN Sales1 Dollar Volume1 Average Price1 Median Price1 New Listings2 Active Listings3 Avg. SP/LP 4 Avg. DOM5 TREB Total 782 $353,668,617 $452,262 $408,000 1,014 917 100% 20 City of Toronto Total 333 $187,167,303 $562,064 $508,000 428 363 101% 18 Toronto West 116 $52,391,273 $451,649 $414,000 138 141 100% 23 Toronto W01 13 $8,287,800 $637,523 $640,000 11 4 102% 13 Toronto W02 27 $14,708,173 $544,747 $520,500 31 20 103% 13 Toronto W03 19 $7,387,500 $388,816 $370,000 36 38 97% 32 Toronto W04 6 $2,258,000 $376,333 $378,500 4 6 97% 28 Toronto W05 32 $11,663,400 $364,481 $361,850 37 53 98% 29 Toronto W06 8 $3,528,000 $441,000 $442,750 6 6 98% 22 Toronto W07 1 $500,000 $500,000 $500,000 2 1 102% 5 Toronto W08 4 $1,892,400 $473,100 $460,000 4 3 100% 23 Toronto W09 1 $379,500 $379,500 $379,500 1 4 95% 34 Toronto W10 5 $1,786,500 $357,300 $350,000 6 6 97% 22 Toronto Central 100 $75,837,815 $758,378 $660,000 117 90 101% 17 Toronto C01 17 $12,698,090 $746,946 $665,000 21 16 103% 15 Toronto C02 16 $17,274,500 $1,079,656 $1,075,000 14 13 98% 25 Toronto C03 13 $8,436,400 $648,954 $521,000 18 18 106% 14 Toronto C04 5 $3,410,888 $682,178 $705,000 8 4 102% 4 Toronto C06 - - - - - - - - Toronto C07 4 $1,912,000 $478,000 $473,500 5 2 101% 12 Toronto C08 11 $8,722,900 $792,991 $775,000 7 9 100% 31 Toronto C09 3 $4,570,000 $1,523,333 $1,420,000 5 6 95% 11 Toronto C10 10 $7,143,705 $714,371 $698,000 13 7 102% 11 Toronto C11 3 $2,054,500 $684,833 $710,500 3 - 105% 7 Toronto C12 1 $1,030,000 $1,030,000 $1,030,000 - - 96% 44 Toronto C13 7 $3,404,832 $486,405 $426,132 11 8 99% 10 Toronto C14 - - - - - - - - Toronto C15 10 $5,180,000 $518,000 $514,000 12 7 101% 15 Toronto East 117 $58,938,215 $503,745 $472,000 173 132 102% 14 Toronto E01 37 $20,732,700 $560,343 $552,000 59 43 102% 11 Toronto E02 29 $15,804,683 $544,989 $562,000 36 26 102% 15 Toronto E03 25 $12,587,352 $503,494 $470,013 33 19 104% 13 Toronto E04 3 $920,100 $306,700 $290,000 12 9 102% 8 Toronto E05 8 $3,436,000 $429,500 $415,000 4 2 100% 17 Toronto E06 - - - - 1 3 - - Toronto E07 3 $1,252,380 $417,460 $428,000 8 6 99% 24 Toronto E08 - - - - 2 3 - - Toronto E09 1 $292,000 $292,000 $292,000 3 3 96% 8 Toronto E10 3 $1,045,000 $348,333 $321,000 6 6 99% 12 Toronto E11 8 $2,868,000 $358,500 $355,000 9 12 97% 28 Page 3 July 2010 Market Watch, November 2011 10
- 11. Toronto Real Estate Board CONDOMINIUM TOWNHOUSES, NOVEMBER 2011 Industrial Leasing SUMMARY OF EXISTING HOME TRANSACTIONS ALL TREB AREAS Sales1 Dollar Volume1 Average Price1 Median Price1 New Listings2 Active Listings3 Avg. SP/LP 4 Avg. DOM5 TREB Total 536 - $171,744,060 - $320,418 - $309,750 - 713 - 1,050 - 98% - 30 - Halton Region 26 $7,572,500 $291,250 $280,500 28 40 97% 37 Burlington 15 $4,419,500 $294,633 $281,000 8 9 97% 39 Halton Hills 4 $910,500 $227,625 $234,000 6 9 97% 40 Milton 2 $502,000 $251,000 $251,000 2 3 99% 48 Oakville 5- $1,740,500 - $348,100 - $335,000 - 12 - 19 - 98% - 26 - Peel Region 184 $55,411,375 $301,149 $298,000 247 347 98% 26 Brampton 41 $9,996,500 $243,817 $228,000 59 104 98% 28 Caledon 1 $312,000 $312,000 $312,000 2 4 95% 37 Mississauga 142 - $45,102,875 - $317,626 - $326,000 - 186 - 239 - 98% - 26 - City of Toronto 227 $77,849,083 $342,948 $323,000 286 414 98% 31 ! TURN PAGE FOR CITY OF TORONTO TABLES OR CLICK HERE: - - - - - - - - York Region 57 $22,267,252 $390,654 $378,800 78 112 98% 33 Aurora 5 $2,280,500 $456,100 $434,500 10 13 98% 67 E. Gwillimbury - - - - - - - - Georgina 1 $224,000 $224,000 $224,000 2 5 97% 34 King 1 $475,000 $475,000 $475,000 1 1 95% 160 Markham 24 $9,634,180 $401,424 $384,000 30 50 98% 30 Newmarket 7 $1,935,072 $276,439 $262,500 12 8 99% 30 Richmond Hill 9 $3,606,000 $400,667 $397,500 12 18 98% 22 Vaughan 10 $4,112,500 $411,250 $387,500 10 14 99% 24 Whitchurch-Stouffville - - - - - - - - 1- 3- - - - - Durham Region 39 $8,025,850 $205,791 $215,000 70 127 97% 33 Ajax 9 $2,093,150 $232,572 $234,250 19 27 97% 34 Brock - - - - 3 6 - - Clarington 3 $572,900 $190,967 $169,900 4 14 96% 50 Oshawa 12 $1,867,400 $155,617 $155,000 21 31 98% 47 Pickering 9 $2,142,900 $238,100 $225,000 19 34 98% 19 Scugog - - - - - - - - Uxbridge - - - - - 4 - - Whitby 6- $1,349,500 - $224,917 - $228,000 - 4- 11 - 98% - 17 - Dufferin County 2 $383,000 $191,500 $191,500 3 5 99% 37 Orangeville 2 - $383,000 - $191,500 - $191,500 - 3 - 5 - 99% - 37 - Simcoe County 1 $235,000 $235,000 $235,000 1 5 100% 34 Adjala-Tosorontio - - - - - - - - Bradford West Gwillimbury - - - - - - - - Essa - - - - - - - - Innisfil - - - - - - - - New Tecumseth 1 $235,000 $235,000 $235,000 1 5 100% 34 Page 3 July 2010 Market Watch, November 2011 11
- 12. Toronto Real Estate Board CONDOMINIUM TOWNHOUSES, NOVEMBER 2011 Industrial Leasing SUMMARY OF EXISTING HOME TRANSACTIONS CITY OF TORONTO MUNICIPAL BREAKDOWN Sales1 Dollar Volume1 Average Price1 Median Price1 New Listings2 Active Listings3 Avg. SP/LP 4 Avg. DOM5 TREB Total 536 $171,744,060 $320,418 $309,750 713 1,050 98% 30 City of Toronto Total 227 $77,849,083 $342,948 $323,000 286 414 98% 31 Toronto West 68 $19,690,113 $289,560 $276,500 78 131 97% 41 Toronto W01 9 $3,557,500 $395,278 $385,000 6 7 98% 23 Toronto W02 3 $1,147,500 $382,500 $385,000 7 8 99% 9 Toronto W03 - - - - 1 6 - - Toronto W04 10 $2,494,900 $249,490 $237,750 7 15 97% 36 Toronto W05 18 $3,870,900 $215,050 $204,750 25 50 97% 44 Toronto W06 8 $3,344,900 $418,113 $376,450 3 5 99% 22 Toronto W07 1 $245,000 $245,000 $245,000 - - 92% 67 Toronto W08 7 $2,520,013 $360,002 $375,000 9 12 98% 82 Toronto W09 2 $1,005,000 $502,500 $502,500 6 9 97% 35 Toronto W10 10 $1,504,400 $150,440 $171,000 14 19 96% 56 Toronto Central 86 $37,465,000 $435,640 $385,425 100 118 98% 23 Toronto C01 25 $10,438,500 $417,540 $369,000 19 28 99% 24 Toronto C02 1 $730,000 $730,000 $730,000 3 8 97% 2 Toronto C03 - - - - - - - - Toronto C04 1 $1,115,000 $1,115,000 $1,115,000 1 - 97% 15 Toronto C06 - - - - - - - - Toronto C07 7 $2,838,500 $405,500 $369,500 8 10 97% 25 Toronto C08 7 $3,100,700 $442,957 $380,000 3 6 99% 16 Toronto C09 - - - - 1 2 - - Toronto C10 2 $795,000 $397,500 $397,500 3 2 98% 27 Toronto C11 2 $333,500 $166,750 $166,750 5 7 96% 12 Toronto C12 3 $1,739,500 $579,833 $550,000 4 6 97% 34 Toronto C13 2 $1,036,800 $518,400 $518,400 3 3 97% 13 Toronto C14 12 $5,946,700 $495,558 $492,150 24 20 99% 28 Toronto C15 24 $9,390,800 $391,283 $364,700 26 26 99% 24 Toronto East 73 $20,693,970 $283,479 $285,000 108 165 98% 30 Toronto E01 6 $2,179,000 $363,167 $339,500 2 7 98% 26 Toronto E02 2 $1,172,000 $586,000 $586,000 10 16 97% 25 Toronto E03 1 $165,000 $165,000 $165,000 1 2 98% 23 Toronto E04 10 $3,156,890 $315,689 $310,950 22 24 98% 35 Toronto E05 17 $4,994,650 $293,803 $296,000 17 19 98% 26 Toronto E06 - - - - - - - - Toronto E07 6 $1,857,100 $309,517 $299,400 10 17 97% 30 Toronto E08 4 $1,161,100 $290,275 $278,450 11 16 98% 36 Toronto E09 4 $614,630 $153,658 $132,315 11 20 96% 12 Toronto E10 6 $1,332,600 $222,100 $203,100 7 15 98% 40 Toronto E11 17 $4,061,000 $238,882 $230,000 17 29 98% 34 Page 3 July 2010 Market Watch, November 2011 12