Examining The Impacts of Hurricane Sandy on Rhode Island: A serious wake up call
•
2 likes•2,470 views

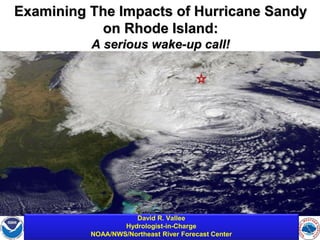
Examining The Impacts of Hurricane Sandy on Rhode Island: A serious wake-up call! This presentation was given by David R. Vallee (Hydrologist-in-Charge, NOAA/NWS/Northeast River Forecast Center) at the Shoreline Change SAMP Stakeholder Meeting on April 4th, 2013.

Recommended
Recommended
More Related Content
What's hot
What's hot (20)
Similar to Examining The Impacts of Hurricane Sandy on Rhode Island: A serious wake up call
Similar to Examining The Impacts of Hurricane Sandy on Rhode Island: A serious wake up call (20)
More from riseagrant
More from riseagrant (20)
Recently uploaded
Recently uploaded (20)
Examining The Impacts of Hurricane Sandy on Rhode Island: A serious wake up call
- 1. Examining The Impacts of Hurricane Sandy on Rhode Island: A serious wake-up call! David R. Vallee National Oceanic and Atmospheric Administration’s Hydrologist-in-Charge Northeast River Forecast Center National Weather Service NOAA/NWS/Northeast River Forecast Center Taunton, MA
- 2. Objectives for this session: Quick overview of the atmospheric “chess board” Why did we have so much damage on the south coast? Placing it in comparison with some of our historical Hurricanes National Oceanic and Atmospheric Administration’s Northeast River Forecast Center National Weather Service Taunton, MA
- 3. Consider The Past Two Seasons: IRENE SANDY Irene: Widespread wind damage & power disruption but we were spared flooding rains & significant coastal flooding o “It’s all about the wind and rain!” Sandy: Significant coastal flooding but with less wind and little if any rain o “It’s all about the coastal flooding!” National Oceanic and Atmospheric Administration’s Northeast River Forecast Center National Weather Service Taunton, MA
- 4. Sandy: A Perfect Storm of Sorts Formed in the western Caribbean o Not at all unusual for late October Encountered a very deep trough of Low Pressure in the eastern United States and very strong High Pressure moving southward from the Canadian Maritimes o A winter-type dual jet stream set up (classic for a New England Hurricane) o Captured Sandy & blocked her attempt to race out to sea National Oceanic and Atmospheric Administration’s Northeast River Forecast Center National Weather Service Taunton, MA
- 5. Irene’s Winds vs. Sandy’s Winds IRENE’s Winds Sandy’s Winds Hurricane Force Wind Gusts Image: R .Hart, FSU * Irene’s winds were predominantly from the southeast • National Oceanic and Atmospheric Administration’s Sandy’s were mostly northeast – except southern RI late Monday afternoon • Difference between widespread damage vs. scattered shorter duration damage National Weather Service
- 6. Southeast Vs. Northeast Wind Direction What a difference it makes! RI is not “weathered” for southeast high wind events o Nor is our vegetation! Wind Frequency and Average Speed by Direction August through October http://windhistory.com National Oceanic and Atmospheric Administration’s Northeast River Forecast Center National Weather Service Taunton, MA
- 7. Long Duration Southeast Fetch Damaging Waves, Multiple Tide Cycles & a 4-5 ft Storm Surge Southeast swells built on 2 days of southeast winds were driven right into the south coast of RI o Impacted Multiple Tide Cycles – worst of which was Monday night o 15-30 foot seas resulted in relentless pounding surf which first weakened then obliterated the 6-10 foot dunes along parts of the coast o Storm surge of 4-5 feet atop a “middle-of-the-road” astronomical tide produce a total water level (storm tide) of 9.6 feet; One foot shy of Hurricane Bob in ’91 o What she lacked in intensity she made up for in duration!
- 8. Misquamicut Before National Oceanic and Atmospheric Administration’s National Weather Service
- 9. Misquamicut After National Oceanic and Atmospheric Administration’s National Weather Service
- 10. What did it look like? National Oceanic and Atmospheric Administration’s National Weather Service
- 11. National Oceanic and Atmospheric Administration’s National Weather Service
- 12. What did it look like? National Oceanic and Atmospheric Administration’s National Weather Service
- 13. What should we be expecting on Atlantic Ave, Westerly, RI? USACE Hurricane Inundation Maps - RI & E coast MA recently updated, Buzz. Bay = June/July National Oceanic and Atmospheric Administration’s - MA/RI maps & GIS layers are available at: National Weather Service - http://www.nae.usace.army.mil/projects/hes/
- 14. What did it look like in 1954? National Oceanic and Atmospheric Administration’s Photo:National Weather Service Courtesy of J. Freedman, CRMC
- 15. Area Pre-Sandy 2012 Category 2 Inundation Category 1 Inundation National Oceanic and Atmospheric Administration’s National Weather Service
- 16. Area Pre-Sandy 2012 National Oceanic and Atmospheric Administration’s National Weather Service
- 17. National Oceanic and Atmospheric Administration’s National Weather Service
- 18. Homes floated off foundations National Oceanic and Atmospheric Administration’s National Weather Service
- 19. Makes me wonder how many homes are not anchored down! National Oceanic and Atmospheric Administration’s National Weather Service
- 20. Rhode Island Was Spared The Worst IRENE SANDY We are a tremendously vulnerable State o Planning is of the utmost importance – it must reflect storm events that will undoubtedly far exceed the damage from Irene & Sandy Shifts in precipitation frequency o Steadily increasing annual rainfall and frequency of heavy rain events o 1% / 100 yr storm in the 1960s is now a 2% / 50 yr event! o Small urban watersheds (Pawtuxet for example) have limited capacity to deal with these shifts = increased flooding over time (March 2010)
- 21. Rhode Island Was Spared The Worst IRENE SANDY We cannot ignore sea level rise impacts o A higher “starting point” means that a storm of lesser severity will be capable of producing damage to that of a stronger storm o Lunar Equinox tides now producing localized coastal flooding o Consider: Category 2 Hurricane producing inundation & damage comparable to what a Category 3 would have done 50 years ago! o A “side-swipe” from Sandy produced damage on the south coast comparable to a Category 1 to 2 type Hurricane!
- 22. Examining The Impacts of Hurricane Sandy on Rhode Island: A serious wake-up call! THANK YOU! David R. Vallee Hydrologist-in-Charge National Oceanic and Atmospheric Administration’s Northeast River Forecast Center National Weather Service NOAA/NWS/Northeast River Forecast Center Taunton, MA