A framework for assessing and reporting resilience of native vegetation
•Descargar como PPTX, PDF•
1 recomendación•310 vistas

Land management practices are used for a wide range of purposes to modify and fragment native vegetation at sites and to transform vegetated landscapes. Land management targets indicators of vegetation structure, species composition and regenerative capacity. A framework is presented enabling the gains and losses of native vegetation to be tracked over time at site and landscape scales.

Recomendados
Recomendados
Más contenido relacionado
La actualidad más candente
La actualidad más candente (20)
Destacado
Destacado (12)
Similar a A framework for assessing and reporting resilience of native vegetation
Similar a A framework for assessing and reporting resilience of native vegetation (20)
Último
Último (20)
A framework for assessing and reporting resilience of native vegetation
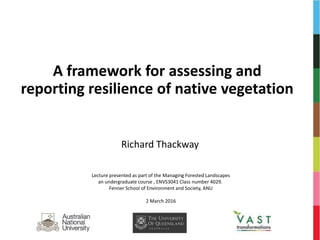
- 1. A framework for assessing and reporting resilience of native vegetation Richard Thackway Lecture presented as part of the Managing Forested Landscapes an undergraduate course , ENVS3041 Class number 4029. Fenner School of Environment and Society, ANU 2 March 2016
- 2. Outline • Concepts and definitions • Why & how land managers change their landscapes • A standardised system for assessing and reporting resilience • The VAST methodology site and landscape • Case studies - Cumberland State Forest, Sydney • Lessons • Conclusions
- 3. Goals of land managers Values and decisions matrix: • Social • Economic • Environmental Intensification Degradation?
- 4. Goals of land managers Values and decisions matrix: • Social • Economic • Environmental Extensification Restoration
- 5. Regulation ofhydrologicalregime Generation offood and fibre Regulation ofclimate / microclimate Generation ofraw materials Recyclingoforganic matter Creating and regulatinghabitats Controllingreproductionand dispersal Changing ecological function to derive multiple benefits (ecosystem services)
- 6. A framework for assessing and reporting vegetation resilience
- 7. Definitions • Change in a plant community type due to effects of land management practices: – Structure – Composition – Regenerative capacity • Resilience = capacity of an plant community to recover toward a reference state following change/s in land management • Transformation = changes to vegetation condition over time • Condition, resilience and transformation are assessed relative to fully natural a reference state Vegetation condition
- 8. Land managers affect native veg condition in space and over time Process: Land managers use land management practices (LMP) to influence ecological function at sites and the landscape by: • Modifying • Removing and replacing • Enhancing • Restoring • Maintaining • Improving Purpose/s: To achieve the desired mix of ecosystem services (space & time)
- 9. 1925 Occupation Relaxation Anthropogenic change Net benefit time 1900 20251950 Reference changeinvegetation indicatororindex 1850 1875 1975 2000 VAST classes A model of ecosystem change (causes & effects)
- 10. Variable date? reference state = Unmodified
- 11. Understanding states and transitions (space and time) Indigenous land management First explorers Grazing Degreeof modification Logging Cropping Site 1 Site 2 Site 3 Time Reference state Long term rainfall Long term disturbance e.g. wildfire, cyclones Revegetation VAST states The same ecosystem e.g. eucalypt open forest with different management histories t2t1 t3
- 12. Land managers change 10 key criteria affecting the resilience of a plant community Soil Vegetation Regenerative capacity/ function Vegetation structure & Species composition 1. Soil hydrological status 2. Soil physical status 3. Soil chemical status 4. Soil biological status 5. Fire regime 6. Reproductive potential 7. Overstorey structure 8. Understorey structure 9. Overstorey composition 10. Understorey composition
- 13. VAST = Vegetation Assets States and Transitions NVIS = National Vegetation Information System VIVIVIIIIII0 Native vegetation cover Non-native vegetation cover Increasing modification caused by use and management Transitions = trend Vegetation thresholds Reference for each veg type (NVIS) A framework for assessing & reporting changes in plant communities Condition states Residual or unmodified Naturally bare Modified Transformed Replaced - Adventive Replaced - managed Replaced - removed Thackway & Lesslie (2008) Environmental Management, 42, 572-90 Diagnostic attributes of VAST states: • Vegetation structure • Species composition • Regenerative capacity NVIS
- 14. Condition of plant communities – a snap shot Thackway & Lesslie (2008) Environmental Management, 42, 572-90 NB: Input dataset biophysical naturalness reclassified using VAST framework / replaced / unmodified VAST 2009 Native
- 15. Aggregate reporting using a hierarchy of regions 1) Agro-climatic, 2) IBRA, 3) IBRA sub-regions
- 16. Aggregate reporting of classes of resilience using agro-climatic regions
- 17. Aggregate reporting of classes of landscape alteration levels
- 18. Synthesising information using a hierarchy • Level 1: Scores over time • Level 2: Components • Level 3: Criteria • Level 4: Indicators • Level 5: Field measures/observations (Direct) and Expert /inference models (Indirect)
- 19. Components (Level 2) Criteria (Level 3) Description of loss or gain relative to pre settlement indicator reference state (Level 4)Regenerativecapacity Fire regime Change in the area /size of fire foot prints Change in the number of fire starts Soil hydrology Change in the soil surface water availability Change in the ground water availability Soil physical state Change in the depth of the A horizon Change in soil structure. Soil nutrient state Nutrient stress – rundown (deficiency) relative to soil fertility Nutrient stress – excess (toxicity) relative to soil fertility Soil biological state Change in the recyclers responsible for maintaining soil porosity and nutrient recycling Change in surface organic matter, soil crusts Reproductive potential Change in the reproductive potential of overstorey structuring species Change in the reproductive potential of understorey structuring species Vegetationstructure Overstorey structure Change in the overstorey top height (mean) of the plant community Change in the overstorey foliage projective cover (mean) of the plant community Change in the overstorey structural diversity (i.e. a diversity of age classes) of the stand Understorey structure Change in the understorey top height (mean) of the plant community Change in the understorey ground cover (mean) of the plant community Change in the understorey structural diversity (i.e. a diversity of age classes) of the plant Species Composition Overstorey composition Change in the densities of overstorey species functional groups Change in no.s of indigenous overstorey species relative to the number of exotic species Understorey composition Change in the densities of understorey species functional groups Change in no.s of indigenous understorey species relative to the number of exotic species
- 20. Generate total indices for ‘transformation site’ for each year of the historical record. Validate using Expert Knowledge • Compile and collate effects of land management on criteria (10) and indicators (22) over time. • Evaluate impacts on the plant community over time Transformation site • Compile and collate effects of land management on criteria (10) and indicators (22) Reference state/sites Score all 22 indicators for ‘transformation site’ relative to the ‘reference site’. 0 = major change; 1 = no change Derive weighted indices for the ‘transformation site’ i.e. regenerative capacity (55%), vegetation structure (27%) and species composition (18%) by adding predefined indicators General process for tracking change over time using the VAST-2 system
- 21. Case studies VAST-2 Cumberland State Forest, Sydney
- 22. Cumberland State Forest, Sydney
- 23. Cumberland State Forest, Sydney
- 24. Field transects to survey of the overstorey and understorey Site level
- 25. On-ground field survey 2012 Transect 1 Cumberland SF, ex-comp 8b, 9a, 9b. Regrowth forest Structure Composition Function
- 26. Transect 2 Cumberland SF, ex-comp 3a, 7a, 7b, 7c. Repurposed arboretum On-ground field survey 2012
- 27. Cumberland State Forest 1941-2012 Red boundary shows main compartments that were cleared as per the 1943 aerial photograph. This area was fully planted out around 1944 as part of the arboretum. Except for regrowth forests: i.e. compartments 8a, 9a, 9b and 10b Transect 2 = T2 Compartments
- 28. 1941
- 29. 1943
- 30. 1951
- 31. 1978
- 32. 1982
- 33. 1984
- 34. 1999
- 35. 2011
- 36. 2012
- 37. NSW, SB Bioregion, Cumberland SF, ex-comp 3a, 7a, 7b, 7c Vegetation structure Indicators: #13: Height #14: Foliage cover #15: Age structure Indicators: #16: Height #17: Foliage cover #18: Age structure Criteria #7 Criteria #8
- 38. NSW, SB Bioregion, Cumberland SF, Transect 2 (ex-comp 3a, 7a, 7b, 7c) Function – Regenerative capacity Criteria #1 Criteria #2 Criteria #3 Criteria #4
- 39. NSW, SB Bioregion, Cumberland SF, Transect 2 (ex-comp 3a, 7a, 7b, 7c) Function – Regenerative capacity Criteria #5 Criteria #6
- 40. NSW, SB Bioregion, Cumberland SF, Transect 2 (ex-comp 3a, 7a, 7b, 7c) Species composition Criteria #9 Criteria #10
- 41. 1 3 10 22 Components (3) Vegetation Transformation Score (1) Criteria (10) Vegetation Structure (27%) Overstorey (3) Understorey (3) Species Composition (18%) (2) UnderstoreyOverstorey (2) Regenerative Capacity (55%) Fire (2) Reprod potent (2) Soil Hydrology (2) Biology (2) Nutrients (2) Structure (2) Indicators (22) Synthesisng the effects of land management on indicators over time Level 1 2 3 4 Count
- 42. NSW, SB Bioregion, Cumberland SF, Transect 2 (ex-comp 3a, 7a, 7b, 7c) Reference pre-European: Sydney Blue Gum High Forest Commenced managing area for recreation. Weed control. Arboretum abandoned Cleared & sown to improved pasture for grazing & orchard Commenced grazing native pastures Indigenous people manage the area Grazed area gazetted as State Forest, commenced planting arboretum Area logged for building houses and fences Commenced managing area as a future production forest. Weed control Explorers traverse the area and site selected Ceased grazing. Area purchased as a future working forest Modified Transformed Replaced/ managed or removed Residual Replaced /adventive VAST
- 43. VAST Unmodified Commenced managing area primarily for recreation Ceased grazing. Purchased & declared as a State forest Site fenced. Commenced continuous stocking with cattle Commenced grazing cattle Indigenous people manage the area Cleared and commenced regrowing native forest as a future forest production Tree cover thinned for cattle grazing Initiated 1st hazard reduction burn Trees logged for housing, fences & fire wood NSW, SB Bioregion, Cumberland SF, Transect 1 (ex-comp 8b, 9a, 9b) Reference pre-European: Sydney Blue Gum High Forest
- 44. • Network of collaborators • Ecologists, land managers, academics, research scientists, environmental historians • Inputs • Reference state • Historical record of land use & Land management practices • Historical record of major natural events e.g. droughts, fires, floods, cyclones, average rainfall 1900-2012 • Observed interactions e.g. rabbits, sheep and drought • Observations and quantitative measures of effects • Include written, oral, artistic, photographic and remote sensing Lessons: Resources needed at site level
- 45. Lessons: site vs landscape 1. Constrain assessments to soil landscape units because this approximates to land manager’s 2. Must account for major natural events e.g. flood, fire, cyclone 3. Remote sensing is only part of the solution – a) Some measures of remote sensing e.g. greenness of crown health may not be directly related to vegetation condition 4. Tracking outcomes of management interventions a) Must collect on-ground data and have a model for linking change to datasets derived from remote sensing
- 46. Lessons: What is the baseline? Zero/constant baseline (e.g. environmental planting) A measure or estimate (red line) that would have occurred in the absence of an activity/intervention e.g. Response variable/s Time Start of activity/ intervention Time Varying baseline (e.g. environmental watering) Response variable/s Single intervention & climatic variability Baseline Response to activity/ intervention Indicator 13: Overstorey height Indicator 4: ground water
- 47. Lessons: Importance of dynamics Assume rainfall is main driver of natural system dynamics • Period 1900 - 2013 • Average seasonal rainfall (summer, autumn, …) • Rainfall anomaly is calculated above and below the mean • Two year running trend line fitted
- 48. Seasonal rainfall anomaly (Lat -32.404, Long 152.496) -2 -1 0 1 2 3 1901 1904 1907 1910 1913 1916 1919 1922 1925 1928 1931 1934 1937 1940 1943 1946 1949 1952 1955 1958 1961 1964 1967 1970 1973 1976 1979 1982 1985 1988 1991 1994 1997 2000 2003 2006 2009 2012 Spring -3 -2 -1 0 1 2 3 4 5 1901 1904 1907 1910 1913 1916 1919 1922 1925 1928 1931 1934 1937 1940 1943 1946 1949 1952 1955 1958 1961 1964 1967 1970 1973 1976 1979 1982 1985 1988 1991 1994 1997 2000 2003 2006 2009 2012 Winter -4 -2 0 2 4 6 1901 1904 1907 1910 1913 1916 1919 1922 1925 1928 1931 1934 1937 1940 1943 1946 1949 1952 1955 1958 1961 1964 1967 1970 1973 1976 1979 1982 1985 1988 1991 1994 1997 2000 2003 2006 2009 2012 Autumn -2 -1 0 1 2 3 1901 1904 1907 1910 1913 1916 1919 1922 1925 1928 1931 1934 1937 1940 1943 1946 1949 1952 1955 1958 1961 1964 1967 1970 1973 1976 1979 1982 1985 1988 1991 1994 1997 2000 2003 2006 2009 2012 Summer Source: BOM
- 49. Conclusions • A framework that helps decision makers assess and report change at sites and landscapes due to human management and natural drivers • A tool (i.e. VAST) for assisting in reporting on the current status of Australia’s vegetation types - used in – National State of the Environment Report (2011) • An accounting tool (VAST-2) for reporting change and trend in the transformation of vegetation types at sites - used in – National State of the Forests Report (2013) – Regional Environmental Accounts (Wentworth Group of Concerned Scientists 2015)
- 50. More info & Acknowledgements More information http://www.vasttransformations.com/ http://portal.tern.org.au/search http://aceas-data.science.uq.edu.au/portal/ Acknowledgements • Many public and private land managers, land management agencies, consultants and researchers have assisted in the development of VAST & VAST-2