Analytics in Healthcare - Using queuing theory to improve patient flow
•
4 recomendaciones•896 vistas


Recomendados
Más contenido relacionado
La actualidad más candente
La actualidad más candente (8)
Similar a Analytics in Healthcare - Using queuing theory to improve patient flow
Similar a Analytics in Healthcare - Using queuing theory to improve patient flow (20)
Último
Último (20)
Analytics in Healthcare - Using queuing theory to improve patient flow
- 1. Optimizing resource deployment and utilization in phlebotomy SawadThotathil Kerala Institute of Medical Sciences Kerala State India
- 2. Project goal 99% of out-patients coming to phlebotomy to experience less than 5 minute wait time for service (within 6 months)
- 3. Operational objectives Analyze customer demand characteristics for phlebotomy service Determine optimal human resource requirements to meet the determined wait time by using queuing theory Subsequently develop optimal process design to meet the determined wait time using appropriate tools like lean tools etc Use process control tools for monitoring variability and related decision making
- 4. Reasons for choice of project Hospital reassessing staff requirements in various departments to cut costs Patient complaints during peak hours Current service quality not aligned with hospital strategy - This hospital strives to differentiate itself by better standards and caters to a higher income clientele looking for high quality services – around 80% upfront payees for the relatively higher cost of treatment
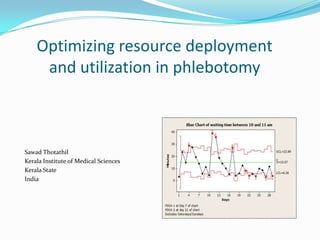
- 8. Process measures Arrival rate of outpatients – Poisson mean where arrival has Poisson distribution Arrival rate of outpatients – Average, where arrival is non-Poisson (non random) In patient sample arrival rate – Average, since arrival is non-Poisson (non random) Personnel on duty ( for every hour of day) Mean waiting time for service (for every hour of day) – shown as bar chart Process control – Using Xbar chart monitoring wait times at the peak hour (10 am to 11 am)
- 9. Outcome measure Proportion of patients experiencing less than 5 minute wait time – near to 20% when project initiated
- 10. Prior to any intervention
- 12. Queuing analysis done to determine optimal number of phlebotomists Next slide shows the analysis and predicts outcomes for various number of servers during the different times . (Average time for service is 4.5 minutes and m/m/s queuing model used) Note: Currently before 10.30am, staff numbers doing phlebotomy actually waver between 3 and 4 as one of the staff devotes more time to handling increasing number of IP samples. As a result prediction and actual don’t exactly tally after 9 am
- 14. Optimal number required As per analysis , it is determined that 4 phlebotomists are required to meet the service requirement of 5 minutes or less (even at higher than current levels of arrival rate as per sensitivity analysis) up to 1 am. After 1 am, work is minimal and requires 2 persons IP sample sorting work (called IP station) may affect the phlebotomy work and hence requires dedicated person. This person can also do the data entry and sample container labeling for phlebotomy procedure (called OP station) up to 11 am Conclusion: 4 phlebotomists must be exclusively doing phlebotomy procedures. A 5 th person must man the IP/OP station. From 10.30 am another person may be needed to handle OP station separately
- 15. PDSA 1 – system human resource deployment as per analysis Re-allot shifts to allow for 5 persons starting at 8 am and other 2 persons joining at 10.30 am (reduction of staff not contemplated at this stage) Physical layout change - Move IP station into the phlebotomy area next to the OP station so that IP and OP workflow can be done together before 10.30 am after which the extra persons will allow for separating both the work if required
- 18. PDSA 1 review No positive change as seen in chart of mean wait time as well as process control chart (SPC chart shown in 23rd slide) Proportion of patients experiencing wait time less than 5 minutes was Before PDSA 1 – 22.2% After PDSA1 – 20.3%
- 19. Review of failure (observation and focus group) Lack of teamwork, uncoordinated leave, uncoordinated meal breaks As a result despite allotment of staff, effectively 4 persons are not doing phlebotomy work Focus group (the staff and myself) – solution proposed in the meet was to determine pace of work required individually to meet demand. Provide for self monitoring of pace as well as managerial level monitoring. Leave and meal breaks to to be regulated
- 20. PDSA 2 – linking individual and team performance to system goals Pace of work determined by takt time as 10 phlebotomies per hour per phlebotomist at peak hours. (Observations prior to focus group had shown this pace could be safely and easily followed) Individual log of work kept by noting down procedure numbers as it is performed (this will be a self monitoring visual tool to allow oneself to make sure that he/she is maintaining pace) Logs provided weekly to lab quality manager Meal times to be coordinated and none between 8 and 12.30 Leave to be controlled strictly and incase of leave, one person should take care of both IP and OP station leaving four persons doing phlebotomy. Any leave that results in less than 4 person doing phlebotomy will be avoided to the level possible.
- 22. Other measures (post PDSA 2) Proportion of patients experiencing less than 5 minute wait time for service is now 59.8 % X bar process control chart was used. It demonstrates the desirable change in wait time after PDSA 2 as shown by signals of special cause variation after day 21. Reduction in process variability also observed indicating a better controlled process now.
- 24. PDSA 2 review There is need for only one person to join after 10.30 am. The second person can be shifted into the laboratory where there is currently a new requirement for additional technician. The reduction in variability after PDSA 2 means work is progressing with a more uniform pace. Note: Process control chart takes into consideration different patient numbers day to day
- 25. PDSA 3 Only 1 person joins at 10.30 am (2nd person does not join)
- 27. Financial matters Hospital demonstrates around 15 to 20 % growth in patients numbers YOY over the last 3 years 1 phlebotomist was being added yearly over the last 3 years to meet increasing demand Improvement means that additional phlebotomist would not be required this year . Also one of the existing staff could be to moved to meet the new position in the lab (laboratory technician - new requirement a result of increasing lab workload) Savings for the coming year by avoiding new hires – 1 phlebotomist and 1 laboratory technician or at the least reduction in 1 phlebotomist Annual cost of one phlebotomist – 60000 Rs Annual cost of one junior laboratory technician – 84000 Rs Total savings – Reduction in phlebotomy unit costs and net annual savings of 144000 Rs to the hospital. (In a US hospital , current salary levels mean a saving of 80000$ annually)