SlideShare a Scribd company logo
1 of 8
Download to read offline
20.02.2013


                                                                                                Company Analysis - Overview
Ticker:                        EDF FP             Electricite de France SA                                         Benchmark:                                  EDF SA (Electricite de France) produces, transmits, distributes, imports and exports
Currency:                                         EN Paris: EDF, Currency: EUR                                     CAC 40 INDEX (CAC)                          electricity. The Company, using nuclear power, coal and gas, provides electricity for
                                                                                                                                                               French energy consumers.
Sector: Utilities        Industry: Electric Utilities                                                                 Year:
Telephone         33-1-40-42-22-22                   Revenue (M)                                         72'729    Business Segments in EUR                            Sales (M)    Geographic Segments in EUR                               Sales (M)
Website           www.edf.fr                         No of Employees                                   #N/A N/A    Transmission                                                1    France                                                      39120
Address           22-30 Avenue de Wagram Paris Cedex 08, 75382 France                                              Distribution                                                     Italy                                                       10098
Share Price Performance in EUR                                                                                     Eliminations                                                     United Kingdom                                               9739
Price                              14.77             1M Return                                             1.3%    Other                                                            Other International                                          7976
52 Week High                       18.22             6M Return                                            -7.8%    Generation Supply                                                Other Activities                                             5796
52 Week Low                        12.86             52 Wk Return                                        -16.3%    Integrated Utilities                                             Germany
52 Wk Beta                          0.78             YTD Return                                            5.7%
Credit Ratings
Bloomberg                     HY1                                                                                                                                                                            8%
S&P                            A+         Date                   17.01.2012              Outlook        STABLE
Moody's                       Aa3         Date                   14.01.2009              Outlook          NEG                                                                                       11%
Fitch                          A+         Date                   07.01.2009              Outlook        STABLE
Valuation Ratios
                            12/09        12/10          12/11         12/12    12/13E        12/14E      12/15E
                                                                                                                                                                                                13%
P/E                         21.1x        89.1x          11.5x           7.8x      8.2x          7.8x        7.1x                                                                                                                      54%
EV/EBIT                     13.3x        15.1x            8.7x          8.8x         -             -           -
EV/EBITDA                     7.7x         6.0x           4.9x          4.8x      4.6x          4.4x        4.2x
P/S                           1.3x         0.9x           0.5x          0.4x      0.4x          0.4x        0.3x
P/B                           2.6x         1.8x           1.1x          1.0x      0.8x          0.8x        0.8x                                                                                      14%
Div Yield                    2.8%         3.7%           6.1%          8.9%      7.9%          7.9%        8.0%                                100%
Profitability Ratios %
                       12/09             12/10          12/11         12/12    12/13E        12/14E      12/15E
Gross Margin                -                -              -             -      20.1          20.8           -                                                                                                France
EBITDA Margin           27.2              24.0           22.3          20.8      22.0          22.2        22.5                                                                                                Italy
Operating Margin        15.7               9.6           12.7          11.3      12.4          12.6        12.8
                                                                                                                                              Transmission
Profit Margin             6.6              1.6            4.6           4.6       4.7           4.8         5.1                                                                                                United Kingdom
Return on Assets          1.8              0.4            1.3           1.4       2.7           2.7         1.9                                                                                                Other International
Return on Equity        14.7               3.3            9.7          11.8      10.4          10.5        10.5
                                                                                                                                                                                                               Other Activities
Leverage and Coverage Ratios
                       12/09             12/10          12/11         12/12
Current Ratio             1.1              1.3            1.3           1.2                                        Current Capitalization in EUR
Quick Ratio               0.7              0.8            0.9           0.8                                        Common Shares Outstanding (M)                                                                            1847.7
EBIT/Interest             3.4              2.3            3.6           3.4                                        Market Capitalization (M)                                                                               27307.8
Tot Debt/Capital          0.6              0.6            0.6           0.7                                        Cash and ST Investments (M)                                                                            #N/A N/A
Tot Debt/Equity           1.8              1.4            1.6           2.1                                        Total Debt (M)                                                                                         #N/A N/A
Eff Tax Rate %          27.5              55.4           28.7          30.8                                        Preferred Equity (M)                                                                                         0.0
                                                                                                                   LT Investments in Affiliate Companies (M)                                                                    0.0
                                                                                                                   Investments (M)                                                                                              0.0
                                                                                                                   Enterprise Value (M)


                                                                                         Q.M.S Advisors | tel: +41 (0)78 922 08 77 | e-mail: info@qmsadv.com |
Company Analysis - Analysts Ratings
Electricite de France SA
Target price in EUR
Broker Recommendation


                                                              Buy and Sell Recommendations vs Price and Target Price


                                                                                                                                                                      Price
                                                                                                                                                                                                                                                                                                                              Brokers' Target Price
                                                                                                                                                                 35           35
                        100%                          4%        4%       4%        8%
                                  15%       15%                                               17%                                                                             30
                                                                                                       22%         24%                       25%                 30
                                                                                                                                30%
                        80%                                                                                                                           41%                     25
                                                      50%      50%       48%                                                                                     25
                                                                                   46%                                                                                        20
                                                                                              42%      35%
                        60%       50%       50%
                                                                                                                   38%                                           20           15
                                                                                                                                             45%
                                                                                                                                50%
                                                                                                                                                                              10
                                                                                                                                                                 15
                        40%                                                                                                                           36%
                                                                                                                                                                                5
                                                                                                                                                                 10
                                                                         48%                                                                                                    0
                                                      46%      46%                 46%        42%      43%


                                                                                                                                                                                                                                                                                                                                                             Day by Day
                                                                                                                                                                                                                                             Bryan Garnier & Cie


                                                                                                                                                                                                                                                                                                                                                                                                                                 Morgan Stanley
                        20%


                                                                                                                                                                                                                                                                                                   Barclays
                                                                                                                                                                                                                    Kepler Capital Markets


                                                                                                                                                                                                                                                                                                                                                                          Main First Bank AG

                                                                                                                                                                                                                                                                                                                                                                                               S&P Capital IQ


                                                                                                                                                                                                                                                                                                                                                                                                                                                                                                                      Raymond James
                                                                                                                                                                                                                                                                   Natixis

                                                                                                                                                                                                                                                                             Exane BNP Paribas


                                                                                                                                                                                                                                                                                                                                Macquarie


                                                                                                                                                                                                                                                                                                                                                                                                                                                  Credit Suisse
                                                                                                                                                                                    Societe Generale


                                                                                                                                                                                                                                                                                                                                                                                                                                                                                  Nomura


                                                                                                                                                                                                                                                                                                                                                                                                                                                                                                               HSBC


                                                                                                                                                                                                                                                                                                                                                                                                                                                                                                                                      DZ Bank AG
                                                                                                                                                                                                                                                                                                                                                                                                                EVA Dimensions
                                                                                                                                                                                                       AlphaValue


                                                                                                                                                                                                                                                                                                                                            Berenberg Bank
                                                                                                                                                                                                                                                                                                              Goldman Sachs


                                                                                                                                                                                                                                                                                                                                                                                                                                                                  Deutsche Bank


                                                                                                                                                                                                                                                                                                                                                                                                                                                                                           Landesbank Baden-
                                  35%       35%                                                                    38%
                                                                                                                                             30%                 5


                                                                                                                                                                                                                                                                                                                                                                                                                                                                                             Wuerttemberg
                                                                                                                                20%                   23%

                         0%                                                                                                                                      0
                                févr.12    mars.12   avr.12   mai.12    juin.12   juil.12   août.12   sept.12     oct.12      nov.12        déc.12   janv.13
                                                                       Buy        Hold         Sell       Price            Target Price

                               Date                     Buy             Hold                Sell                     Date                 Price Target Price                  Broker                                                                                                             Analyst                                                                                       Recommendation                                                                         Target                                          Date
                               31-Jan-13                23%              36%                41%                   20-Feb-13                14.77         16.05                Societe Generale                                                                                                   VINCENT AYRAL                                                                                                              buy                                                              20.00                            20-Feb-13
                               31-Dec-12                30%              45%                25%                   19-Feb-13                14.95         16.05                AlphaValue                                                                                                         MYRIAM COHEN                                                                                                               add                                                              16.00                            19-Feb-13
                               30-Nov-12                20%              50%                30%                   18-Feb-13                14.80         16.05                Kepler Capital Markets                                                                                             INGO BECKER                                                                                                              reduce                                                             13.00                            15-Feb-13
                               31-Oct-12                38%              38%                24%                   15-Feb-13                14.68         16.05                Bryan Garnier & Cie                                                                                                JULIEN DESMARETZ                                                                                                           sell                                                             12.00                            15-Feb-13
                               28-Sep-12                43%              35%                22%                   14-Feb-13                14.95         16.07                Natixis                                                                                                            PHILIPPE OURPATIAN                                                                                                       neutral                                                            16.20                            15-Feb-13
                               31-Aug-12                42%              42%                17%                   13-Feb-13                14.24         16.07                Exane BNP Paribas                                                                                                  BENJAMIN LEYRE                                                                                                         outperform                                                           20.00                            15-Feb-13
                               31-Jul-12                46%              46%                 8%                   12-Feb-13                14.20         16.07                Barclays                                                                                                           JULIE ARAV                                                                                                            underweight                                                           13.00                            15-Feb-13
                               29-Jun-12                48%              48%                 4%                   11-Feb-13                14.24         16.07                Goldman Sachs                                                                                                      ANDREW MEAD                                                                                                           buy/attractive                                                        18.90                             8-Feb-13
                               31-May-12                46%              50%                 4%                    8-Feb-13                14.16         16.07                Macquarie                                                                                                          ATALLAH ESTEPHAN                                                                                                       outperform                                                           19.00                             7-Feb-13
                               30-Apr-12                46%              50%                 4%                    7-Feb-13                13.73         16.09                Berenberg Bank                                                                                                     ROBERT CHANTRY                                                                                                            hold                                                              14.60                             5-Feb-13
                               30-Mar-12                35%              50%                15%                    6-Feb-13                13.78         16.09                Day by Day                                                                                                         VALERIE GASTALDY                                                                                                          hold                                                                                               31-Jan-13
                               29-Feb-12                35%              50%                15%                    5-Feb-13                13.90         16.17                Main First Bank AG                                                                                                 ANDREAS THIELEN                                                                                                       underperform                                                          15.50                            29-Jan-13
                                                                                                                   4-Feb-13                13.92         16.26                S&P Capital IQ                                                                                                     CLIVE ROBERTS                                                                                                              sell                                                             12.00                            28-Jan-13
                                                                                                                   1-Feb-13                14.21         16.26                EVA Dimensions                                                                                                     AUSTIN BURKETT                                                                                                        underweight                                                                                            17-Jan-13
                                                                                                                  31-Jan-13                14.15         16.45                Morgan Stanley                                                                                                     EMMANUEL TURPIN                                                                                                      Equalwt/In-Line                                                        23.00                            15-Jan-13
                                                                                                                  30-Jan-13                14.41         16.45                Credit Suisse                                                                                                      MICHEL DEBS                                                                                                           underperform                                                          12.00                            11-Jan-13
                                                                                                                  29-Jan-13                14.59         16.45                Deutsche Bank                                                                                                      MARTIN BROUGH                                                                                                              sell                                                             12.50                             7-Jan-13
                                                                                                                  28-Jan-13                14.43         16.51                Nomura                                                                                                             MARTIN YOUNG                                                                                                               buy                                                              18.75                            12-Dec-12
                                                                                                                  25-Jan-13                14.55         16.51                Landesbank Baden-Wuerttemberg                                                                                      ERKAN AYCICEK                                                                                                             hold                                                              16.50                             3-Dec-12
                                                                                                                  24-Jan-13                14.52         16.51                HSBC                                                                                                               ADAM DICKENS                                                                                                             neutral                                                            17.00                            14-Nov-12
                                                                                                                  23-Jan-13                14.50         16.51                Raymond James                                                                                                      EMMANUEL RETIF                                                                                                       market perform                                                                                          13-Nov-12
                                                                                                                  22-Jan-13                14.71         16.51                DZ Bank AG                                                                                                         HASIM SENGUEL                                                                                                              buy                                                              33.00                            15-Nov-11
                                                                                                                  21-Jan-13                14.88         16.51
                                                                                                                  18-Jan-13                14.58         16.51
                                                                                                                  17-Jan-13                14.71         16.51
                                                                                                                  16-Jan-13                14.52         16.51
                                                                                                                  15-Jan-13                14.67         16.51
                                                                                                                  14-Jan-13                14.37         16.51
                                                                                                                  11-Jan-13                13.66         16.51
                                                                                                                  10-Jan-13                13.89         16.41

                                                                                                             Q.M.S Advisors | tel: +41 (0)78 922 08 77 | e-mail: info@qmsadv.com |
20.02.2013


Electricite de France SA
                                                                             Company Analysis - Ownership
                                                                                    Ownership Type
Ownership Statistics                                                                                                                    Geographic Ownership Distribution                                           Geographic Ownership
                                                                                           0%
Shares Outstanding (M)                         1847.7                          13%                                                      France                                     97.94%
                                                                                                                                                                                                                        0%
                                                                                                                                                                                                                        0% 0%0%0%
Float                                           15.5%                                                                                   United States                              1.29%                               1%       0%
Short Interest (M)                                                                                                                      Luxembourg                                 0.18%
Short Interest as % of Float                                                                                                            Canada                                     0.17%
Days to Cover Shorts                                                                                                                    Britain                                    0.09%
Institutional Ownership                       87.04%                                                                                    Ireland                                    0.07%
Retail Ownership                              12.96%                                                                                    Spain                                      0.05%
Insider Ownership                              0.00%                                                                                    Others                                     0.21%

                                                                                                                                        Institutional Ownership Distribution
                                                                                                     87%                                                                                                                         99%
                                                                                                                                        Government                                 97.08%
                                                                                                                                        Investment Advisor                         2.08%
                                                                                                                                        Mutual Fund Manager                        0.83%
                                                          Institutional Ownership      Retail Ownership      Insider Ownership          Insurance Company                          0.00%
                                                                                                                                                                                                      France          United States    Luxembourg    Canada
Pricing data is in EUR                                                                                                                  Others                                     0.00%              Britain         Ireland          Spain         Others
Top 20 Owners:                 TOP 20 ALL

                                                                                                                                                                                                                Institutional Ownership
Holder Name                                   Position   Position Change                     Market Value              % of Ownership   Report Date                   Source       Country
FRENCH STATE                            1'561'222'705                   0                   23'059'259'353                 84.44%                       31.12.2011    Co File      FRANCE                                0%
                                                                                                                                                                                                                        1%            0%
THORNBURG INVESTMENT                        7'870'200          -2'229'800                      116'242'854                  0.43%                       31.12.2012   MF-AGG     UNITED STATES                          2%
NATIXIS ASSET MANAGE                        5'682'211            -305'942                       83'926'256                  0.31%                       31.12.2012   MF-AGG        FRANCE
VANGUARD GROUP INC                          4'291'487              61'401                       63'385'263                  0.23%                       31.12.2012   MF-AGG     UNITED STATES
BLACKROCK                                   2'348'697               2'036                       34'690'255                  0.13%                       15.02.2013   ULT-AGG    UNITED STATES
NUVEEN ASSET MANAGEM                        2'056'924             -93'060                       30'380'767                  0.11%                       31.01.2013   MF-AGG     UNITED STATES
CI INVESTMENTS INC                          1'966'710           1'964'810                       29'048'307                  0.11%                       30.06.2012   MF-AGG       CANADA
AVIVA PLC                                   1'574'700                   0                       23'258'319                  0.09%                       31.01.2013   MF-AGG        BRITAIN
ING INTERNATIONAL AD                        1'371'198            -156'801                       20'252'594                  0.07%                       31.07.2012   MF-AGG     LUXEMBOURG
ELECTRICITE DE FRANC                        1'175'594                   0                       17'363'523                  0.06%                       31.12.2011    Co File      FRANCE                                        97%
ALLIANCE BERNSTEIN                          1'171'218               5'290                       17'298'890                  0.06%                       31.12.2012   ULT-AGG    UNITED STATES
AMUNDI                                      1'017'724             -66'541                       15'031'783                  0.06%                       28.09.2012   MF-AGG        FRANCE
AMUNDI                                        843'591                   0                       12'459'839                  0.05%                       28.09.2012   MF-AGG        FRANCE
CI INVESTMENTS INC                            763'219             603'463                       11'272'745                  0.04%                       31.08.2012   MF-AGG       CANADA        Government            Investment Advisor       Mutual Fund Manager
                                                                                                                                                                                                Insurance Company     Others
BANK OF NEW YORK MEL                          711'261                   0                       10'505'325                  0.04%                       15.02.2013   MF-AGG     UNITED STATES
ROTHSCHILD & COMPAGN                          680'000              40'000                       10'043'600                  0.04%                       31.12.2012   MF-AGG        FRANCE
SANFORD C BERNSTEIN                           656'530                   0                        9'696'948                  0.04%                       30.11.2012   MF-AGG     UNITED STATES
AGICAM                                        639'382              -5'309                        9'443'672                  0.03%                       30.04.2012   MF-AGG        FRANCE
TAUBE HODSON STONEX                           610'970              -2'190                        9'024'027                  0.03%                       30.11.2012   MF-AGG        BRITAIN
STATE STREET BANQUE                           591'042             -27'639                        8'729'690                  0.03%                       31.12.2012   MF-AGG        FRANCE
Top 5 Insiders:


Holder Name                                  Position    Position Change                      Market Value             % of Ownership   Report Date                  Source
GRILLAT ALEXANDRE                                 328                                                     4'845              0.00%                      31.12.2011    Co File
CROUZET PHILIPPE                                  200                                                     2'954              0.00%                      31.12.2011    Co File
JAY MICHAEL HASTIN                                200                                                     2'954              0.00%                      31.12.2011    Co File
LAFONT BRUNO                                      150                                                     2'216              0.00%                      31.12.2011    Co File
FAUGERE MIREILLE                                  106                                                     1'566              0.00%                      31.12.2011    Co File


                                                                              Q.M.S Advisors | tel: +41 (0)78 922 08 77 | e-mail: info@qmsadv.com |
Company Analysis - Financials I/IV
Electricite de France SA
Financial information is in EUR (M)                                                                                                                                                 Equivalent Estimates
Periodicity:             Fiscal Year                 12/02         12/03    12/04       12/05        12/06       12/07        12/08       12/09       12/10    12/11    12/12    12/13E      12/14E        12/15E
Income Statement
Revenue                                             48'359        44'919    46'788      51'047      58'932       59'637      63'847      59'140       65'320   65'307   72'729   72'842      75'945        79'298
  - Cost of Goods Sold

Gross Income                                                                                                                                                                     14'641      15'797
  - Selling, General & Admin Expenses               43'893        38'930    38'403      43'054      49'576       49'646      55'937      49'834       59'080   57'021   64'484
          (Research & Dev Costs)                                                           402         389          375         421         438          486      518

Operating Income                                      4'466        5'989     8'385       7'993       9'356        9'991       7'910        9'306       6'240    8'286    8'245    9'038       9'580        10'138
  - Interest Expense                                  1'986        1'508     1'568       1'556       1'655        1'660       1'684        2'529       2'528    2'017    2'443
  - Foreign Exchange Losses (Gains)                      96          -24        59        -175         -36           72          66            9         -63       15
  - Net Non-Operating Losses (Gains)                    983        2'003     5'075       1'844         819          634         933        1'562       1'827    1'703     659

Pretax Income                                         1'401        2'502     1'683       4'768       6'918        7'625       5'227        5'206       1'948    4'551    5'143    5'056       5'441         5'663
  - Income Tax Expense                                  986        1'567     1'072       1'445       1'146        1'841       1'599        1'432       1'079    1'305    1'586

Income Before XO Items                                 415           935      611        3'323       5'772        5'784       3'628        3'774         869    3'246    3'557
   - Extraordinary Loss Net of Tax                                     0        0            0          -5           -9           0         -311        -380        0        0
   - Minority Interests                                 -66           78      -13           93         172          175         144          183         229      236      241

Diluted EPS Before XO Items                                         0.53     0.38        1.96         3.07        3.08        1.91         1.97        0.34     1.63     1.80

Net Income Adjusted*                                   481           857     1'341       3'242       4'227        4'718       4'308        3'905       3'925    3'520    4'216    3'420       3'635         4'026
EPS Adjusted                                          0.00          0.00     0.38        1.97        2.33         2.59        2.37         2.14        2.12     1.91     2.29     1.80        1.91          2.09
Dividends Per Share                                                 0.00                 0.79        1.16         1.28        1.28         1.15        1.15     1.15     1.25     1.16        1.16          1.18
        Payout Ratio %                                 0.0           0.0                 44.6        37.7         41.6        66.8         59.2       331.6     70.6     69.7     0.65        0.61          0.56

Total Shares Outstanding                                           1'626     1'626       1'822       1'822        1'822       1'819        1'849       1'848    1'848    1'848
Diluted Shares Outstanding                                         1'626     1'626       1'648       1'822        1'822       1'823        1'824       1'848    1'847    1'842

EBITDA                                                9'881       12'523    13'227      13'010      14'719       15'619      13'624      16'102       15'688   14'571   15'094   16'058      16'878        17'841

*Net income excludes extraordinary gains and losses and one-time charges.


                                                                              Q.M.S Advisors | tel: +41 (0)78 922 08 77 | e-mail: info@qmsadv.com |
Company Analysis - Financials II/IV
Periodicity:                            12/02     12/03     12/04       12/05        12/06       12/07        12/08       12/09        12/10     12/11     12/12    12/13E   12/14E   12/15E
Balance Sheet
Total Current Assets                    30765     31909     35784       47612       48262        51577       59154       60214         63670     67980     68085
  + Cash & Near Cash Items               1'172     2'523     3'820       7'220       3'308        6'035       5'869       6'982         4'829     5'743     5'874
  + Short Term Investments               2'511                          11'966      17'010       14'876                  12'450        16'788    16'980    16'433
  + Accounts & Notes Receivable         12'368    14'394    13'733      16'107      15'716       16'100      19'144      19'633        19'524    20'908    22'497
  + Inventories                          8'102     6'924     6'678       6'695       7'431        8'678       9'290      12'662        12'685    13'581    14'213
  + Other Current Assets                 6'612     8'068    11'553       5'624       4'797        5'888      24'851       8'487         9'844    10'768     9'068

Total Long-Term Assets                 114'074   114'991   115'675     123'524     130'824     134'572      141'338     179'821       176'889   163'727   182'033
  + Long Term Investments                8'569     7'315     8'118       9'012      13'094      15'805       18'103      24'498        24'921    24'517    30'471
         Gross Fixed Assets            180'818   179'049   181'351     188'655     193'422     198'301      204'620     231'582       199'645   208'464
         Accumulated Depreciation       85'396    80'037    83'706      86'988      89'541      93'360       97'045     103'540        92'445    96'496
  + Net Fixed Assets                    95'422    99'012    97'645     101'667     103'881     104'941      107'575     128'042       107'200   111'968   122'242
  + Other Long Term Assets              10'083     8'664     9'912      12'845      13'849      13'826       15'660      27'281        44'768    27'242    29'320

Total Current Liabilities               33'583    35'356    37'278      39'932      44'922       48'692      58'217      57'177        49'651    50'909    58'368
  + Accounts Payable                     6'353     8'164     6'663       8'872       9'457        9'867      13'957      13'348        12'805    13'681    14'643
  + Short Term Borrowings                8'146     9'890     9'759      11'933      15'110       16'918      18'958      16'560        12'766    12'789    17'521
  + Other Short Term Liabilities        19'084    17'302    20'856      19'127      20'355       21'907      25'302      27'269        24'080    24'439    26'204

Total Long Term Liabilities             96'387    91'705   104'212     110'930     109'365     108'661      117'277     148'191       154'005   145'891   161'038
  + Long Term Borrowings                21'366    19'714    20'636      23'511      19'983      17'607       25'584      44'755        40'646    42'688    46'980
  + Other Long Term Borrowings          75'021    71'991    83'576      87'419      89'382      91'054       91'693     103'436       113'359   103'203   114'058

Total Liabilities                      129'970   127'061   141'490     150'862     154'287     157'353      175'494     205'368       203'656   196'800   219'406
  + Long Preferred Equity                    0         0         0           0           0           0            0           0             0         0         0
  + Minority Interest                      986       915       897         961       1'490       1'586        1'801       4'776         5'586     4'337     4'854
  + Share Capital & APIC                 8'154     8'129     8'129         911         911         911          911         924           924       924       924
  + Retained Earnings & Other Equity     5'729    10'795       943      18'402      22'398      26'299       22'286      28'967        30'393    29'646    24'934

Total Shareholders Equity               14'869    19'839     9'969      20'274      24'799       28'796      24'998      34'667        36'903    34'907    30'712

Total Liabilities & Equity             144'839   146'900   151'459     171'136     179'086     186'149      200'492     240'035       240'559   231'707   250'118

Book Value Per Share                               11.64      5.58       10.60       12.79        14.93       12.75       16.17         16.94     16.54     13.99    18.00    17.69    18.86
  Tangible Book Value Per Share                     7.63      1.48        5.62        7.73         9.62        7.31        5.83          7.94      7.70      4.23


                                                              Q.M.S Advisors | tel: +41 (0)78 922 08 77 | e-mail: info@qmsadv.com |
Company Analysis - Financials III/IV
Periodicity:                           12/02    12/03    12/04      12/05        12/06       12/07        12/08       12/09        12/10     12/11     12/12    12/13E    12/14E    12/15E
Cash Flows
Net Income                               481      857      624       3'230       5'605        5'618       3'484        3'902       1'020      3'010     3'316    3'449     3'600     3'949
  + Depreciation & Amortization        5'415    6'534    4'842       5'017       5'363        5'628       5'714        6'796       9'448      6'285     6'849
  + Other Non-Cash Adjustments         2'753     -712    2'056      -1'179         173         -755      -1'415        1'983         977        987     2'149
  + Changes in Non-Cash Capital          470       17      473       1'371         654         -269        -211       -1'468        -335     -1'785    -2'390

Cash From Operating Activities          9'119    6'696    7'995      8'439      11'795       10'222       7'572       11'213       11'110     8'497     9'924
  + Disposal of Fixed Assets            1'683    1'778      383        392         272          229         214          201          188       497       748
  + Capital Expenditures               -7'486   -4'963   -4'940     -5'168      -5'935       -7'490      -9'703      -11'777      -12'241   -11'134   -13'386   -12'737   -12'808   -13'620
  + Increase in Investments                 0   -1'413              -2'894      -8'797                   -6'895                    -6'272              -1'792
  + Decrease in Investments                 0        0     761                                1'580                      462                   222
  + Other Investing Activities         -4'080     -557     -97      -2'951         691          253        -281      -14'120       3'398     3'624        20

Cash From Investing Activities         -9'883   -5'155   -3'893    -10'621     -13'769       -5'428     -16'665      -25'234      -14'927    -6'791   -14'410
  + Dividends Paid                       -378     -208     -321       -374      -1'439       -3'170      -2'438       -1'228       -2'163    -2'122    -2'125
  + Change in Short Term Borrowings         0        0
  + Increase in Long Term Borrowings    6'250    8'236    3'865      2'810        3'686       7'059      15'717       29'272        8'642     5'846   12'431
  + Decrease in Long Term Borrowings   -3'893   -9'287   -7'230     -3'247       -4'254      -6'357      -4'882      -15'244       -4'652    -4'071   -4'869
  + Increase in Capital Stocks              0       33       43      6'377           24         178         249           12
  + Decrease in Capital Stocks              0        0                                           -6        -180                      -10        -14      -15
  + Other Financing Activities            178      122     162        686           45          229         461        2'549         488     -1'230     -809

Cash From Financing Activities         2'157    -1'104   -3'481      6'252       -1'938      -2'067       8'927      15'361        2'305     -1'591    4'613

Net Changes in Cash                    1'393      437      621       4'070       -3'912       2'727        -166        1'340       -1'512      115       127

Free Cash Flow (CFO-CAPEX)             1'633    1'733    3'055       3'271       5'860        2'732      -2'131        -564        -1'131    -2'637    -3'462    -1'844    -1'146    -1'878

Free Cash Flow To Firm                 2'221    2'297    3'624       4'355       7'241        3'991        -962       1'269           -3     -1'198    -1'772
Free Cash Flow To Equity               5'673    2'460       73       3'226       5'564        3'663       8'918      13'665        3'047       -365     4'848
Free Cash Flow per Share                         1.07     1.88        1.98        3.22         1.50       -1.17       -0.31        -0.61      -1.43     -1.88


                                                          Q.M.S Advisors | tel: +41 (0)78 922 08 77 | e-mail: info@qmsadv.com |
Company Analysis - Financials IV/IV
Periodicity:                         12/02   12/03   12/04      12/05        12/06       12/07        12/08       12/09       12/10   12/11   12/12    12/13E   12/14E   12/15E
Ratio Analysis

Valuation Ratios
  Price Earnings                                                 16.3x       17.9x        26.5x       21.7x        21.1x      89.1x   11.5x     7.8x     8.2x     7.8x     7.1x
  EV to EBIT                                                      9.4x       12.5x        16.4x       14.7x        13.3x      15.1x    8.7x     8.8x
  EV to EBITDA                                                    5.8x        7.9x        10.5x        8.5x         7.7x       6.0x    4.9x     4.8x     4.6x     4.4x     4.2x
  Price to Sales                                                  1.0x        1.7x         2.5x        1.2x         1.3x       0.9x    0.5x     0.4x     0.4x     0.4x     0.3x
  Price to Book                                                   3.0x        4.3x         5.5x        3.3x         2.6x       1.8x    1.1x     1.0x     0.8x     0.8x     0.8x
  Dividend Yield                                                 2.5%        2.1%         1.6%        3.1%         2.8%       3.7%    6.1%     8.9%     7.9%     7.9%     8.0%

Profitability Ratios
  Gross Margin                                                                                                                                         20.1%    20.8%
  EBITDA Margin                      20.4%   27.9%   28.3%      25.5%        25.0%       26.2%        21.3%       27.2%       24.0%   22.3%   20.8%    22.0%    22.2%    22.5%
  Operating Margin                    9.2%   13.3%   17.9%      15.7%        15.9%       16.8%        12.4%       15.7%        9.6%   12.7%   11.3%    12.4%    12.6%    12.8%
  Profit Margin                       1.0%    1.9%    1.3%       6.3%         9.5%        9.4%         5.5%        6.6%        1.6%    4.6%    4.6%     4.7%     4.8%     5.1%
  Return on Assets                    0.3%    0.6%    0.4%       2.0%         3.2%        3.1%         1.8%        1.8%        0.4%    1.3%    1.4%     2.7%     2.7%     1.9%
  Return on Equity                    3.5%    5.2%    4.5%      22.8%        26.3%       22.2%        13.8%       14.7%        3.3%    9.7%   11.8%    10.4%    10.5%    10.5%

Leverage & Coverage Ratios
  Current Ratio                       0.92    0.90    0.96        1.19        1.07         1.06        1.02         1.05       1.28    1.34    1.17
  Quick Ratio                         0.48    0.48    0.47        0.88        0.80         0.76        0.43         0.68       0.83    0.86    0.77
  Interest Coverage Ratio (EBIT/I)    2.25    3.97    5.35        5.14        5.65         6.02        4.70         3.43       2.27    3.65    3.37
  Tot Debt/Capital                    0.66    0.60    0.75        0.64        0.59         0.55        0.64         0.64       0.59    0.61    0.68
  Tot Debt/Equity                     1.98    1.49    3.05        1.75        1.42         1.20        1.78         1.77       1.45    1.59    2.10

Others
  Asset Turnover                      0.34    0.31    0.31        0.32        0.34         0.33        0.33         0.27       0.27    0.28    0.30
  Accounts Receivable Turnover        4.08    3.36    3.33        3.42        3.70         3.75        3.62         3.05       3.34    3.23    3.35
  Accounts Payable Turnover
  Inventory Turnover

  Effective Tax Rate                 70.4%   62.6%   63.7%      30.3%        16.6%       24.1%        30.6%       27.5%       55.4%   28.7%   30.8%


                                                      Q.M.S Advisors | tel: +41 (0)78 922 08 77 | e-mail: info@qmsadv.com |
Company Analysis - Peers Comparision
                                                                                                                            VEOLIA
                                         EDF             GDF SUEZ       E.ON SE         RWE AG         CENTRICA PLC                             SSE PLC           ENEL SPA          IBERDROLA SA         ENDESA         EDP           ELETROBRAS-PR B    FORTUM OYJ       NATIONAL GRID PL UNITED UTILITIES
                                                                                                                          ENVIRONNE

Latest Fiscal Year:                        12/2012           12/2011       12/2011         12/2011           12/2011            12/2011             03/2012            12/2011               12/2012        12/2011       12/2011            12/2011          12/2012             03/2012          03/2012
52-Week High                                  19.72             20.35         19.80           37.12            359.20              13.06            1'470.00                3.30                  4.59         17.88           2.45             27.08            19.36              722.00           816.00
52-Week High Date                        02.03.2012        21.08.2012    14.09.2012      20.03.2012        04.02.2013         16.03.2012          24.12.2012         14.01.2013            21.02.2012     09.01.2013    18.01.2013         22.02.2012       02.03.2012          13.12.2012       14.08.2012
52-Week Low                                   13.39             14.51         12.42           26.36            290.10                7.38           1'266.00                2.02                  2.63         11.30           1.63               7.05           12.81              622.50           590.00
52-Week Low Date                         29.11.2012        18.02.2013    08.02.2013      08.02.2013        23.02.2012         16.11.2012          27.02.2012         24.07.2012            26.07.2012     25.07.2012    31.05.2012         22.11.2012       23.07.2012          30.03.2012       12.04.2012
Daily Volume                                864'051         1'845'709     8'937'428       1'641'657         3'322'492          1'882'661             976'088         15'425'305            12'558'743        112'252     4'631'629            161'100        2'048'243           3'961'987        1'462'289
  Current Price (2/dd/yy)                       14.77          14.56          12.89          27.86            352.60                9.40           1'438.00                2.91                  3.70         17.25           2.31              11.72           14.60              708.00           735.50
  52-Week High % Change                     -25.1%            -28.5%         -34.9%         -25.0%               -1.8%            -28.0%               -2.2%             -11.7%                -19.5%          -3.5%          -5.6%            -56.7%          -24.6%                 -1.9%           -9.9%
  52-Week Low % Change                       10.3%              0.3%           3.8%           5.7%              21.5%              27.4%              13.6%               44.3%                 40.5%         52.7%          41.8%              66.2%           14.0%                13.7%           24.7%
Total Common Shares (M)                    1'847.7           2'213.8        1'905.5          586.6            5'173.2              505.4              944.7             9'403.4               6'138.9       1'058.8        3'624.2            1'352.6           888.4              3'701.0           681.8
  Market Capitalization                  27'307.8           35'130.7      25'794.9        17'074.0          18'332.5            4'906.6            13'781.8           27'401.4             23'209.0        18'263.5       8'439.3           10'344.7         12'970.2            25'946.0          5'015.3
Total Debt                                64'501.0          57'272.0       29'914.0       21'923.0            4'171.0           21'089.2             6'245.6           65'481.0             33'373.0       13'681.0      18'785.1            45'367.2         8'777.0             23'025.0          5'855.2
Preferred Stock                                -                 -              -              -                  -                  -                   -                  -                    -            180.0           -                     -             -                    -                -
Minority Interest                          4'854.0          17'340.0        3'876.0        1'344.0                -              2'765.4                 -             15'650.0                325.0        5'388.0       3'277.2               358.8           616.0                  7.0              -
Cash and Equivalents                      22'307.0          14'675.0        6'931.0        7'004.0              546.0            5'723.9               189.2            7'015.0              6'575.0        8'440.0       1'731.7            16'610.6           963.0              2'723.0            321.2
   Enterprise Value                      74'355.8           94'409.7      49'653.9        34'221.0          23'060.5           22'865.6            19'028.1         102'403.4              50'332.0        29'112.5     30'035.2            49'218.0         21'400.2            46'881.0         10'842.1
                                                                                                                                               Valuation
Total Revenue                      LFY    72'729.0          90'673.0      112'954.0       49'153.0          22'824.0            29'647.3           31'723.9            77'573.0             34'750.1       32'686.0      15'120.9            33'061.4         6'159.0             13'832.0          1'564.9
                                  LTM     72'729.0          95'530.0      125'308.0       49'485.0          23'292.0            30'124.1           31'337.3            82'455.0             34'848.9       33'393.0      16'048.9            40'310.7         6'159.0             13'605.0          1'595.1
                                 CY+1     72'841.7          93'543.0      112'559.6       51'061.5          23'250.8            29'402.8           32'010.7            78'736.1             33'220.0       32'238.6      14'932.7            31'485.0         6'259.3             14'377.7          1'643.6
                                 CY+2     75'945.4          82'709.4      110'835.4       51'956.9          24'184.2            28'166.4           32'902.8            78'524.0             34'381.4       32'363.2      15'273.3            23'364.8         6'459.0             14'862.6          1'700.2
EV/Total Revenue                   LFY          1.0x             1.1x           0.6x            0.8x              0.9x                0.8x              0.6x                1.3x                 1.5x            0.8x         1.9x                1.7x             3.4x                 3.3x             6.8x
                                  LTM           1.0x             1.1x           0.5x            0.8x              0.9x                0.8x              0.6x                1.2x                 1.5x            0.8x         1.8x                1.4x             3.4x                 3.4x             6.7x
                                 CY+1           1.0x             1.0x           0.5x            0.7x              1.0x                0.7x              0.6x                1.1x                 1.6x            1.0x         2.0x                0.9x             3.4x                 3.3x             6.4x
                                 CY+2           1.0x             1.1x           0.4x            0.7x              0.9x                0.7x              0.6x                1.1x                 1.5x            0.9x         1.9x                1.3x             3.3x                 3.3x             6.4x
EBITDA                             LFY    15'094.0          16'071.0        4'269.0        8'286.0           3'310.0             3'805.3            1'946.8            17'198.0              7'193.0        7'265.0       3'754.9             5'866.8         2'403.0              4'777.0            900.0
                                  LTM     15'094.0          16'622.0        4'532.0        7'646.0           2'596.0             3'604.0            2'073.9            19'353.0              7'151.9        7'239.0       3'720.6             6'729.2         2'403.0              4'991.0            905.1
                                 CY+1     16'058.4          17'089.4       10'690.1        8'631.3           3'628.9             2'716.6            2'167.6            16'561.4              7'591.3        7'051.6       3'720.3             6'673.5         2'442.6              5'102.9            965.1
                                 CY+2     16'877.5          14'590.0        9'527.5        8'783.1           3'901.2             2'666.6            2'295.1            16'393.5              7'937.2        6'719.4       3'731.6             3'763.0         2'442.0              5'379.7          1'008.8
EV/EBITDA                          LFY          4.8x             6.4x          14.6x            4.7x              6.4x                6.0x              9.5x                5.9x                 7.4x            3.7x         7.8x                9.4x             8.7x                 9.6x           11.9x
                                  LTM           4.8x             6.2x          13.8x            5.1x              8.2x                6.4x              9.0x                5.2x                 7.4x            3.7x         7.9x                8.2x             8.7x                 9.2x           11.8x
                                 CY+1           4.7x             5.6x           4.8x            4.3x              6.3x                7.4x              9.6x                5.2x                 6.8x            4.5x         8.0x                4.1x             8.8x                 9.3x           11.0x
                                 CY+2           4.6x             6.1x           5.1x            4.1x              5.8x                7.1x              9.3x                5.2x                 6.4x            4.4x         7.8x                8.2x             8.8x                 9.1x           10.8x
EPS                                LFY         1.80              2.04          -0.01           3.35              0.24               -0.89               1.29                0.44                 0.47           2.01          0.31                2.76                -                0.51             0.47
                                  LTM          1.80              1.61          -0.01           3.76              0.18               -0.04               0.25                0.37                 0.47           1.79          0.30                3.09            1.59                 0.64             0.48
                                 CY+1         1.80              1.56           2.21           4.07              0.27                0.41               1.14                0.37                 0.40           1.97          0.29                3.23            1.29                 0.54             0.40
                                 CY+2         1.91              1.39           1.31           3.95              0.28                0.63               1.17                0.36                 0.42           1.77          0.27                1.31            1.26                 0.55             0.44
P/E                                LFY          8.2x             9.0x               -           7.4x            19.4x                    -             58.5x                8.0x                 7.8x            9.6x         7.7x                3.8x             9.2x               11.1x            15.5x
                                  LTM           8.2x             8.5x          10.6x            7.4x              9.6x            376.5x               13.1x                    -                7.8x            9.4x         7.8x                3.8x                -               13.0x            15.0x
                                 CY+1           8.2x             9.4x           5.8x            6.8x            13.1x               23.1x              12.6x                7.9x                 9.3x            8.8x         8.1x                3.6x           11.3x                13.2x            18.2x
                                 CY+2           7.8x            10.5x           9.9x            7.1x            12.7x               14.9x              12.3x                8.2x                 8.8x            9.8x         8.7x                9.0x           11.6x                12.9x            16.9x
Revenue Growth                  1 Year       11.4%              7.3%          21.6%          (3.1%)              1.8%                3.1%             12.0%                7.8%                 9.8%            4.8%         6.7%               10.9%           (0.0%)               (3.6%)             3.4%
                                5 Year         6.1%            34.1%          13.3%            6.4%              7.2%              (0.3%)             18.0%               18.2%                 7.9%            9.3%         9.5%               13.7%             7.7%                 8.6%           (5.1%)
EBITDA Growth                   1 Year         3.6%             1.0%        (67.2%)        (10.2%)             (0.8%)                2.9%              4.9%                2.6%                 2.8%          (2.8%)         7.0%               10.0%             0.3%               (1.4%)             0.0%
                                5 Year       (0.7%)            26.1%        (12.7%)            2.6%            11.3%                 3.1%              5.7%               16.8%                 8.1%            3.0%        10.2%               (2.9%)            3.8%                 7.5%             0.9%
EBITDA Margin                     LTM        20.8%             17.4%           3.6%          15.5%             11.1%               12.0%               6.6%               23.5%                20.5%          21.7%         23.2%               16.7%           39.0%                36.7%            56.7%
                                 CY+1        22.0%             18.3%           9.5%          16.9%             15.6%                 9.2%              6.8%               21.0%                22.9%          21.9%         24.9%               21.2%           39.0%                35.5%            58.7%
                                 CY+2        22.2%             17.6%           8.6%          16.9%             16.1%                 9.5%              7.0%               20.9%                23.1%          20.8%         24.4%               16.1%           37.8%                36.2%            59.3%
                                                                                                                                      Leverage/Coverage Ratios
Total Debt / Equity %                          249.4%          91.0%          83.7%         139.3%             74.5%              298.3%             136.2%              168.8%                98.9%          70.9%        231.6%              59.0%            86.0%               249.2%
Total Debt / Capital %                          67.7%          41.6%          43.0%          56.2%             42.7%               68.2%              57.7%               54.6%                49.5%          35.5%         62.3%              37.0%            44.8%                71.3%
Total Debt / EBITDA                             4.273x         3.980x         6.872x         2.731x            2.207x              5.500x             2.961x              3.401x               4.666x         1.799x        5.549x             7.515x           3.653x               4.830x
Net Debt / EBITDA                               2.795x         2.878x         5.863x         2.041x            1.821x              4.238x             2.530x              3.032x               3.747x         0.710x        4.953x             5.746x           3.252x               4.193x
EBITDA / Int. Expense                           6.178x         6.400x         1.367x         7.795x            8.193x              4.417x             3.881x              6.247x               4.728x         9.290x        3.460x             1.457x           8.010x               2.040x
                                                                                                                                             Credit Ratings
S&P LT Credit Rating                            A+             A *-              A-           BBB+                 A-              BBB+                   A-              BBB+                   BBB           BBB+           BB+                  A-               A-                  A-
S&P LT Credit Rating Date                17.01.2012        29.01.2013    27.07.2012      27.07.2012        29.05.2009         24.11.2000          21.08.2009         08.03.2012            28.11.2012     08.03.2012    01.02.2012         17.11.2011       27.11.2012          24.08.2007
Moody's LT Credit Rating                       Aa3                A1            A3              A3                A3               Baa1                  A3               Baa2               (P)Baa1             WR           Ba1               Baa3               A2                Baa1
Moody's LT Credit Rating Date            14.01.2009        03.07.2012    05.10.2011      19.07.2011        21.06.2006         07.02.2012          22.09.2009         05.11.2012            05.11.2012     25.02.2009    16.02.2012         19.12.2012       15.07.2005          12.01.2007


                                                                                                                   Q.M.S Advisors | tel: +41 (0)78 922 08 77 | e-mail: info@qmsadv.com |

More Related Content

What's hot

Financial analysis nobel biocare holding ag develops and produces dental im...
Financial analysis   nobel biocare holding ag develops and produces dental im...Financial analysis   nobel biocare holding ag develops and produces dental im...
Financial analysis nobel biocare holding ag develops and produces dental im...
BCV
 
Financial analysis total sa - total sa explores for, produces, refines, tra...
Financial analysis   total sa - total sa explores for, produces, refines, tra...Financial analysis   total sa - total sa explores for, produces, refines, tra...
Financial analysis total sa - total sa explores for, produces, refines, tra...
BCV
 
Pitching training 2011 11-01
Pitching training 2011 11-01Pitching training 2011 11-01
Pitching training 2011 11-01
Juha Ruohonen
 
Financial Analysis - Commerzbank AG attracts deposits and offers retail an…
Financial Analysis - Commerzbank AG attracts deposits and offers retail an…Financial Analysis - Commerzbank AG attracts deposits and offers retail an…
Financial Analysis - Commerzbank AG attracts deposits and offers retail an…
BCV
 
Financial analysis goldcorp, inc. is engaged in the acquisition, exploratio...
Financial analysis   goldcorp, inc. is engaged in the acquisition, exploratio...Financial analysis   goldcorp, inc. is engaged in the acquisition, exploratio...
Financial analysis goldcorp, inc. is engaged in the acquisition, exploratio...
BCV
 
Deutsche EuroShop | Company Presentation | 12/12
Deutsche EuroShop | Company Presentation | 12/12Deutsche EuroShop | Company Presentation | 12/12
Deutsche EuroShop | Company Presentation | 12/12
Deutsche EuroShop AG
 
Presentation 3 q strategy cee (eng for release)
Presentation 3 q strategy cee (eng for release)Presentation 3 q strategy cee (eng for release)
Presentation 3 q strategy cee (eng for release)
bestbanking medien
 
Financial Analysis - CSR Corp ltd. provides a wide range of rolling stock p…
Financial Analysis - CSR Corp ltd. provides a wide range of rolling stock p…Financial Analysis - CSR Corp ltd. provides a wide range of rolling stock p…
Financial Analysis - CSR Corp ltd. provides a wide range of rolling stock p…
BCV
 

What's hot (20)

Financial analysis nobel biocare holding ag develops and produces dental im...
Financial analysis   nobel biocare holding ag develops and produces dental im...Financial analysis   nobel biocare holding ag develops and produces dental im...
Financial analysis nobel biocare holding ag develops and produces dental im...
 
Financial Analysis - National Oilwell Varco Inc. is a worldwide provider of e...
Financial Analysis - National Oilwell Varco Inc. is a worldwide provider of e...Financial Analysis - National Oilwell Varco Inc. is a worldwide provider of e...
Financial Analysis - National Oilwell Varco Inc. is a worldwide provider of e...
 
Financial analysis total sa - total sa explores for, produces, refines, tra...
Financial analysis   total sa - total sa explores for, produces, refines, tra...Financial analysis   total sa - total sa explores for, produces, refines, tra...
Financial analysis total sa - total sa explores for, produces, refines, tra...
 
Pitching training 2011 11-01
Pitching training 2011 11-01Pitching training 2011 11-01
Pitching training 2011 11-01
 
Santander Bank Financial Report 2011
Santander Bank Financial Report 2011Santander Bank Financial Report 2011
Santander Bank Financial Report 2011
 
Financial Analysis - LinkedIn Corporation operates a social networking websit...
Financial Analysis - LinkedIn Corporation operates a social networking websit...Financial Analysis - LinkedIn Corporation operates a social networking websit...
Financial Analysis - LinkedIn Corporation operates a social networking websit...
 
CS Conference 2012
CS Conference 2012CS Conference 2012
CS Conference 2012
 
European Leveraged Loan Market Analysis - Year-end 2010
European Leveraged Loan Market Analysis - Year-end 2010European Leveraged Loan Market Analysis - Year-end 2010
European Leveraged Loan Market Analysis - Year-end 2010
 
Financial Analysis - Commerzbank AG attracts deposits and offers retail an…
Financial Analysis - Commerzbank AG attracts deposits and offers retail an…Financial Analysis - Commerzbank AG attracts deposits and offers retail an…
Financial Analysis - Commerzbank AG attracts deposits and offers retail an…
 
Financial analysis goldcorp, inc. is engaged in the acquisition, exploratio...
Financial analysis   goldcorp, inc. is engaged in the acquisition, exploratio...Financial analysis   goldcorp, inc. is engaged in the acquisition, exploratio...
Financial analysis goldcorp, inc. is engaged in the acquisition, exploratio...
 
Fev @ Take A Breath 2012
Fev @ Take A Breath 2012Fev @ Take A Breath 2012
Fev @ Take A Breath 2012
 
Financial Analysis - Herbalife Ltd. is a network marketing company that sell...
 Financial Analysis - Herbalife Ltd. is a network marketing company that sell... Financial Analysis - Herbalife Ltd. is a network marketing company that sell...
Financial Analysis - Herbalife Ltd. is a network marketing company that sell...
 
Deutsche EuroShop | Company Presentation | 12/12
Deutsche EuroShop | Company Presentation | 12/12Deutsche EuroShop | Company Presentation | 12/12
Deutsche EuroShop | Company Presentation | 12/12
 
Presentation 3 q strategy cee (eng for release)
Presentation 3 q strategy cee (eng for release)Presentation 3 q strategy cee (eng for release)
Presentation 3 q strategy cee (eng for release)
 
Bulgaria 2020 Targets
Bulgaria 2020 TargetsBulgaria 2020 Targets
Bulgaria 2020 Targets
 
Economic Crisis of 2008
Economic Crisis of 2008Economic Crisis of 2008
Economic Crisis of 2008
 
Tesco
TescoTesco
Tesco
 
Annexes To 2008 Results And 2009 2013 Business Plan
Annexes To 2008 Results And 2009 2013 Business PlanAnnexes To 2008 Results And 2009 2013 Business Plan
Annexes To 2008 Results And 2009 2013 Business Plan
 
Financial Analysis - CSR Corp ltd. provides a wide range of rolling stock p…
Financial Analysis - CSR Corp ltd. provides a wide range of rolling stock p…Financial Analysis - CSR Corp ltd. provides a wide range of rolling stock p…
Financial Analysis - CSR Corp ltd. provides a wide range of rolling stock p…
 
Re-building confidence in the lending market, Working Party on Land Registrat...
Re-building confidence in the lending market, Working Party on Land Registrat...Re-building confidence in the lending market, Working Party on Land Registrat...
Re-building confidence in the lending market, Working Party on Land Registrat...
 

Viewers also liked (7)

Welcome to Zhengzhou
Welcome to ZhengzhouWelcome to Zhengzhou
Welcome to Zhengzhou
 
Using Google's Cloud - for Developers part three
Using Google's Cloud - for Developers part threeUsing Google's Cloud - for Developers part three
Using Google's Cloud - for Developers part three
 
Wind Report From Gwec
Wind Report From GwecWind Report From Gwec
Wind Report From Gwec
 
Topix Index (Top 1000) Dividends and Implied Volatility Surface Parameters
Topix Index (Top 1000) Dividends and Implied Volatility Surface ParametersTopix Index (Top 1000) Dividends and Implied Volatility Surface Parameters
Topix Index (Top 1000) Dividends and Implied Volatility Surface Parameters
 
071510 sun b_1515_feldman_stephen_forpublic
071510 sun b_1515_feldman_stephen_forpublic071510 sun b_1515_feldman_stephen_forpublic
071510 sun b_1515_feldman_stephen_forpublic
 
Михаил Бараблин - "Emacs & Rails"
Михаил Бараблин - "Emacs & Rails"Михаил Бараблин - "Emacs & Rails"
Михаил Бараблин - "Emacs & Rails"
 
Du pont pv
Du pont pvDu pont pv
Du pont pv
 

Similar to Financial analysis electricite de france sa - produces, transmits, distributes, imports and exports electricity. the company, using nuclear power, coal and gas, provides electricity for french energy consumers

Financial Analysis - Zhuzhou CSR Times electric Co., ltd. provides and int…
Financial Analysis - Zhuzhou CSR Times electric Co., ltd. provides and int…Financial Analysis - Zhuzhou CSR Times electric Co., ltd. provides and int…
Financial Analysis - Zhuzhou CSR Times electric Co., ltd. provides and int…
BCV
 
Softchoice Corp Investment Overview
Softchoice Corp Investment OverviewSoftchoice Corp Investment Overview
Softchoice Corp Investment Overview
Ankur Bansal
 
Financial Analysis - Kubota corporation manufactures industrial machinery,…
Financial Analysis - Kubota corporation manufactures industrial machinery,…Financial Analysis - Kubota corporation manufactures industrial machinery,…
Financial Analysis - Kubota corporation manufactures industrial machinery,…
BCV
 
2010 Annual Shareholders’Meeting - Pierre‐François RIOLACCI
2010 Annual Shareholders’Meeting - Pierre‐François RIOLACCI2010 Annual Shareholders’Meeting - Pierre‐François RIOLACCI
2010 Annual Shareholders’Meeting - Pierre‐François RIOLACCI
ve-finance
 
SKF First-quarter result slide show
SKF First-quarter result slide showSKF First-quarter result slide show
SKF First-quarter result slide show
SKF
 
2009 Annual Shareholders’Meeting - Presentation of Thomas Piquemal
2009 Annual Shareholders’Meeting - Presentation of Thomas Piquemal2009 Annual Shareholders’Meeting - Presentation of Thomas Piquemal
2009 Annual Shareholders’Meeting - Presentation of Thomas Piquemal
ve-finance
 
Note Goldman Sachs sur Maroc Telecom Février 2013
Note Goldman Sachs sur Maroc Telecom Février 2013Note Goldman Sachs sur Maroc Telecom Février 2013
Note Goldman Sachs sur Maroc Telecom Février 2013
www.bourse-maroc.org
 
Financial Analysis - Shanghai Construction Co., ltd. undertakes a variety …
Financial Analysis - Shanghai Construction Co., ltd. undertakes a variety …Financial Analysis - Shanghai Construction Co., ltd. undertakes a variety …
Financial Analysis - Shanghai Construction Co., ltd. undertakes a variety …
BCV
 
Financial Analysis - Zhejiang Expressway Co., ltd., through its subsidiari…
Financial Analysis - Zhejiang Expressway Co., ltd., through its subsidiari…Financial Analysis - Zhejiang Expressway Co., ltd., through its subsidiari…
Financial Analysis - Zhejiang Expressway Co., ltd., through its subsidiari…
BCV
 
Conference Call Presentation 4Q09
Conference Call Presentation 4Q09Conference Call Presentation 4Q09
Conference Call Presentation 4Q09
Tempo
 
Financial analysis - MBIA Inc. provides financial guarantee insurance and …
Financial analysis - MBIA Inc. provides financial guarantee insurance and …Financial analysis - MBIA Inc. provides financial guarantee insurance and …
Financial analysis - MBIA Inc. provides financial guarantee insurance and …
BCV
 

Similar to Financial analysis electricite de france sa - produces, transmits, distributes, imports and exports electricity. the company, using nuclear power, coal and gas, provides electricity for french energy consumers (20)

Financial Analysis - Zhuzhou CSR Times electric Co., ltd. provides and int…
Financial Analysis - Zhuzhou CSR Times electric Co., ltd. provides and int…Financial Analysis - Zhuzhou CSR Times electric Co., ltd. provides and int…
Financial Analysis - Zhuzhou CSR Times electric Co., ltd. provides and int…
 
Financial Analysis - American International Group, Inc. is an internationa…
Financial Analysis - American International Group, Inc. is an internationa…Financial Analysis - American International Group, Inc. is an internationa…
Financial Analysis - American International Group, Inc. is an internationa…
 
SNC : Opp day Feb 18, 2013
SNC : Opp day Feb 18, 2013  SNC : Opp day Feb 18, 2013
SNC : Opp day Feb 18, 2013
 
Fundamental Analysis & Financial Analyst Recommandations - Google Inc - US382...
Fundamental Analysis & Financial Analyst Recommandations - Google Inc - US382...Fundamental Analysis & Financial Analyst Recommandations - Google Inc - US382...
Fundamental Analysis & Financial Analyst Recommandations - Google Inc - US382...
 
Softchoice Corp Investment Overview
Softchoice Corp Investment OverviewSoftchoice Corp Investment Overview
Softchoice Corp Investment Overview
 
Financial Analysis - Kubota corporation manufactures industrial machinery,…
Financial Analysis - Kubota corporation manufactures industrial machinery,…Financial Analysis - Kubota corporation manufactures industrial machinery,…
Financial Analysis - Kubota corporation manufactures industrial machinery,…
 
2010 Annual Shareholders’Meeting - Pierre‐François RIOLACCI
2010 Annual Shareholders’Meeting - Pierre‐François RIOLACCI2010 Annual Shareholders’Meeting - Pierre‐François RIOLACCI
2010 Annual Shareholders’Meeting - Pierre‐François RIOLACCI
 
Financial Analysis - China Communications Construction Company Ltd. is a tran...
Financial Analysis - China Communications Construction Company Ltd. is a tran...Financial Analysis - China Communications Construction Company Ltd. is a tran...
Financial Analysis - China Communications Construction Company Ltd. is a tran...
 
Financial Analysis - PetroChina Company Limited explores, develops, and produ...
Financial Analysis - PetroChina Company Limited explores, develops, and produ...Financial Analysis - PetroChina Company Limited explores, develops, and produ...
Financial Analysis - PetroChina Company Limited explores, develops, and produ...
 
ARM-ed and dangerous
ARM-ed and dangerousARM-ed and dangerous
ARM-ed and dangerous
 
SKF First-quarter result slide show
SKF First-quarter result slide showSKF First-quarter result slide show
SKF First-quarter result slide show
 
2009 Annual Shareholders’Meeting - Presentation of Thomas Piquemal
2009 Annual Shareholders’Meeting - Presentation of Thomas Piquemal2009 Annual Shareholders’Meeting - Presentation of Thomas Piquemal
2009 Annual Shareholders’Meeting - Presentation of Thomas Piquemal
 
2Q09 Results
2Q09 Results2Q09 Results
2Q09 Results
 
Note Goldman Sachs sur Maroc Telecom Février 2013
Note Goldman Sachs sur Maroc Telecom Février 2013Note Goldman Sachs sur Maroc Telecom Février 2013
Note Goldman Sachs sur Maroc Telecom Février 2013
 
Financial Analysis - Shanghai Construction Co., ltd. undertakes a variety …
Financial Analysis - Shanghai Construction Co., ltd. undertakes a variety …Financial Analysis - Shanghai Construction Co., ltd. undertakes a variety …
Financial Analysis - Shanghai Construction Co., ltd. undertakes a variety …
 
Essel Propack
Essel PropackEssel Propack
Essel Propack
 
Financial Analysis - Zhejiang Expressway Co., ltd., through its subsidiari…
Financial Analysis - Zhejiang Expressway Co., ltd., through its subsidiari…Financial Analysis - Zhejiang Expressway Co., ltd., through its subsidiari…
Financial Analysis - Zhejiang Expressway Co., ltd., through its subsidiari…
 
Conference Call Presentation 4Q09
Conference Call Presentation 4Q09Conference Call Presentation 4Q09
Conference Call Presentation 4Q09
 
AREVA, Business & strategy overview - January 2009
AREVA, Business & strategy overview - January 2009AREVA, Business & strategy overview - January 2009
AREVA, Business & strategy overview - January 2009
 
Financial analysis - MBIA Inc. provides financial guarantee insurance and …
Financial analysis - MBIA Inc. provides financial guarantee insurance and …Financial analysis - MBIA Inc. provides financial guarantee insurance and …
Financial analysis - MBIA Inc. provides financial guarantee insurance and …
 

More from BCV

Le Temps - 20 Octobre 2014 - Eclairage psychologique d'un choix rationnel
Le Temps - 20 Octobre 2014 - Eclairage psychologique d'un choix rationnelLe Temps - 20 Octobre 2014 - Eclairage psychologique d'un choix rationnel
Le Temps - 20 Octobre 2014 - Eclairage psychologique d'un choix rationnel
BCV
 
Fundamental analysis & recommendations qms advisors flex index spi index - ...
Fundamental analysis & recommendations   qms advisors flex index spi index - ...Fundamental analysis & recommendations   qms advisors flex index spi index - ...
Fundamental analysis & recommendations qms advisors flex index spi index - ...
BCV
 
Fundamental Analysis & Recommendations - QMS Advisors FlexIndex KOSPI 100
Fundamental Analysis & Recommendations - QMS Advisors FlexIndex KOSPI 100 Fundamental Analysis & Recommendations - QMS Advisors FlexIndex KOSPI 100
Fundamental Analysis & Recommendations - QMS Advisors FlexIndex KOSPI 100
BCV
 
Fundamental Equity Analysis - QMS Advisors HDAX FlexIndex 110
Fundamental Equity Analysis - QMS Advisors HDAX FlexIndex 110Fundamental Equity Analysis - QMS Advisors HDAX FlexIndex 110
Fundamental Equity Analysis - QMS Advisors HDAX FlexIndex 110
BCV
 
Fundamental analysis & recommendations spi index - the swiss performance in...
Fundamental analysis & recommendations   spi index - the swiss performance in...Fundamental analysis & recommendations   spi index - the swiss performance in...
Fundamental analysis & recommendations spi index - the swiss performance in...
BCV
 

More from BCV (20)

Vers la couverture des risques systémiques
Vers la couverture des risques systémiquesVers la couverture des risques systémiques
Vers la couverture des risques systémiques
 
Le plus convexe des investissements linéaires
Le plus convexe des investissements linéairesLe plus convexe des investissements linéaires
Le plus convexe des investissements linéaires
 
Keine angst vor zinsanstieg
Keine angst vor zinsanstiegKeine angst vor zinsanstieg
Keine angst vor zinsanstieg
 
Des performances stables avec les certificats de primes de risque
Des performances stables avec les certificats de primes de risqueDes performances stables avec les certificats de primes de risque
Des performances stables avec les certificats de primes de risque
 
Evaluation de l'incidence des produits structurés sur les marchés actions
Evaluation de l'incidence des produits structurés sur les marchés actionsEvaluation de l'incidence des produits structurés sur les marchés actions
Evaluation de l'incidence des produits structurés sur les marchés actions
 
Erfolg ohne Absturzrisiko - Derivate machen es möglich
Erfolg ohne Absturzrisiko - Derivate machen es möglichErfolg ohne Absturzrisiko - Derivate machen es möglich
Erfolg ohne Absturzrisiko - Derivate machen es möglich
 
Vers la couverture des risques systémiques?
Vers la couverture des risques systémiques?Vers la couverture des risques systémiques?
Vers la couverture des risques systémiques?
 
qCIO Global Macro Hedge Fund Strategy - March 2015
qCIO Global Macro Hedge Fund Strategy - March 2015qCIO Global Macro Hedge Fund Strategy - March 2015
qCIO Global Macro Hedge Fund Strategy - March 2015
 
qCIO Global Macro Hedge Fund Strategy - November 2014
qCIO Global Macro Hedge Fund Strategy - November 2014qCIO Global Macro Hedge Fund Strategy - November 2014
qCIO Global Macro Hedge Fund Strategy - November 2014
 
Le Temps - 20 Octobre 2014 - Eclairage psychologique d'un choix rationnel
Le Temps - 20 Octobre 2014 - Eclairage psychologique d'un choix rationnelLe Temps - 20 Octobre 2014 - Eclairage psychologique d'un choix rationnel
Le Temps - 20 Octobre 2014 - Eclairage psychologique d'un choix rationnel
 
Le Temps - 21 octobre 2013 - Benchmarker un produit structuré
Le Temps - 21 octobre 2013 - Benchmarker un produit structuréLe Temps - 21 octobre 2013 - Benchmarker un produit structuré
Le Temps - 21 octobre 2013 - Benchmarker un produit structuré
 
Le temps - 30 juin 2014 - Des instruments plus flexibles dans l'obligataire
Le temps - 30 juin 2014 - Des instruments plus flexibles dans l'obligataireLe temps - 30 juin 2014 - Des instruments plus flexibles dans l'obligataire
Le temps - 30 juin 2014 - Des instruments plus flexibles dans l'obligataire
 
INDICES Mai 2014 Produits financiers - Surévaluation de la volatilité implicit...
INDICES Mai 2014 Produits financiers - Surévaluation de la volatilité implicit...INDICES Mai 2014 Produits financiers - Surévaluation de la volatilité implicit...
INDICES Mai 2014 Produits financiers - Surévaluation de la volatilité implicit...
 
Fundamental analysis & recommendations qms advisors flex index spi index - ...
Fundamental analysis & recommendations   qms advisors flex index spi index - ...Fundamental analysis & recommendations   qms advisors flex index spi index - ...
Fundamental analysis & recommendations qms advisors flex index spi index - ...
 
Fundamental Analysis & Recommendations - QMS Advisors FlexIndex KOSPI 100
Fundamental Analysis & Recommendations - QMS Advisors FlexIndex KOSPI 100 Fundamental Analysis & Recommendations - QMS Advisors FlexIndex KOSPI 100
Fundamental Analysis & Recommendations - QMS Advisors FlexIndex KOSPI 100
 
Fundamental Equity Analysis - QMS Advisors HDAX FlexIndex 110
Fundamental Equity Analysis - QMS Advisors HDAX FlexIndex 110Fundamental Equity Analysis - QMS Advisors HDAX FlexIndex 110
Fundamental Equity Analysis - QMS Advisors HDAX FlexIndex 110
 
Fundamental Analysis & Recommendations - OEX Index - The Standard & Poor's 10...
Fundamental Analysis & Recommendations - OEX Index - The Standard & Poor's 10...Fundamental Analysis & Recommendations - OEX Index - The Standard & Poor's 10...
Fundamental Analysis & Recommendations - OEX Index - The Standard & Poor's 10...
 
Fundamental analysis & recommendations spi index - the swiss performance in...
Fundamental analysis & recommendations   spi index - the swiss performance in...Fundamental analysis & recommendations   spi index - the swiss performance in...
Fundamental analysis & recommendations spi index - the swiss performance in...
 
Fundamental Equity Analysis - QMS Global Agriculture FlexIndex - The QMS Advi...
Fundamental Equity Analysis - QMS Global Agriculture FlexIndex - The QMS Advi...Fundamental Equity Analysis - QMS Global Agriculture FlexIndex - The QMS Advi...
Fundamental Equity Analysis - QMS Global Agriculture FlexIndex - The QMS Advi...
 
Fundamental Equity Analysis and Analyst Recommandations - MSCI Emerging Marke...
Fundamental Equity Analysis and Analyst Recommandations - MSCI Emerging Marke...Fundamental Equity Analysis and Analyst Recommandations - MSCI Emerging Marke...
Fundamental Equity Analysis and Analyst Recommandations - MSCI Emerging Marke...
 

Financial analysis electricite de france sa - produces, transmits, distributes, imports and exports electricity. the company, using nuclear power, coal and gas, provides electricity for french energy consumers

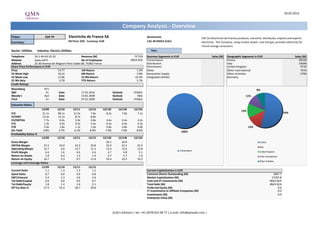
  • 1. 20.02.2013 Company Analysis - Overview Ticker: EDF FP Electricite de France SA Benchmark: EDF SA (Electricite de France) produces, transmits, distributes, imports and exports Currency: EN Paris: EDF, Currency: EUR CAC 40 INDEX (CAC) electricity. The Company, using nuclear power, coal and gas, provides electricity for French energy consumers. Sector: Utilities Industry: Electric Utilities Year: Telephone 33-1-40-42-22-22 Revenue (M) 72'729 Business Segments in EUR Sales (M) Geographic Segments in EUR Sales (M) Website www.edf.fr No of Employees #N/A N/A Transmission 1 France 39120 Address 22-30 Avenue de Wagram Paris Cedex 08, 75382 France Distribution Italy 10098 Share Price Performance in EUR Eliminations United Kingdom 9739 Price 14.77 1M Return 1.3% Other Other International 7976 52 Week High 18.22 6M Return -7.8% Generation Supply Other Activities 5796 52 Week Low 12.86 52 Wk Return -16.3% Integrated Utilities Germany 52 Wk Beta 0.78 YTD Return 5.7% Credit Ratings Bloomberg HY1 8% S&P A+ Date 17.01.2012 Outlook STABLE Moody's Aa3 Date 14.01.2009 Outlook NEG 11% Fitch A+ Date 07.01.2009 Outlook STABLE Valuation Ratios 12/09 12/10 12/11 12/12 12/13E 12/14E 12/15E 13% P/E 21.1x 89.1x 11.5x 7.8x 8.2x 7.8x 7.1x 54% EV/EBIT 13.3x 15.1x 8.7x 8.8x - - - EV/EBITDA 7.7x 6.0x 4.9x 4.8x 4.6x 4.4x 4.2x P/S 1.3x 0.9x 0.5x 0.4x 0.4x 0.4x 0.3x P/B 2.6x 1.8x 1.1x 1.0x 0.8x 0.8x 0.8x 14% Div Yield 2.8% 3.7% 6.1% 8.9% 7.9% 7.9% 8.0% 100% Profitability Ratios % 12/09 12/10 12/11 12/12 12/13E 12/14E 12/15E Gross Margin - - - - 20.1 20.8 - France EBITDA Margin 27.2 24.0 22.3 20.8 22.0 22.2 22.5 Italy Operating Margin 15.7 9.6 12.7 11.3 12.4 12.6 12.8 Transmission Profit Margin 6.6 1.6 4.6 4.6 4.7 4.8 5.1 United Kingdom Return on Assets 1.8 0.4 1.3 1.4 2.7 2.7 1.9 Other International Return on Equity 14.7 3.3 9.7 11.8 10.4 10.5 10.5 Other Activities Leverage and Coverage Ratios 12/09 12/10 12/11 12/12 Current Ratio 1.1 1.3 1.3 1.2 Current Capitalization in EUR Quick Ratio 0.7 0.8 0.9 0.8 Common Shares Outstanding (M) 1847.7 EBIT/Interest 3.4 2.3 3.6 3.4 Market Capitalization (M) 27307.8 Tot Debt/Capital 0.6 0.6 0.6 0.7 Cash and ST Investments (M) #N/A N/A Tot Debt/Equity 1.8 1.4 1.6 2.1 Total Debt (M) #N/A N/A Eff Tax Rate % 27.5 55.4 28.7 30.8 Preferred Equity (M) 0.0 LT Investments in Affiliate Companies (M) 0.0 Investments (M) 0.0 Enterprise Value (M) Q.M.S Advisors | tel: +41 (0)78 922 08 77 | e-mail: info@qmsadv.com |
  • 2. Company Analysis - Analysts Ratings Electricite de France SA Target price in EUR Broker Recommendation Buy and Sell Recommendations vs Price and Target Price Price Brokers' Target Price 35 35 100% 4% 4% 4% 8% 15% 15% 17% 30 22% 24% 25% 30 30% 80% 41% 25 50% 50% 48% 25 46% 20 42% 35% 60% 50% 50% 38% 20 15 45% 50% 10 15 40% 36% 5 10 48% 0 46% 46% 46% 42% 43% Day by Day Bryan Garnier & Cie Morgan Stanley 20% Barclays Kepler Capital Markets Main First Bank AG S&P Capital IQ Raymond James Natixis Exane BNP Paribas Macquarie Credit Suisse Societe Generale Nomura HSBC DZ Bank AG EVA Dimensions AlphaValue Berenberg Bank Goldman Sachs Deutsche Bank Landesbank Baden- 35% 35% 38% 30% 5 Wuerttemberg 20% 23% 0% 0 févr.12 mars.12 avr.12 mai.12 juin.12 juil.12 août.12 sept.12 oct.12 nov.12 déc.12 janv.13 Buy Hold Sell Price Target Price Date Buy Hold Sell Date Price Target Price Broker Analyst Recommendation Target Date 31-Jan-13 23% 36% 41% 20-Feb-13 14.77 16.05 Societe Generale VINCENT AYRAL buy 20.00 20-Feb-13 31-Dec-12 30% 45% 25% 19-Feb-13 14.95 16.05 AlphaValue MYRIAM COHEN add 16.00 19-Feb-13 30-Nov-12 20% 50% 30% 18-Feb-13 14.80 16.05 Kepler Capital Markets INGO BECKER reduce 13.00 15-Feb-13 31-Oct-12 38% 38% 24% 15-Feb-13 14.68 16.05 Bryan Garnier & Cie JULIEN DESMARETZ sell 12.00 15-Feb-13 28-Sep-12 43% 35% 22% 14-Feb-13 14.95 16.07 Natixis PHILIPPE OURPATIAN neutral 16.20 15-Feb-13 31-Aug-12 42% 42% 17% 13-Feb-13 14.24 16.07 Exane BNP Paribas BENJAMIN LEYRE outperform 20.00 15-Feb-13 31-Jul-12 46% 46% 8% 12-Feb-13 14.20 16.07 Barclays JULIE ARAV underweight 13.00 15-Feb-13 29-Jun-12 48% 48% 4% 11-Feb-13 14.24 16.07 Goldman Sachs ANDREW MEAD buy/attractive 18.90 8-Feb-13 31-May-12 46% 50% 4% 8-Feb-13 14.16 16.07 Macquarie ATALLAH ESTEPHAN outperform 19.00 7-Feb-13 30-Apr-12 46% 50% 4% 7-Feb-13 13.73 16.09 Berenberg Bank ROBERT CHANTRY hold 14.60 5-Feb-13 30-Mar-12 35% 50% 15% 6-Feb-13 13.78 16.09 Day by Day VALERIE GASTALDY hold 31-Jan-13 29-Feb-12 35% 50% 15% 5-Feb-13 13.90 16.17 Main First Bank AG ANDREAS THIELEN underperform 15.50 29-Jan-13 4-Feb-13 13.92 16.26 S&P Capital IQ CLIVE ROBERTS sell 12.00 28-Jan-13 1-Feb-13 14.21 16.26 EVA Dimensions AUSTIN BURKETT underweight 17-Jan-13 31-Jan-13 14.15 16.45 Morgan Stanley EMMANUEL TURPIN Equalwt/In-Line 23.00 15-Jan-13 30-Jan-13 14.41 16.45 Credit Suisse MICHEL DEBS underperform 12.00 11-Jan-13 29-Jan-13 14.59 16.45 Deutsche Bank MARTIN BROUGH sell 12.50 7-Jan-13 28-Jan-13 14.43 16.51 Nomura MARTIN YOUNG buy 18.75 12-Dec-12 25-Jan-13 14.55 16.51 Landesbank Baden-Wuerttemberg ERKAN AYCICEK hold 16.50 3-Dec-12 24-Jan-13 14.52 16.51 HSBC ADAM DICKENS neutral 17.00 14-Nov-12 23-Jan-13 14.50 16.51 Raymond James EMMANUEL RETIF market perform 13-Nov-12 22-Jan-13 14.71 16.51 DZ Bank AG HASIM SENGUEL buy 33.00 15-Nov-11 21-Jan-13 14.88 16.51 18-Jan-13 14.58 16.51 17-Jan-13 14.71 16.51 16-Jan-13 14.52 16.51 15-Jan-13 14.67 16.51 14-Jan-13 14.37 16.51 11-Jan-13 13.66 16.51 10-Jan-13 13.89 16.41 Q.M.S Advisors | tel: +41 (0)78 922 08 77 | e-mail: info@qmsadv.com |
  • 3. 20.02.2013 Electricite de France SA Company Analysis - Ownership Ownership Type Ownership Statistics Geographic Ownership Distribution Geographic Ownership 0% Shares Outstanding (M) 1847.7 13% France 97.94% 0% 0% 0%0%0% Float 15.5% United States 1.29% 1% 0% Short Interest (M) Luxembourg 0.18% Short Interest as % of Float Canada 0.17% Days to Cover Shorts Britain 0.09% Institutional Ownership 87.04% Ireland 0.07% Retail Ownership 12.96% Spain 0.05% Insider Ownership 0.00% Others 0.21% Institutional Ownership Distribution 87% 99% Government 97.08% Investment Advisor 2.08% Mutual Fund Manager 0.83% Institutional Ownership Retail Ownership Insider Ownership Insurance Company 0.00% France United States Luxembourg Canada Pricing data is in EUR Others 0.00% Britain Ireland Spain Others Top 20 Owners: TOP 20 ALL Institutional Ownership Holder Name Position Position Change Market Value % of Ownership Report Date Source Country FRENCH STATE 1'561'222'705 0 23'059'259'353 84.44% 31.12.2011 Co File FRANCE 0% 1% 0% THORNBURG INVESTMENT 7'870'200 -2'229'800 116'242'854 0.43% 31.12.2012 MF-AGG UNITED STATES 2% NATIXIS ASSET MANAGE 5'682'211 -305'942 83'926'256 0.31% 31.12.2012 MF-AGG FRANCE VANGUARD GROUP INC 4'291'487 61'401 63'385'263 0.23% 31.12.2012 MF-AGG UNITED STATES BLACKROCK 2'348'697 2'036 34'690'255 0.13% 15.02.2013 ULT-AGG UNITED STATES NUVEEN ASSET MANAGEM 2'056'924 -93'060 30'380'767 0.11% 31.01.2013 MF-AGG UNITED STATES CI INVESTMENTS INC 1'966'710 1'964'810 29'048'307 0.11% 30.06.2012 MF-AGG CANADA AVIVA PLC 1'574'700 0 23'258'319 0.09% 31.01.2013 MF-AGG BRITAIN ING INTERNATIONAL AD 1'371'198 -156'801 20'252'594 0.07% 31.07.2012 MF-AGG LUXEMBOURG ELECTRICITE DE FRANC 1'175'594 0 17'363'523 0.06% 31.12.2011 Co File FRANCE 97% ALLIANCE BERNSTEIN 1'171'218 5'290 17'298'890 0.06% 31.12.2012 ULT-AGG UNITED STATES AMUNDI 1'017'724 -66'541 15'031'783 0.06% 28.09.2012 MF-AGG FRANCE AMUNDI 843'591 0 12'459'839 0.05% 28.09.2012 MF-AGG FRANCE CI INVESTMENTS INC 763'219 603'463 11'272'745 0.04% 31.08.2012 MF-AGG CANADA Government Investment Advisor Mutual Fund Manager Insurance Company Others BANK OF NEW YORK MEL 711'261 0 10'505'325 0.04% 15.02.2013 MF-AGG UNITED STATES ROTHSCHILD & COMPAGN 680'000 40'000 10'043'600 0.04% 31.12.2012 MF-AGG FRANCE SANFORD C BERNSTEIN 656'530 0 9'696'948 0.04% 30.11.2012 MF-AGG UNITED STATES AGICAM 639'382 -5'309 9'443'672 0.03% 30.04.2012 MF-AGG FRANCE TAUBE HODSON STONEX 610'970 -2'190 9'024'027 0.03% 30.11.2012 MF-AGG BRITAIN STATE STREET BANQUE 591'042 -27'639 8'729'690 0.03% 31.12.2012 MF-AGG FRANCE Top 5 Insiders: Holder Name Position Position Change Market Value % of Ownership Report Date Source GRILLAT ALEXANDRE 328 4'845 0.00% 31.12.2011 Co File CROUZET PHILIPPE 200 2'954 0.00% 31.12.2011 Co File JAY MICHAEL HASTIN 200 2'954 0.00% 31.12.2011 Co File LAFONT BRUNO 150 2'216 0.00% 31.12.2011 Co File FAUGERE MIREILLE 106 1'566 0.00% 31.12.2011 Co File Q.M.S Advisors | tel: +41 (0)78 922 08 77 | e-mail: info@qmsadv.com |
  • 4. Company Analysis - Financials I/IV Electricite de France SA Financial information is in EUR (M) Equivalent Estimates Periodicity: Fiscal Year 12/02 12/03 12/04 12/05 12/06 12/07 12/08 12/09 12/10 12/11 12/12 12/13E 12/14E 12/15E Income Statement Revenue 48'359 44'919 46'788 51'047 58'932 59'637 63'847 59'140 65'320 65'307 72'729 72'842 75'945 79'298 - Cost of Goods Sold Gross Income 14'641 15'797 - Selling, General & Admin Expenses 43'893 38'930 38'403 43'054 49'576 49'646 55'937 49'834 59'080 57'021 64'484 (Research & Dev Costs) 402 389 375 421 438 486 518 Operating Income 4'466 5'989 8'385 7'993 9'356 9'991 7'910 9'306 6'240 8'286 8'245 9'038 9'580 10'138 - Interest Expense 1'986 1'508 1'568 1'556 1'655 1'660 1'684 2'529 2'528 2'017 2'443 - Foreign Exchange Losses (Gains) 96 -24 59 -175 -36 72 66 9 -63 15 - Net Non-Operating Losses (Gains) 983 2'003 5'075 1'844 819 634 933 1'562 1'827 1'703 659 Pretax Income 1'401 2'502 1'683 4'768 6'918 7'625 5'227 5'206 1'948 4'551 5'143 5'056 5'441 5'663 - Income Tax Expense 986 1'567 1'072 1'445 1'146 1'841 1'599 1'432 1'079 1'305 1'586 Income Before XO Items 415 935 611 3'323 5'772 5'784 3'628 3'774 869 3'246 3'557 - Extraordinary Loss Net of Tax 0 0 0 -5 -9 0 -311 -380 0 0 - Minority Interests -66 78 -13 93 172 175 144 183 229 236 241 Diluted EPS Before XO Items 0.53 0.38 1.96 3.07 3.08 1.91 1.97 0.34 1.63 1.80 Net Income Adjusted* 481 857 1'341 3'242 4'227 4'718 4'308 3'905 3'925 3'520 4'216 3'420 3'635 4'026 EPS Adjusted 0.00 0.00 0.38 1.97 2.33 2.59 2.37 2.14 2.12 1.91 2.29 1.80 1.91 2.09 Dividends Per Share 0.00 0.79 1.16 1.28 1.28 1.15 1.15 1.15 1.25 1.16 1.16 1.18 Payout Ratio % 0.0 0.0 44.6 37.7 41.6 66.8 59.2 331.6 70.6 69.7 0.65 0.61 0.56 Total Shares Outstanding 1'626 1'626 1'822 1'822 1'822 1'819 1'849 1'848 1'848 1'848 Diluted Shares Outstanding 1'626 1'626 1'648 1'822 1'822 1'823 1'824 1'848 1'847 1'842 EBITDA 9'881 12'523 13'227 13'010 14'719 15'619 13'624 16'102 15'688 14'571 15'094 16'058 16'878 17'841 *Net income excludes extraordinary gains and losses and one-time charges. Q.M.S Advisors | tel: +41 (0)78 922 08 77 | e-mail: info@qmsadv.com |
  • 5. Company Analysis - Financials II/IV Periodicity: 12/02 12/03 12/04 12/05 12/06 12/07 12/08 12/09 12/10 12/11 12/12 12/13E 12/14E 12/15E Balance Sheet Total Current Assets 30765 31909 35784 47612 48262 51577 59154 60214 63670 67980 68085 + Cash & Near Cash Items 1'172 2'523 3'820 7'220 3'308 6'035 5'869 6'982 4'829 5'743 5'874 + Short Term Investments 2'511 11'966 17'010 14'876 12'450 16'788 16'980 16'433 + Accounts & Notes Receivable 12'368 14'394 13'733 16'107 15'716 16'100 19'144 19'633 19'524 20'908 22'497 + Inventories 8'102 6'924 6'678 6'695 7'431 8'678 9'290 12'662 12'685 13'581 14'213 + Other Current Assets 6'612 8'068 11'553 5'624 4'797 5'888 24'851 8'487 9'844 10'768 9'068 Total Long-Term Assets 114'074 114'991 115'675 123'524 130'824 134'572 141'338 179'821 176'889 163'727 182'033 + Long Term Investments 8'569 7'315 8'118 9'012 13'094 15'805 18'103 24'498 24'921 24'517 30'471 Gross Fixed Assets 180'818 179'049 181'351 188'655 193'422 198'301 204'620 231'582 199'645 208'464 Accumulated Depreciation 85'396 80'037 83'706 86'988 89'541 93'360 97'045 103'540 92'445 96'496 + Net Fixed Assets 95'422 99'012 97'645 101'667 103'881 104'941 107'575 128'042 107'200 111'968 122'242 + Other Long Term Assets 10'083 8'664 9'912 12'845 13'849 13'826 15'660 27'281 44'768 27'242 29'320 Total Current Liabilities 33'583 35'356 37'278 39'932 44'922 48'692 58'217 57'177 49'651 50'909 58'368 + Accounts Payable 6'353 8'164 6'663 8'872 9'457 9'867 13'957 13'348 12'805 13'681 14'643 + Short Term Borrowings 8'146 9'890 9'759 11'933 15'110 16'918 18'958 16'560 12'766 12'789 17'521 + Other Short Term Liabilities 19'084 17'302 20'856 19'127 20'355 21'907 25'302 27'269 24'080 24'439 26'204 Total Long Term Liabilities 96'387 91'705 104'212 110'930 109'365 108'661 117'277 148'191 154'005 145'891 161'038 + Long Term Borrowings 21'366 19'714 20'636 23'511 19'983 17'607 25'584 44'755 40'646 42'688 46'980 + Other Long Term Borrowings 75'021 71'991 83'576 87'419 89'382 91'054 91'693 103'436 113'359 103'203 114'058 Total Liabilities 129'970 127'061 141'490 150'862 154'287 157'353 175'494 205'368 203'656 196'800 219'406 + Long Preferred Equity 0 0 0 0 0 0 0 0 0 0 0 + Minority Interest 986 915 897 961 1'490 1'586 1'801 4'776 5'586 4'337 4'854 + Share Capital & APIC 8'154 8'129 8'129 911 911 911 911 924 924 924 924 + Retained Earnings & Other Equity 5'729 10'795 943 18'402 22'398 26'299 22'286 28'967 30'393 29'646 24'934 Total Shareholders Equity 14'869 19'839 9'969 20'274 24'799 28'796 24'998 34'667 36'903 34'907 30'712 Total Liabilities & Equity 144'839 146'900 151'459 171'136 179'086 186'149 200'492 240'035 240'559 231'707 250'118 Book Value Per Share 11.64 5.58 10.60 12.79 14.93 12.75 16.17 16.94 16.54 13.99 18.00 17.69 18.86 Tangible Book Value Per Share 7.63 1.48 5.62 7.73 9.62 7.31 5.83 7.94 7.70 4.23 Q.M.S Advisors | tel: +41 (0)78 922 08 77 | e-mail: info@qmsadv.com |
  • 6. Company Analysis - Financials III/IV Periodicity: 12/02 12/03 12/04 12/05 12/06 12/07 12/08 12/09 12/10 12/11 12/12 12/13E 12/14E 12/15E Cash Flows Net Income 481 857 624 3'230 5'605 5'618 3'484 3'902 1'020 3'010 3'316 3'449 3'600 3'949 + Depreciation & Amortization 5'415 6'534 4'842 5'017 5'363 5'628 5'714 6'796 9'448 6'285 6'849 + Other Non-Cash Adjustments 2'753 -712 2'056 -1'179 173 -755 -1'415 1'983 977 987 2'149 + Changes in Non-Cash Capital 470 17 473 1'371 654 -269 -211 -1'468 -335 -1'785 -2'390 Cash From Operating Activities 9'119 6'696 7'995 8'439 11'795 10'222 7'572 11'213 11'110 8'497 9'924 + Disposal of Fixed Assets 1'683 1'778 383 392 272 229 214 201 188 497 748 + Capital Expenditures -7'486 -4'963 -4'940 -5'168 -5'935 -7'490 -9'703 -11'777 -12'241 -11'134 -13'386 -12'737 -12'808 -13'620 + Increase in Investments 0 -1'413 -2'894 -8'797 -6'895 -6'272 -1'792 + Decrease in Investments 0 0 761 1'580 462 222 + Other Investing Activities -4'080 -557 -97 -2'951 691 253 -281 -14'120 3'398 3'624 20 Cash From Investing Activities -9'883 -5'155 -3'893 -10'621 -13'769 -5'428 -16'665 -25'234 -14'927 -6'791 -14'410 + Dividends Paid -378 -208 -321 -374 -1'439 -3'170 -2'438 -1'228 -2'163 -2'122 -2'125 + Change in Short Term Borrowings 0 0 + Increase in Long Term Borrowings 6'250 8'236 3'865 2'810 3'686 7'059 15'717 29'272 8'642 5'846 12'431 + Decrease in Long Term Borrowings -3'893 -9'287 -7'230 -3'247 -4'254 -6'357 -4'882 -15'244 -4'652 -4'071 -4'869 + Increase in Capital Stocks 0 33 43 6'377 24 178 249 12 + Decrease in Capital Stocks 0 0 -6 -180 -10 -14 -15 + Other Financing Activities 178 122 162 686 45 229 461 2'549 488 -1'230 -809 Cash From Financing Activities 2'157 -1'104 -3'481 6'252 -1'938 -2'067 8'927 15'361 2'305 -1'591 4'613 Net Changes in Cash 1'393 437 621 4'070 -3'912 2'727 -166 1'340 -1'512 115 127 Free Cash Flow (CFO-CAPEX) 1'633 1'733 3'055 3'271 5'860 2'732 -2'131 -564 -1'131 -2'637 -3'462 -1'844 -1'146 -1'878 Free Cash Flow To Firm 2'221 2'297 3'624 4'355 7'241 3'991 -962 1'269 -3 -1'198 -1'772 Free Cash Flow To Equity 5'673 2'460 73 3'226 5'564 3'663 8'918 13'665 3'047 -365 4'848 Free Cash Flow per Share 1.07 1.88 1.98 3.22 1.50 -1.17 -0.31 -0.61 -1.43 -1.88 Q.M.S Advisors | tel: +41 (0)78 922 08 77 | e-mail: info@qmsadv.com |
  • 7. Company Analysis - Financials IV/IV Periodicity: 12/02 12/03 12/04 12/05 12/06 12/07 12/08 12/09 12/10 12/11 12/12 12/13E 12/14E 12/15E Ratio Analysis Valuation Ratios Price Earnings 16.3x 17.9x 26.5x 21.7x 21.1x 89.1x 11.5x 7.8x 8.2x 7.8x 7.1x EV to EBIT 9.4x 12.5x 16.4x 14.7x 13.3x 15.1x 8.7x 8.8x EV to EBITDA 5.8x 7.9x 10.5x 8.5x 7.7x 6.0x 4.9x 4.8x 4.6x 4.4x 4.2x Price to Sales 1.0x 1.7x 2.5x 1.2x 1.3x 0.9x 0.5x 0.4x 0.4x 0.4x 0.3x Price to Book 3.0x 4.3x 5.5x 3.3x 2.6x 1.8x 1.1x 1.0x 0.8x 0.8x 0.8x Dividend Yield 2.5% 2.1% 1.6% 3.1% 2.8% 3.7% 6.1% 8.9% 7.9% 7.9% 8.0% Profitability Ratios Gross Margin 20.1% 20.8% EBITDA Margin 20.4% 27.9% 28.3% 25.5% 25.0% 26.2% 21.3% 27.2% 24.0% 22.3% 20.8% 22.0% 22.2% 22.5% Operating Margin 9.2% 13.3% 17.9% 15.7% 15.9% 16.8% 12.4% 15.7% 9.6% 12.7% 11.3% 12.4% 12.6% 12.8% Profit Margin 1.0% 1.9% 1.3% 6.3% 9.5% 9.4% 5.5% 6.6% 1.6% 4.6% 4.6% 4.7% 4.8% 5.1% Return on Assets 0.3% 0.6% 0.4% 2.0% 3.2% 3.1% 1.8% 1.8% 0.4% 1.3% 1.4% 2.7% 2.7% 1.9% Return on Equity 3.5% 5.2% 4.5% 22.8% 26.3% 22.2% 13.8% 14.7% 3.3% 9.7% 11.8% 10.4% 10.5% 10.5% Leverage & Coverage Ratios Current Ratio 0.92 0.90 0.96 1.19 1.07 1.06 1.02 1.05 1.28 1.34 1.17 Quick Ratio 0.48 0.48 0.47 0.88 0.80 0.76 0.43 0.68 0.83 0.86 0.77 Interest Coverage Ratio (EBIT/I) 2.25 3.97 5.35 5.14 5.65 6.02 4.70 3.43 2.27 3.65 3.37 Tot Debt/Capital 0.66 0.60 0.75 0.64 0.59 0.55 0.64 0.64 0.59 0.61 0.68 Tot Debt/Equity 1.98 1.49 3.05 1.75 1.42 1.20 1.78 1.77 1.45 1.59 2.10 Others Asset Turnover 0.34 0.31 0.31 0.32 0.34 0.33 0.33 0.27 0.27 0.28 0.30 Accounts Receivable Turnover 4.08 3.36 3.33 3.42 3.70 3.75 3.62 3.05 3.34 3.23 3.35 Accounts Payable Turnover Inventory Turnover Effective Tax Rate 70.4% 62.6% 63.7% 30.3% 16.6% 24.1% 30.6% 27.5% 55.4% 28.7% 30.8% Q.M.S Advisors | tel: +41 (0)78 922 08 77 | e-mail: info@qmsadv.com |
  • 8. Company Analysis - Peers Comparision VEOLIA EDF GDF SUEZ E.ON SE RWE AG CENTRICA PLC SSE PLC ENEL SPA IBERDROLA SA ENDESA EDP ELETROBRAS-PR B FORTUM OYJ NATIONAL GRID PL UNITED UTILITIES ENVIRONNE Latest Fiscal Year: 12/2012 12/2011 12/2011 12/2011 12/2011 12/2011 03/2012 12/2011 12/2012 12/2011 12/2011 12/2011 12/2012 03/2012 03/2012 52-Week High 19.72 20.35 19.80 37.12 359.20 13.06 1'470.00 3.30 4.59 17.88 2.45 27.08 19.36 722.00 816.00 52-Week High Date 02.03.2012 21.08.2012 14.09.2012 20.03.2012 04.02.2013 16.03.2012 24.12.2012 14.01.2013 21.02.2012 09.01.2013 18.01.2013 22.02.2012 02.03.2012 13.12.2012 14.08.2012 52-Week Low 13.39 14.51 12.42 26.36 290.10 7.38 1'266.00 2.02 2.63 11.30 1.63 7.05 12.81 622.50 590.00 52-Week Low Date 29.11.2012 18.02.2013 08.02.2013 08.02.2013 23.02.2012 16.11.2012 27.02.2012 24.07.2012 26.07.2012 25.07.2012 31.05.2012 22.11.2012 23.07.2012 30.03.2012 12.04.2012 Daily Volume 864'051 1'845'709 8'937'428 1'641'657 3'322'492 1'882'661 976'088 15'425'305 12'558'743 112'252 4'631'629 161'100 2'048'243 3'961'987 1'462'289 Current Price (2/dd/yy) 14.77 14.56 12.89 27.86 352.60 9.40 1'438.00 2.91 3.70 17.25 2.31 11.72 14.60 708.00 735.50 52-Week High % Change -25.1% -28.5% -34.9% -25.0% -1.8% -28.0% -2.2% -11.7% -19.5% -3.5% -5.6% -56.7% -24.6% -1.9% -9.9% 52-Week Low % Change 10.3% 0.3% 3.8% 5.7% 21.5% 27.4% 13.6% 44.3% 40.5% 52.7% 41.8% 66.2% 14.0% 13.7% 24.7% Total Common Shares (M) 1'847.7 2'213.8 1'905.5 586.6 5'173.2 505.4 944.7 9'403.4 6'138.9 1'058.8 3'624.2 1'352.6 888.4 3'701.0 681.8 Market Capitalization 27'307.8 35'130.7 25'794.9 17'074.0 18'332.5 4'906.6 13'781.8 27'401.4 23'209.0 18'263.5 8'439.3 10'344.7 12'970.2 25'946.0 5'015.3 Total Debt 64'501.0 57'272.0 29'914.0 21'923.0 4'171.0 21'089.2 6'245.6 65'481.0 33'373.0 13'681.0 18'785.1 45'367.2 8'777.0 23'025.0 5'855.2 Preferred Stock - - - - - - - - - 180.0 - - - - - Minority Interest 4'854.0 17'340.0 3'876.0 1'344.0 - 2'765.4 - 15'650.0 325.0 5'388.0 3'277.2 358.8 616.0 7.0 - Cash and Equivalents 22'307.0 14'675.0 6'931.0 7'004.0 546.0 5'723.9 189.2 7'015.0 6'575.0 8'440.0 1'731.7 16'610.6 963.0 2'723.0 321.2 Enterprise Value 74'355.8 94'409.7 49'653.9 34'221.0 23'060.5 22'865.6 19'028.1 102'403.4 50'332.0 29'112.5 30'035.2 49'218.0 21'400.2 46'881.0 10'842.1 Valuation Total Revenue LFY 72'729.0 90'673.0 112'954.0 49'153.0 22'824.0 29'647.3 31'723.9 77'573.0 34'750.1 32'686.0 15'120.9 33'061.4 6'159.0 13'832.0 1'564.9 LTM 72'729.0 95'530.0 125'308.0 49'485.0 23'292.0 30'124.1 31'337.3 82'455.0 34'848.9 33'393.0 16'048.9 40'310.7 6'159.0 13'605.0 1'595.1 CY+1 72'841.7 93'543.0 112'559.6 51'061.5 23'250.8 29'402.8 32'010.7 78'736.1 33'220.0 32'238.6 14'932.7 31'485.0 6'259.3 14'377.7 1'643.6 CY+2 75'945.4 82'709.4 110'835.4 51'956.9 24'184.2 28'166.4 32'902.8 78'524.0 34'381.4 32'363.2 15'273.3 23'364.8 6'459.0 14'862.6 1'700.2 EV/Total Revenue LFY 1.0x 1.1x 0.6x 0.8x 0.9x 0.8x 0.6x 1.3x 1.5x 0.8x 1.9x 1.7x 3.4x 3.3x 6.8x LTM 1.0x 1.1x 0.5x 0.8x 0.9x 0.8x 0.6x 1.2x 1.5x 0.8x 1.8x 1.4x 3.4x 3.4x 6.7x CY+1 1.0x 1.0x 0.5x 0.7x 1.0x 0.7x 0.6x 1.1x 1.6x 1.0x 2.0x 0.9x 3.4x 3.3x 6.4x CY+2 1.0x 1.1x 0.4x 0.7x 0.9x 0.7x 0.6x 1.1x 1.5x 0.9x 1.9x 1.3x 3.3x 3.3x 6.4x EBITDA LFY 15'094.0 16'071.0 4'269.0 8'286.0 3'310.0 3'805.3 1'946.8 17'198.0 7'193.0 7'265.0 3'754.9 5'866.8 2'403.0 4'777.0 900.0 LTM 15'094.0 16'622.0 4'532.0 7'646.0 2'596.0 3'604.0 2'073.9 19'353.0 7'151.9 7'239.0 3'720.6 6'729.2 2'403.0 4'991.0 905.1 CY+1 16'058.4 17'089.4 10'690.1 8'631.3 3'628.9 2'716.6 2'167.6 16'561.4 7'591.3 7'051.6 3'720.3 6'673.5 2'442.6 5'102.9 965.1 CY+2 16'877.5 14'590.0 9'527.5 8'783.1 3'901.2 2'666.6 2'295.1 16'393.5 7'937.2 6'719.4 3'731.6 3'763.0 2'442.0 5'379.7 1'008.8 EV/EBITDA LFY 4.8x 6.4x 14.6x 4.7x 6.4x 6.0x 9.5x 5.9x 7.4x 3.7x 7.8x 9.4x 8.7x 9.6x 11.9x LTM 4.8x 6.2x 13.8x 5.1x 8.2x 6.4x 9.0x 5.2x 7.4x 3.7x 7.9x 8.2x 8.7x 9.2x 11.8x CY+1 4.7x 5.6x 4.8x 4.3x 6.3x 7.4x 9.6x 5.2x 6.8x 4.5x 8.0x 4.1x 8.8x 9.3x 11.0x CY+2 4.6x 6.1x 5.1x 4.1x 5.8x 7.1x 9.3x 5.2x 6.4x 4.4x 7.8x 8.2x 8.8x 9.1x 10.8x EPS LFY 1.80 2.04 -0.01 3.35 0.24 -0.89 1.29 0.44 0.47 2.01 0.31 2.76 - 0.51 0.47 LTM 1.80 1.61 -0.01 3.76 0.18 -0.04 0.25 0.37 0.47 1.79 0.30 3.09 1.59 0.64 0.48 CY+1 1.80 1.56 2.21 4.07 0.27 0.41 1.14 0.37 0.40 1.97 0.29 3.23 1.29 0.54 0.40 CY+2 1.91 1.39 1.31 3.95 0.28 0.63 1.17 0.36 0.42 1.77 0.27 1.31 1.26 0.55 0.44 P/E LFY 8.2x 9.0x - 7.4x 19.4x - 58.5x 8.0x 7.8x 9.6x 7.7x 3.8x 9.2x 11.1x 15.5x LTM 8.2x 8.5x 10.6x 7.4x 9.6x 376.5x 13.1x - 7.8x 9.4x 7.8x 3.8x - 13.0x 15.0x CY+1 8.2x 9.4x 5.8x 6.8x 13.1x 23.1x 12.6x 7.9x 9.3x 8.8x 8.1x 3.6x 11.3x 13.2x 18.2x CY+2 7.8x 10.5x 9.9x 7.1x 12.7x 14.9x 12.3x 8.2x 8.8x 9.8x 8.7x 9.0x 11.6x 12.9x 16.9x Revenue Growth 1 Year 11.4% 7.3% 21.6% (3.1%) 1.8% 3.1% 12.0% 7.8% 9.8% 4.8% 6.7% 10.9% (0.0%) (3.6%) 3.4% 5 Year 6.1% 34.1% 13.3% 6.4% 7.2% (0.3%) 18.0% 18.2% 7.9% 9.3% 9.5% 13.7% 7.7% 8.6% (5.1%) EBITDA Growth 1 Year 3.6% 1.0% (67.2%) (10.2%) (0.8%) 2.9% 4.9% 2.6% 2.8% (2.8%) 7.0% 10.0% 0.3% (1.4%) 0.0% 5 Year (0.7%) 26.1% (12.7%) 2.6% 11.3% 3.1% 5.7% 16.8% 8.1% 3.0% 10.2% (2.9%) 3.8% 7.5% 0.9% EBITDA Margin LTM 20.8% 17.4% 3.6% 15.5% 11.1% 12.0% 6.6% 23.5% 20.5% 21.7% 23.2% 16.7% 39.0% 36.7% 56.7% CY+1 22.0% 18.3% 9.5% 16.9% 15.6% 9.2% 6.8% 21.0% 22.9% 21.9% 24.9% 21.2% 39.0% 35.5% 58.7% CY+2 22.2% 17.6% 8.6% 16.9% 16.1% 9.5% 7.0% 20.9% 23.1% 20.8% 24.4% 16.1% 37.8% 36.2% 59.3% Leverage/Coverage Ratios Total Debt / Equity % 249.4% 91.0% 83.7% 139.3% 74.5% 298.3% 136.2% 168.8% 98.9% 70.9% 231.6% 59.0% 86.0% 249.2% Total Debt / Capital % 67.7% 41.6% 43.0% 56.2% 42.7% 68.2% 57.7% 54.6% 49.5% 35.5% 62.3% 37.0% 44.8% 71.3% Total Debt / EBITDA 4.273x 3.980x 6.872x 2.731x 2.207x 5.500x 2.961x 3.401x 4.666x 1.799x 5.549x 7.515x 3.653x 4.830x Net Debt / EBITDA 2.795x 2.878x 5.863x 2.041x 1.821x 4.238x 2.530x 3.032x 3.747x 0.710x 4.953x 5.746x 3.252x 4.193x EBITDA / Int. Expense 6.178x 6.400x 1.367x 7.795x 8.193x 4.417x 3.881x 6.247x 4.728x 9.290x 3.460x 1.457x 8.010x 2.040x Credit Ratings S&P LT Credit Rating A+ A *- A- BBB+ A- BBB+ A- BBB+ BBB BBB+ BB+ A- A- A- S&P LT Credit Rating Date 17.01.2012 29.01.2013 27.07.2012 27.07.2012 29.05.2009 24.11.2000 21.08.2009 08.03.2012 28.11.2012 08.03.2012 01.02.2012 17.11.2011 27.11.2012 24.08.2007 Moody's LT Credit Rating Aa3 A1 A3 A3 A3 Baa1 A3 Baa2 (P)Baa1 WR Ba1 Baa3 A2 Baa1 Moody's LT Credit Rating Date 14.01.2009 03.07.2012 05.10.2011 19.07.2011 21.06.2006 07.02.2012 22.09.2009 05.11.2012 05.11.2012 25.02.2009 16.02.2012 19.12.2012 15.07.2005 12.01.2007 Q.M.S Advisors | tel: +41 (0)78 922 08 77 | e-mail: info@qmsadv.com |